Table of contents
- Other pages in this release
- Main points
- Employment, unemployment and economic inactivity
- Hours worked
- Redundancies
- Pay As You Earn Real Time Information
- Claimant Count (Experimental Statistics)
- Vacancies
- Earnings growth
- Coronavirus and measuring the labour market
- Labour market data
- Glossary
- Measuring the data
- Strengths and limitations
- Related links
1. Other pages in this release
2. Main points
Early estimates for November 2020 suggest that there is a slight drop over the month in the number of payroll employees in the UK. Since February 2020, the number of payroll employees has fallen by 819,000; however, the larger falls were seen at the start of the coronavirus (COVID-19) pandemic.
Data from our Labour Force Survey (LFS) show a large increase in the unemployment rate while the employment rate continues to fall. The number of redundancies reached a record high in August to October 2020 although the weekly data show that while the level remains high there was a slight decrease in October.
Although decreasing over the year, total hours worked had a record increase from the low levels in the previous quarter, with the August to October period covering a time when a number of coronavirus (COVID-19) lockdown measures were eased. The number of people temporarily away from work has fallen since its peak in April and May 2020. The number of people away from work because of the pandemic and receiving no pay has also fallen and levelled off in recent months.
Vacancies have continued to recover in the latest period but are still below the levels seen before the impact of the coronavirus pandemic. Annual growth in employee pay continued to strengthen as more employees returned to work from furlough, but the estimated growth in average pay is also impacted by compositional effects of a fall in the number and proportion of lower-paid employee jobs.
The UK employment rate, in the three months to October 2020, was estimated at 75.2%, 0.9 percentage points lower than a year earlier and 0.5 percentage points lower than the previous quarter.
The UK unemployment rate, in the three months to October 2020, was estimated at 4.9%, 1.2 percentage points higher than a year earlier and 0.7 percentage points higher than the previous quarter.
Redundancies reached a record high of 370,000 in the three months to October 2020, an increase of a record 217,000 on the quarter, although the number of redundancies fell slightly in October 2020.
Early estimates for November 2020 indicate that the number of payrolled employees fell by 2.7% compared with November 2019, which is a fall of 781,000 employees; since February 2020, 819,000 fewer people were in payrolled employment.
The Claimant Count increased slightly in November 2020, to 2.7 million; this includes both those working with low income or hours and those who are not working.
There were an estimated 547,000 vacancies in the UK in September to November 2020; this is 251,000 fewer than a year ago and 110,000 more than the previous quarter.
Growth in average total pay (including bonuses) among employees for the three months August to October 2020 increased to 2.7%, and growth in regular pay (excluding bonuses) also increased to 2.8%.
The majority of data in this bulletin come from surveys of households and businesses. It is not possible to survey every household and business each month, so these statistics are estimates based on samples.
3. Employment, unemployment and economic inactivity
Figure 1: In the three months to October, employment was still falling sharply and unemployment was rising
UK employment, unemployment and economic inactivity rates, seasonally adjusted, between August to October 2005 and August to October 2020
Embed code
Source: Office for National Statistics – Labour Force Survey
Employment
Employment measures the number of people aged 16 years and over in paid work and those who had a job that they were temporarily away from (to which they are expecting to return). The employment rate is the proportion of people aged between 16 and 64 years who are in employment.
Estimates for August to October 2020 show 32.52 million people aged 16 years and over in employment, 280,000 fewer than a year earlier. This was the largest annual decrease since January to March 2010.
For people aged between 16 and 64 years, for August to October 2020:
the estimated employment rate for all people was 75.2%; this is 0.9 percentage points down on the same period the previous year and 0.5 percentage points down compared with the previous quarter (May to July 2020)
the estimated employment rate for men was 78.4%; this is 1.9 percentage points down on the same period the previous year and 1.1 percentage points down on the quarter
the estimated employment rate for women was 72.1%; this is 0.1 percentage points up on the same period the previous year but largely unchanged on the quarter
The single-month and weekly estimates of the employment rate suggest that the rate has been largely flat throughout the three-month period.
Estimates of the number of people in employment on the Labour Force Survey (LFS) are consistent with the International Labour Organization (ILO) definition of employment. Under this definition, employment includes both those who are in work during the reference period and those who are temporarily away from a job. The number of people who are estimated to be temporarily away from work includes furloughed workers, those on maternity or paternity leave and annual leave. Prior to the coronavirus (COVID-19) pandemic there was on average 2 to 2.5 million people temporarily away from work. Experimental estimates based on returns for individual weeks show that the number of people temporarily away from work rose to around 7.9 million people in April 2020 but has fallen to around 3.7 million people in October 2020. There were also around 211,000 people away from work because of the pandemic and receiving no pay in October 2020; this has fallen from around 658,000 in April 2020.
The Bank of England's Decision Maker Panel (DMP) for November 2020 shows businesses' expectation that the employment rate would be 6% lower than it would have otherwise been in the three months to December 2020, a modest improvement compared with 8% expected in October 2020. This is likely related to the extension of the Coronavirus Job Retention Scheme (CJRS) and Self-Employment Income Support Scheme (SEISS) announced at the end of October, as the proportion of workers on furlough reported by the DMP increased by 6 percentage points in the month to November, to 11%, while businesses expected their investment during October to December 2020 to be 25% lower than it would have been, a 5 percentage point decline on October expectations.
Unemployment
Unemployment measures people without a job who have been actively seeking work within the last four weeks and are available to start work within the next two weeks. The unemployment rate is not the proportion of the total population who are unemployed. It is the proportion of the economically active population (those in work plus those seeking and available to work) who are unemployed.
Estimates for August to October 2020 show an estimated 1.69 million people were unemployed, up 411,000 on the same period the previous year and up 241,000 on the quarter.
For people aged 16 years and over, for August to October 2020:
the estimated UK unemployment rate for all people was 4.9%; this is 1.2 percentage points higher than a year earlier and 0.7 percentage points higher than the previous quarter
the estimated UK unemployment rate for men was 5.3%; this is 1.3 percentage points higher than a year earlier and 0.8 percentage points higher than the previous quarter
the estimated UK unemployment rate for women was 4.6%; this is 1.0 percentage point higher than a year earlier and a joint record 0.6 percentage points higher than the previous quarter
the single-month and weekly estimates of the unemployment rate suggest that the rate has been increasing throughout the three-month period; the weekly unemployment rate was 5% or above for each of the last three weeks in October 2020
The PwC Economic Update (PDF, 1.15MB) highlighted that the prospect of growing unemployment may affect saving habits and consumer spending, as households tend to increase their saving as a share of disposable income during economic downturns - referred to as "precautionary saving". This phenomenon, alongside consumers moving away from "brick and mortar" spending to online shopping as a result of coronavirus restrictions may have further negative impact on employment in the retail industry.
Economic inactivity
Economic inactivity measures people without a job but who are not classed as unemployed because they have not been actively seeking work within the last four weeks and/or they are unable to start work within the next two weeks. Our headline measure of economic inactivity is for those aged between 16 and 64 years.
Estimates for August to October 2020 show 8.60 million people aged between 16 and 64 years not in the labour force (economically inactive). This was 4,000 less than a year earlier and 2,000 less than the previous quarter.
For people aged between 16 and 64 years, for August to October 2020:
- the estimated economic inactivity rate for all people was 20.8%; this is down by 0.1 percentage points on the same period the previous year but largely unchanged on the quarter
- the estimated economic inactivity rate for men was 17.1%; this is up by 0.8 percentage points on the same period the previous year and up by 0.4 percentage points on the quarter
- the estimated economic inactivity rate for women was at a record low of 24.4%; this is down by 0.9 percentage points on the same period the previous year and down by 0.4 percentage points on the quarter
4. Hours worked
Figure 2: Total hours worked still low but continuing to show signs of recovery
UK total actual weekly hours worked (people aged 16 years and over), seasonally adjusted, between August to October 2005 and August to October 2020
Source: Office for National Statistics – Labour Force Survey
Download this chart Figure 2: Total hours worked still low but continuing to show signs of recovery
Image .csv .xlsBetween May to July 2020 and August to October 2020, total actual weekly hours worked in the UK saw a record increase of 104.9 million, or 12.3%, to 960.0 million hours (Figure 2).
Average actual weekly hours worked saw a record increase of 3.3 hours on the quarter to 29.5 hours.
The Office for Budget Responsibility highlighted that the UK labour market has adjusted to the collapse in economic output differently from past recessions (PDF, 2.3MB), mainly with a reduction in average hours worked, instead of a more equal split between fall in employment and average hours worked.
Back to table of contents5. Redundancies
Figure 3: The number of people reporting redundancy in the three months prior to interview increased by a record 217,000 on the quarter to reach a record high of 370,000
UK redundancies, people aged 16 years and over (not seasonally adjusted), between August to October 2005 and August to October 2020
Source: Office for National Statistics – Labour Force Survey
Download this chart Figure 3: The number of people reporting redundancy in the three months prior to interview increased by a record 217,000 on the quarter to reach a record high of 370,000
Image .csv .xlsThe redundancy estimates measure the number of people who were made redundant or who took voluntary redundancy in the three months before the Labour Force Survey (LFS) interviews; it does not take into consideration planned redundancies. So, in this release, the latest estimates may relate to redundancies over the period from the beginning of May to the end of October 2020.
The number of people reporting redundancy in the three months prior to interview increased in August to October 2020 by a record 251,000 on the year, and a record 217,000 on the quarter, to a record high of 370,000 (Figure 3). Experimental weekly LFS estimates show that the number of people reporting redundancy in the three months prior to interview has been increasing since June 2020 and remains high in October but has dropped from the peak in September 2020.
According to the Business Impact of Coronavirus (COVID-19) Survey, 7% of businesses interviewed during the 19 October to 1 November 2020 period expected to make redundancies in the three months following the survey, a decrease from 9%, during the previous two weeks, 5 to 18 October 2020. The rate of expected redundancies was highest in the wholesale and retail sector (11%), and the administrative services, accommodation and food service activities, and transportation and storage sectors, all at 10%.
The Chartered Institute of Personnel and Development (CIPD) Labour Market Outlook for autumn 2020 (PDF, 882KB) reported that the proportion of firms that wanted to make redundancies was 30%, a decrease from 33% compared with the summer report (PDF, 940KB). Of the firms that wanted to make redundancies, 47% intended to make 10% or less of their workforces redundant in the following three months. However, the report highlighted some uncertainty as 17% of surveyed businesses could not give an opinion as to whether they would make redundancies in the following three months.
Back to table of contents6. Pay As You Earn Real Time Information
Experimental data on the number of payroll employees and median earnings, using HM Revenue and Customs' (HMRC's) Pay As You Earn (PAYE) Real Time Information (RTI), also show current labour market conditions.
Figure 4: After rising for several years, the number of employees has fallen in recent months
Payrolled employees, seasonally adjusted, UK, July 2014 to November 2020
Source: HM Revenue and Customs – Pay As You Earn Real Time Information
Notes:
- The latest period, highlighted in orange, is based on early data and therefore is more likely to be subject to slightly more significant revisions.
- The October 2020 figure is not a flash estimate of payrolled employees, this is included purely for graphing purposes.
Download this chart Figure 4: After rising for several years, the number of employees has fallen in recent months
Image .csv .xlsEarly estimates for November 2020 indicate that there were 28.2 million payrolled employees, a fall of 2.7% compared with the same period of the previous year and a decline of 781,000 people over the 12-month period. Compared with the previous month, the number of payrolled employees decreased by 0.1% in November 2020 – equivalent to 28,000 people.
Early estimates for November 2020 indicate that median monthly pay increased to £1,921, an increase of 4.6% compared with the same period of the previous year.
Back to table of contents7. Claimant Count (Experimental Statistics)
Figure 5: UK Claimant Count level has increased by 114.8% since March 2020
UK Claimant Count, seasonally adjusted, between January 2008 and November 2020
Source: Department for Work and Pensions
Download this chart Figure 5: UK Claimant Count level has increased by 114.8% since March 2020
Image .csv .xlsThe Claimant Count increased slightly in November 2020 to 2.7 million (Figure 5). This represents a monthly increase of 2.5% and an increase of 114.8%, or 1.4 million, since March 2020.
More detail on the Claimant Count can be found in the Employment in the UK bulletin.
These Claimant Count statistics relate to 12 November 2020. Enhancements to Universal Credit as part of the UK government's response to the coronavirus mean that an increasing number of people became eligible for unemployment-related benefit support, although still employed.
Consequently, changes in the Claimant Count will not be wholly because of changes in the number of people who are unemployed. We are not able to identify to what extent people who are employed or unemployed have affected the numbers.
8. Vacancies
Figure 6: Vacancies continued to recover in September to November 2020 with an estimated quarterly increase of 110,000 vacancies but the level is still 31.5% lower than a year ago
Number of vacancies in the UK, seasonally adjusted, between September to November 2001 and September to November 2020
Source: Office for National Statistics - Vacancy Survey
Download this chart Figure 6: Vacancies continued to recover in September to November 2020 with an estimated quarterly increase of 110,000 vacancies but the level is still 31.5% lower than a year ago
Image .csv .xlsFor September to November 2020, there were an estimated 547,000 vacancies, which is a quarterly increase of 110,000 vacancies and an increase of 203,000 vacancies from the record low in April to June 2020. The estimated vacancies for the smallest businesses, with one to nine employees, are closest to vacancy levels of a year ago at 5.9% lower, compared with 39.4% lower for larger businesses with 2,500 or more employees. Despite the increase, vacancies remain below the pre-coronavirus (COVID-19) pandemic levels and are 251,000 (31.5%) less than a year ago.
While the experimental single-month estimates should not be considered accurate estimates of vacancies in the reported months, they do indicate estimated vacancies for November 2020 are still around 30% less than a year ago.
The KPMG and REC UK Report on jobs for November (PDF, 668KB) shows a further drop in overall vacancies, mainly driven by a substantial fall in permanent jobs from October to November 2020. However, temporary billings showed a sustained rise for the fourth consecutive month. The report showed a decrease in starting salaries of temporary and permanent workers, which may have been initiated by the lack of labour demand and an increase in available candidates. The hotel and catering and retail sector saw the biggest fall in both permanent and temporary vacancies, whereas IT and computing and engineering sectors experienced high demand for permanent roles. High demand for temporary workers was experienced by blue-collar jobs.
Back to table of contents9. Earnings growth
Figure 7: The annual growth in both total pay (2.7%) and regular pay (2.8%) in August to October 2020 was above the rate of inflation
Great Britain average weekly earnings annual growth rates, seasonally adjusted, January to March 2001 to August to October 2020
Source: Office for National Statistics – Monthly Wages and Salaries Survey
Download this chart Figure 7: The annual growth in both total pay (2.7%) and regular pay (2.8%) in August to October 2020 was above the rate of inflation
Image .csv .xlsIn August to October 2020, the rate of annual pay growth was positive 2.7% for total pay and positive 2.8% for regular pay.
The rate of total and regular pay growth had stood at 2.9% in December 2019 to February 2020 immediately prior to any impact from the coronavirus (COVID-19) pandemic was seen; it then slowed sharply in April to June 2020 to negative 1.3% for total pay and negative 0.1% for regular pay before some increase between July and October.
In real terms, total pay is now growing at a faster rate than inflation, at positive 1.9%, and regular pay growth in real terms is also positive, at 2.1%.
Between August to October 2019 and August to October 2020, average pay growth varied by industry sector. The finance and business services sector saw the highest estimated growth in total pay, at 4.6%. Negative growth was seen in the construction sector, estimated at negative 2.2%. The wholesaling, retailing, hotels and restaurants sector, estimated at 1.6%, and manufacturing, estimated at 0.3%, were positive. This is an improvement on the growth rates in April to June 2020, the three-month period with the biggest falls, where these sectors had falls of 5.4% and 3.4% respectively.
The reported number of jobs being paid through payroll (which includes furloughed jobs) was lower than a year ago; the composition of these jobs has impacted average pay growth. A notable proportion of the growth in average pay is because of a fall in the number and proportion of lower-paid employee jobs; other factors such as a fall in employees entering the labour market have also inflated average pay growth.
The recent Office for Budget Responsibility (OBR) economic and fiscal output (PDF, 2.04MB) explains the continued growth in average earnings, compared with a sharp fall in gross domestic product (GDP), partly as a consequence of the Coronavirus Job Retention Scheme (CJRS) subsidising the pay of employees producing little or no output, meaning that earnings held up relative to nominal GDP in the near term. The OBR also expects earnings growth to pick up again in 2021 as the economy starts recovering, before moderating in 2022.
Back to table of contents10. Coronavirus and measuring the labour market
The data presented in this bulletin are collected from various sources. Each covers different reference periods or count dates and is therefore impacted differently by the coronavirus (COVID-19) social distancing and lockdown measures.
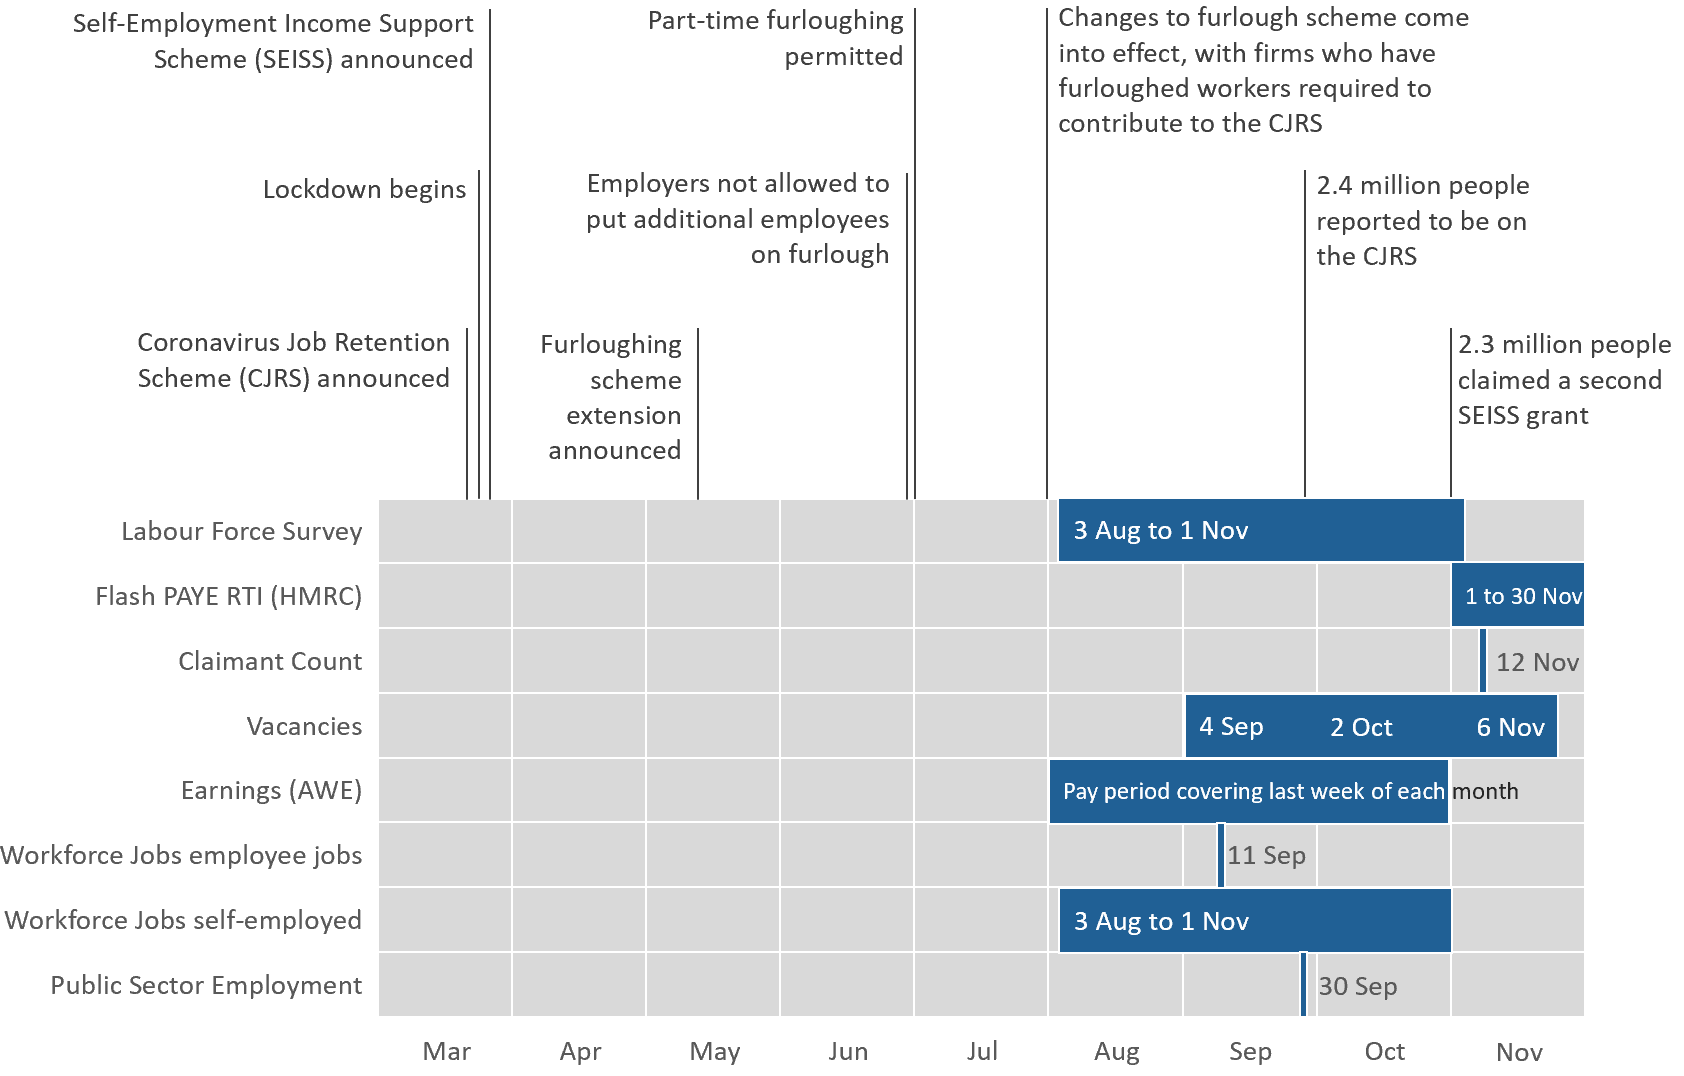
Figure 8 shows the data reported in this bulletin (dark bars) alongside their different reference periods and count dates (white text). The main coronavirus dates are included to show how much of the data presented were impacted by the implementation of coronavirus social distancing and lockdown measures.
Figure 8: Impact of the main coronavirus (COVID-19) dates on labour market data sources
Download this image Figure 8: Impact of the main coronavirus (COVID-19) dates on labour market data sources
.png (69.6 kB)
Coronavirus and Labour Force Survey estimates
Because of the coronavirus and the suspension of face-to-face interviewing on 17 March 2020, we had to make operational changes to the Labour Force Survey (LFS), particularly in the way that we contact households for initial interview, which moved to a "by telephone" approach. These changes resulted in a response where certain characteristics have not been as well represented as previously and is evidenced in a change in the balance of type of household that we are reaching. In particular, the proportion of households where people own their homes in the sample has increased and rented accommodation households has decreased.
To mitigate the impact of this non-response bias, in October 2020, we introduced housing tenure into the LFS weighting methodology for periods from January to March 2020 onwards. While not providing a perfect solution, this redressed some of the issues that had previously been noted in the survey results. More information can be found in Coronavirus and its impact on the Labour Force Survey and in this blog.
The change in weighting methodology resulted in revisions to all LFS estimates published on 13 October 2020 for the periods January to March 2020 through to May to July 2020 and consequently had an impact on recent movements for a number of the published series. More information about the impact of the change in weighting on main LFS indicators published in October 2020 can be found in dataset X08.
Back to table of contents11. Labour market data
Summary of labour market statistics
Dataset A01 | Released 15 December 2020
Estimates of employment, unemployment and other employment-related statistics for the UK.
Employment, unemployment and economic inactivity
Dataset A02 SA | Released 15 December 2020
Estimates of UK employment, unemployment and economic inactivity for people aged 16 years and over and people aged between 16 and 64 years based on the Labour Force Survey (LFS).
Average weekly earnings
Dataset EARN01 | Released 15 December 2020
Estimates of Great Britain earnings growth based on the Monthly Wages and Salaries Survey.
Vacancies by industry
Dataset VACS02 | Released 15 December 2020
Estimates of the number of UK job vacancies for each industry, based on a survey of businesses.
Real Time Information statistics
Dataset Real Time Information statistics | Released 15 December 2020
Earnings and employment statistics from Pay As You Earn (PAYE) Real Time Information (RTI) (Experimental Statistics) seasonally adjusted.
Claimant Count
Dataset CLA01 | Released 15 December 2020
Experimental estimates of the Claimant Count including Jobseeker's Allowance and out of work Universal Credit claimants.
Labour Force Survey weekly estimates
Dataset X07 | Released 15 December 2020
LFS weekly estimates of employment, unemployment, economic inactivity and hours in the UK. All estimates are calculated from highly experimental weekly LFS datasets.
Labour Force Survey single month estimates
Dataset X01 | Released 15 December 2020
Labour Force Survey (LFS) experimental single-month estimates of employment, unemployment and economic inactivity
View all related data on the related data page. Alternatively, Nomis provides free access to the most detailed and up-to-date UK labour market statistics from official sources.
12. Glossary
Average weekly earnings
Average weekly earnings measures money paid by employers to employees in Great Britain before tax and other deductions from pay. The estimates are not just a measure of pay rises as they also reflect, for example, changes in the overall structure of the workforce. More high-paid jobs in the economy would have an upward effect on the earnings growth rate.
Economic inactivity
People not in the labour force (also known as economically inactive) are not in employment but do not meet the internationally accepted definition of unemployment because they have not been seeking work within the last four weeks and/or they are unable to start work in the next two weeks. The economic inactivity rate is the proportion of people aged between 16 and 64 years who are not in the labour force.
Employment
Employment measures the number of people in paid work or who had a job that they were temporarily away from (for example, because they were on holiday or off sick). This differs from the number of jobs because some people have more than one job. The employment rate is the proportion of people aged between 16 and 64 years who are in employment. A more detailed explanation is available in A guide to labour market statistics.
Unemployment
Unemployment measures people without a job who have been actively seeking work within the last four weeks and are available to start work within the next two weeks. The unemployment rate is not the proportion of the total population who are unemployed. It is the proportion of the economically active population (those in work plus those seeking and available to work) who are unemployed.
Vacancies
Vacancies are defined as positions for which employers are actively seeking recruits from outside their business or organisation. The estimates are based on the Vacancy Survey; this is a survey of businesses designed to provide estimates of the stock of vacancies across the economy, excluding agriculture, forestry and fishing (a small sector for which the collection of estimates would not be practical).
Claimant Count
The Claimant Count seeks to measure the number of people claiming benefit principally for the reason of being unemployed.
The Claimant Count has generally been a count of the appropriate benefits within the UK's current benefit regime that best meet that criteria, and therefore sensitive to any changes in the benefit regime. Currently, this is a combination of claimants of Jobseeker's Allowance (JSA) and claimants of Universal Credit (UC) who fall within the UC "searching for work" conditionality.
Those claiming unemployment-related benefits (either JSA or in the UC searching for work conditionality group) may be:
- wholly unemployed and searching for work
- employed but with low income and/or low hours, that make them eligible for unemployment-related benefit support
- under certain circumstances, not required to seek work and therefore economically inactive
UC, which has been rolled out to replace the previous income-based element of JSA, along with a range of other income-based benefits, is designed to be a broader benefit, covering more people with underlying eligibility than those who claimed JSA. As a household benefit, the holistic situation of all members of the household are considered, and their obligations to look for work considered. Therefore, the roll-out itself has caused notable changes to the level of the Claimant Count, significantly closing the previously existing gap between the count and unemployment levels. Consequently, the measure is currently an Experimental Statistic, as movements are not wholly caused by changes in the labour market.
Pay As You Earn (PAYE) Real Time Information (RTI)
These data come from HM Revenue and Customs' (HMRC's) Pay As You Earn (PAYE) Real Time Information (RTI) system. They cover the whole population rather than a sample of people or companies, and they will allow for more detailed estimates of the population. The release is classed as Experimental Statistics as the methodologies used to produce the statistics are still in their development phase. As a result, the series are subject to revisions.
PAYE is the system employers and pension providers use to take Income Tax and National Insurance contributions before they pay wages or pensions to employees and pensioners. This publication relates to employees only and not pensioners.
A more detailed glossary is available.
Back to table of contents13. Measuring the data
The employment, unemployment and economic inactivity estimates rely on data collected from the Labour Force Survey (LFS), a survey run by field interviewers with people across the UK every month.
The LFS performance and quality monitoring reports provide data on response rates and other quality-related issues for the LFS, including breakdowns of response by LFS wave, region and question-specific response issues. The average weekly earnings and vacancies estimates rely on data collected from surveys of employers.
More quality and methodology information on strengths, limitations, appropriate uses, and how the data were created is available in the following QMI reports:
Coronavirus
For more information on how labour market data sources are affected by the coronavirus (COVID-19) pandemic, see the article published on 6 May 2020, which details some of the challenges that we have faced in producing estimates at this time.
An article published 11 December 2020 compares our labour market data sources and discusses some of the main differences.
Our latest data and analysis on the impact of the coronavirus on the UK economy and population are available on our dedicated coronavirus web page. This is the hub for all special coronavirus-related publications, drawing on all available data. In response to the developing coronavirus pandemic, we are working to ensure that we continue to publish economic statistics. For more information, please see COVID-19 and the production of statistics.
End of EU exit transition period
After the transition period ends on 31 December 2020, the UK statistical system will continue to collect and produce our wide range of economic and social statistics. We are committed to continued alignment with international statistical standards, enabling comparability both over time and internationally and we will work with users of statistics to make sure they have the data they need to support the decisions they have to make.
As the shape of the UK's future statistical relationship with the EU becomes clearer over the coming period, the ONS is making preparations to assume responsibilities that as part of our membership of the EU, and during the transition period, were delegated to the statistical office of the EU, Eurostat. This includes responsibilities relating to international comparability of economic statistics, deciding what international statistical guidance to apply in the UK context and to provide further scrutiny of our statistics and sector classification decisions.
In applying international statistical standards and best practice to UK economic statistics, we will draw on the technical advice of experts in the UK and internationally, and our work will be underpinned by the UK's well-established and robust framework for independent official statistics, set out in the Statistics and Registration Service Act 2007. Further information on our proposals will be made available in early 2021.
We will continue to produce our labour market statistics in line with the UK Statistics Authority's Code of Practice for Statistics and in accordance with International Labour Organization (ILO) definitions and agreed international statistical guidance.
Pre-release data
The Bank of England were granted exceptional pre-release access to the Labour market overview, UK: December 2020 bulletin, HM Revenue and Customs' (HMRC's) Pay As You Earn (PAYE) Real Time Information (RTI) data and accompanying tables at 8:30am on Monday 14 December 2020 so that the data were available for the Monetary Policy Committee (MPC) meeting held on that day. See exchange of letters requesting exceptional pre-release access so that data are available for discussion at the MPC meeting.
Future publication dates
26 January 2021
23 February 2021
23 March 2021
20 April 2021
18 May 2021
15 June 2021
Sampling variability
| Level | Sampling variability of level¹ | Change on quarter | Sampling variability of change on quarter¹ | Change on year | Sampling variability of change on year¹ | |
|---|---|---|---|---|---|---|
| Employment (000s, aged 16+ ) | 32,522 | ± 205 | -144 | ± 174 | -280 | ± 259 |
| Employment rate (aged 16 to 64) | 75.2 | ± 0.5 | -0.5 | ± 0.4 | -0.9 | ± 0.6 |
| Average weekly hours | 29.5 | ± 0.2 | 3.3 | ± 0.2 | -2.7 | ± 0.3 |
| Unemployment (000s, aged 16+) | 1,692 | ± 97 | 241 | ± 99 | 411 | ± 118 |
| Unemployment rate (aged 16+) | 4.9 | ± 0.3 | 0.7 | ± 0.3 | 1.2 | ± 0.3 |
| Economically active (000s, aged 16+) | 34,213 | ± 193 | 97 | ± 168 | 131 | ± 246 |
| Economic activity rate (aged 16 to 64) | 79.2 | ± 0.4 | 0.0 | ± 0.4 | 0.1 | ± 0.5 |
| Economically inactive (000s, aged 16 to 64) | 8,602 | ± 179 | -2 | ± 155 | -4 | ± 226 |
| Economic inactivity rate (aged 16 to 64) | 20.8 | ± 0.4 | 0.0 | ± 0.4 | -0.1 | ± 0.5 |
| Redundancies (000s, aged 16+) | 370 | ± 41 | 217 | ± 48 | 251 | ± 46 |
Download this table Table 1: Labour Force Survey sampling variability
.xls .csv
| Annual growth rate (estimate) | Sampling variability of growth rate (1) | |
|---|---|---|
| Total pay (nominal) | 2.7 | ± 0.5 |
| Total pay (real) | 1.9 | |
| Regular pay (nominal) | 2.8 | ± 0.5 |
| Regular pay (real) | 2.1 |
Download this table Table 2: Summary of employee earnings, Great Britain, August to October, seasonally adjusted
.xls .csv14. Strengths and limitations
Some of the figures in this bulletin come from surveys, which gather information from a sample rather than from the whole population. The sample is designed to be as accurate as possible given practical limitations such as time and cost constraints. Therefore, the estimates presented in this bulletin contain some uncertainty and are not precise figures. This can have an impact on how changes in the estimates should be interpreted, especially for short-term comparisons.
As the number of people available in the sample gets smaller, the variability of the estimates that we can make from that sample size gets larger. Estimates for small groups (for example, unemployed people aged between 16 and 17 years), which are based on small subsets of the Labour Force Survey (LFS) sample, are less reliable and tend to be more volatile than for larger aggregated groups (for example, the total number of unemployed people).
In general, changes in the numbers (and especially the rates) reported in this bulletin between three-month periods are small and are not usually greater than the level that can be explained by sampling variability. Short term movements in reported rates should be considered alongside longer-term patterns in the series and corresponding movements in other sources to give a fuller picture.
Further information is available in A guide to labour market statistics.
Where to find data about uncertainty and reliability
Dataset A11 shows sampling variabilities for estimates derived from the LFS.
Sampling variability information for average weekly earnings growth rates is available from the "Sampling Variability" worksheets within Datasets EARN01 and EARN03. The sampling variability of the three-month average vacancies level is around plus or minus 1.5% of that level. Information on revisions is available in the Labour market statistics revisions policy.
Back to table of contents