Table of contents
- Other pages in this release
- Main points
- Coronavirus and measuring the labour market
- Employment, unemployment and economic inactivity
- Labour market flows
- Hours worked
- Redundancies
- Pay As You Earn Real Time Information
- Claimant Count (Experimental Statistics)
- Vacancies
- Earnings growth
- Economic commentary
- Labour market data
- Glossary
- Measuring the data
- Strengths and limitations
- Related links
1. Other pages in this release
- Employment in the UK
- Average weekly earnings in Great Britain
- Vacancies, jobs and public sector employment in the UK
- Earnings and employment from Pay As You Earn Real Time Information, UK
- Single-month and weekly Labour Force Survey estimates
2. Main points
Early indicators for July 2020 suggest that the number of employees in the UK on payrolls is down around 730,000 compared with March 2020. Flows analysis suggests that the falls in May, June and July are mainly because of fewer people moving into payrolled employment.
Survey data show employment is weakening and unemployment is largely unchanged because of increases in economic inactivity, with people out of work but not currently looking for work.
The decrease in employment on the quarter was the largest quarterly decrease since May to July 2009 with both men and women seeing decreases on the quarter. The quarterly decrease in employment was also driven by workers aged 65 years and over, the self-employed and part-time workers. Meanwhile full-time employees largely offset the decrease.
Hours worked has continued to fall reaching record lows both on the year and on the quarter.
A large number of people are estimated to be temporarily away from work, including furloughed workers; approximately 7.5 million in June 2020 with over 3 million of these being away for three months or more. New analysis shows that the youngest workers, oldest workers and those in manual or elementary occupations were those most likely to be temporarily away from paid work during the coronavirus (COVID-19) pandemic. There were also around 300,000 people away from work because of the pandemic and receiving no pay in June 2020.
Vacancies are showing increases in the latest period, driven by the smaller businesses, some of which are reporting taking on additional staff to meet COVID-19 guidelines.
The Claimant Count reached 2.7 million in July 2020, an increase of 116.8% since March 2020.
Pay fell for all measures in the three months to June 2020. However, for the sectors of wholesaling, retailing, hotels and restaurants and construction where the highest percentage of employees returned to work from furlough, there is a slight improvement in pay growth for June 2020.
April to June figures show weakening employment rates, with numbers of self-employed and part-time workers seeing reductions; despite these falls, unemployment was not rising, because of increases in people out of work but not currently looking for work; the reduction in total hours worked is a record both on the year and on the quarter, with the whole period covering a time since the introduction of coronavirus measures.
Early estimates for July 2020 from Pay As You Earn (PAYE) Real Time Information (RTI) indicate that the number of payroll employees fell by 2.5% (730,000) compared with March 2020.
The Claimant Count increased in July 2020, reaching 2.7 million; this includes both those working with low income or hours and those who are not working.
Vacancies in the UK in May to July 2020 were at an estimated 370,000; this is 10% higher than the record low in April to June 2020.
The three months to June 2020 saw strong falls in pay; total nominal pay fell by 1.2% on the year and regular nominal pay fell by 0.2% (the first negative pay growth in regular nominal earnings since records began in 2001).
The majority of data in this bulletin come from surveys of households and businesses. It is not possible to survey every household and business each month, so these statistics are estimates based on samples.
4. Employment, unemployment and economic inactivity
Figure 2: Employment is weakening and unemployment is largely unchanged, but there are some signs of economic inactivity rising with people out of work not currently looking for work compared with the previous quarter
UK employment, unemployment and economic inactivity rates, seasonally adjusted, between April to June 2010 and April to June 2020
Embed code
Download this chart
Employment
Employment measures the number of people aged 16 years and over in paid work and those who had a job that they were temporarily away from (which they are expecting to return to). The employment rate is the proportion of people aged between 16 and 64 years who are in employment.
Estimates for April to June 2020 show 32.92 million people aged 16 years and over in employment, 113,000 more than a year earlier but 220,000 fewer than the previous quarter.
For April to June 2020:
- the estimated employment rate for all people was 76.4%; this is 0.3 percentage points up on the year but 0.2 percentage points down on the quarter
- the estimated employment rate for men was 80.2%; this is largely unchanged on the year and 0.3 percentage points down on the quarter
- the estimated employment rate for women was 72.8%; this is 0.7 percentage points up on the year and 0.1 percentage points down on the quarter
Looking more closely at the decreases in employment over the quarter by age, those aged 16 to 24 years decreased by 100,000 to 3.72 million, while those aged 65 years and over decreased by a record 161,000 to 1.26 million. This was partially offset by those aged 25 to 64 years, who increased by 41,000 on the quarter to 27.94 million.
Figure 3: Record quarterly decrease for self-employed workers
UK employment percentage growth for employees and self-employed people (aged 16 years and over), seasonally adjusted, April to June 2020 compared with April to June 2015
Source: Office for National Statistics – Labour Force Survey
Download this chart Figure 3: Record quarterly decrease for self-employed workers
Image .csv .xlsLooking at the estimates for April to June 2020 by type of employment (Figure 3), the number of self-employed has shown a sharp fall, which is not reflected in employees. In particular, there were 28.02 million employees (85.1% of all people in employment), 52,000 more than the previous quarter, and 4.76 million self-employed people (14.5% of all people in employment), a record 238,000 fewer than the previous quarter.
These estimates for paid employees and self-employed people make up over 99% of all people in employment in the UK. The total employment figure also includes two other minor categories, as explained in A guide to labour market statistics.
Further information on employment by employee, self-employed, and full and part time can be found in the Employment in the UK bulletin.
Analysis of changes in employment over the past year by National Statistics Socio-economic Classification (NS-SEC) shows higher managerial and professional, lower managerial and professional, and intermediate occupations have increased steadily. Meanwhile, small employers, own account workers, lower supervisory occupations, technical occupations, semi-routine occupations and routine occupations decreased. The largest decrease was in routine occupations, down 325,000 (or 11.3%) on the year and 195,000 (or 7.1%) on the quarter, indicating these occupations have been most affected by the coronavirus (COVID-19) lockdown measures introduced in March 2020.
Estimates of the number of people in employment on the Labour Force Survey (LFS) are consistent with the International Labour Organization (ILO) definition of employment. Under this definition, employment includes both those who are in work during the reference period and those who are temporarily away from a job. Experimental estimates based on returns for individual weeks show that approximately 7.5 million people were temporarily away from paid work in June 2020, with over 3 million of these being away for three months or more. Of those away for three months or more, at the end of June 2020 over three-quarters were earning half or more of their salary.
Further details of the experimental weekly figures can be found in the Single-month and weekly LFS articles.
Figure 4: There were approximately 7.5 million people temporarily away from paid work in June 2020
Total number of people temporarily away from paid work, seasonally adjusted, UK, January to June 2017 to January to June 2020
Source: Office for National Statistics – Labour Force Survey
Download this chart Figure 4: There were approximately 7.5 million people temporarily away from paid work in June 2020
Image .csv .xls
Figure 5: Number of people on zero-hours contracts has increased to over 1 million
People in employment on zero-hours contracts, UK, not seasonally adjusted, October to December 2000 and April to June 2020
Source: Office for National Statistics – Labour Force Survey
Download this chart Figure 5: Number of people on zero-hours contracts has increased to over 1 million
Image .csv .xlsThe number of people on zero-hours contracts has also been increasing steadily (Figure 5). Since April to June 2019, it has increased by 156,000 (or 17.4%) to a record high of 1.05 million.
Unemployment
Unemployment measures people without a job who have been actively seeking work within the last four weeks and are available to start work within the next two weeks. The unemployment rate is not the proportion of the total population who are unemployed. It is the proportion of the economically active population (those in work plus those seeking and available to work) who are unemployed.
Estimates for April to June 2020 show an estimated 1.34 million people were unemployed, 9,000 more than a year earlier but 10,000 fewer than the previous quarter.
For April to June 2020:
- the estimated UK unemployment rate for all people was 3.9%; this is largely unchanged on both the year and the quarter
- the estimated UK unemployment rate for men was 4.1%; this is largely unchanged on the year earlier but 0.1 percentage points down on the quarter
- the estimated UK unemployment rate for women was 3.7%; this is 0.1 percentage points higher than a year earlier and 0.1 percentage points higher on the quarter
Despite the lack of overall increase in the number of unemployed people, the estimated number of people unemployed aged 16 to 24 years increased by 41,000 on the year, to 543,000. Other age groups saw falls or very little change over the year.
Looking at the duration of unemployment, it is those unemployed for up to six months who are seeing the largest increases, up 150,000 over the year to 943,000. The decrease in longer-term unemployment means that overall, the unemployment remains unchanged.
Figure 6: The number of people who are not unemployed but could potentially be seeking employment has increased over the quarter
Economically inactive who may seek employment and those away from work because of the pandemic and not getting paid (aged 16 years and over), not seasonally adjusted, UK, January to March 2020 and April to June 2020
Source: Office for National Statistics – Labour Force Survey
Download this chart Figure 6: The number of people who are not unemployed but could potentially be seeking employment has increased over the quarter
Image .csv .xlsThe relative flatness of the unemployment figures may seem surprising. However, to be unemployed someone has to say that they do not have a job and that they are currently actively seeking and available for work.
Last month, we reported on a group of employees who, because of the impact of the coronavirus, have reported that they are temporarily away from work and not getting paid; in June 2020, this is estimated to account for approximately 300,000. Similarly, there are a group of self-employed people who are temporarily away from work but not eligible for the Self-Employment Income Support Scheme (SEISS). This month, we have published an article giving further information on people who are temporarily away from paid work. Although these people consider themselves to have a job and therefore are consistent with the ILO definition of employment, the lack of income means that they may soon need to look for work unless they are able to return to their job.
It is also possible to identify certain groups who are economically inactive as they are not currently looking for work but may look for work in the future. These are primarily those who want a job but are not yet looking; however, it also includes those who report they do not want a job but either do not believe jobs are available, are not yet looking, or are inactive for some other unspecified reason. The number of people in these categories has increased by 383,000 on the quarter.
Between January to March 2020 and April to June 2020, the number in these groups – the inactive who may begin to seek work and who are temporarily away from work for coronavirus-related reasons, without earnings – increased by 1.03 million to 2.13 million (Figure 6). This increase of people who are around the fringes of unemployment may explain why unemployment under the ILO definition has not increased.
Economic inactivity
Economic inactivity measures people without a job but who are not classed as unemployed because they have not been actively seeking work within the last four weeks and/or they are unable to start work within the next two weeks. Our headline measure of economic inactivity is for those aged between 16 and 64 years.
Estimates for April to June 2020 show 8.44 million people aged between 16 and 64 years not in the labour force (economically inactive), 127,000 fewer than a year earlier and 82,000 more than the previous quarter.
For April to June 2020:
- the estimated economic inactivity rate for all people was 20.4%; this is down by 0.4 percentage points on the year but up by 0.2 percentage points on the quarter
- the estimated economic inactivity rate for men was 16.4%; this is largely unchanged on the year and up 0.3 percentage points on the quarter
- the estimated economic inactivity rate for women was 24.3%; this is down by 0.7 percentage points on the year but up by 0.1 percentage points on the quarter
Those who are economically inactive and who want a job increased by 235,000 on the year and 218,000 on the quarter, while those who do not want a job decreased by 362,000 on the year and 135,000 on the quarter. This suggests that people who want employment are not currently looking for work, and it is a further explanation of why we are not seeing a large rise in unemployment.
Back to table of contents5. Labour market flows
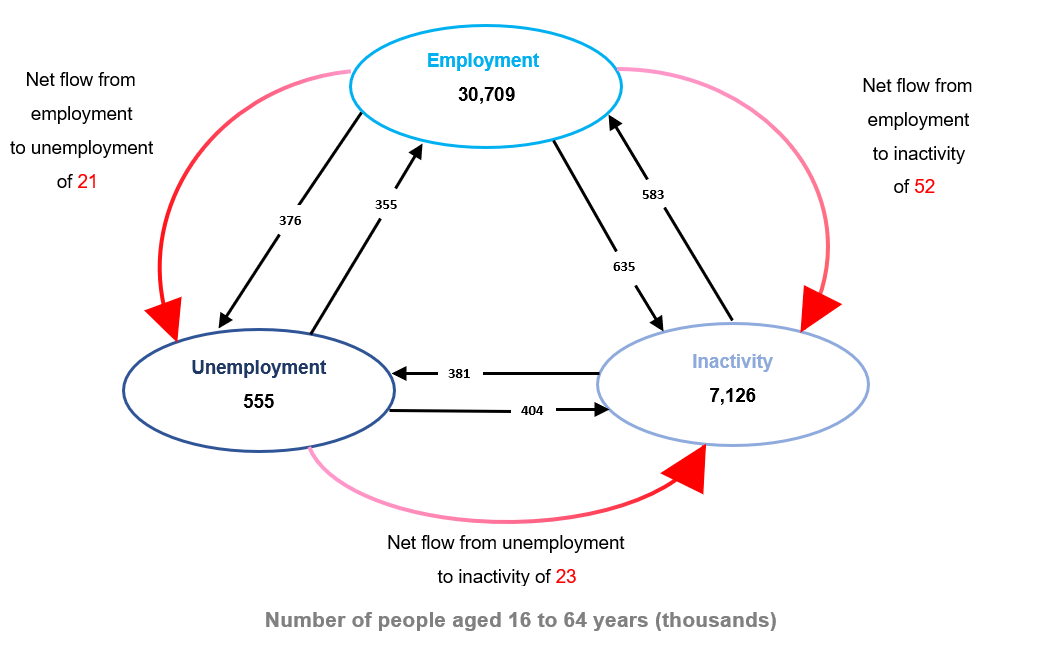
Figure 7: There was a net flow of 75,000 into economic inactivity between January to March 2020 and April to June 2020
Flows between employment, unemployment and economic inactivity, seasonally adjusted, UK, between January to March 2020 and April to June 2020
Source: Office for National Statistics – Labour Force Survey
Download this image Figure 7: There was a net flow of 75,000 into economic inactivity between January to March 2020 and April to June 2020
.png (68.8 kB)
Looking at estimates of flows between employment, unemployment and economic inactivity between January to March 2020 and April to June 2020, there was a net flow of:
- 52,000 from employment to economic inactivity, the largest since October to December 2016
- 23,000 from unemployment to economic inactivity, the first net flow from unemployment into economic inactivity on record
- 21,000 from employment to unemployment, the first net flow from employment into unemployment since April to June 2009
The net flow into economic inactivity was 75,000, the first net increase into economic inactivity since January to March 2013, driven by those moving from unemployment to economic inactivity.
Back to table of contents6. Hours worked
Figure 8: Largest quarterly decrease in total actual weekly hours since records began in 1971
UK total actual weekly hours worked (people aged 16 years and over), seasonally adjusted, between March to May 1992 and April to June 2020
Source: Office for National Statistics – Labour Force Survey
Download this chart Figure 8: Largest quarterly decrease in total actual weekly hours since records began in 1971
Image .csv .xlsBetween January to March 2020 and April to June 2020, total actual weekly hours worked in the UK decreased by a record 191.3 million, or 18.4%, to 849.3 million hours. This was the largest quarterly decrease since estimates began in 1971, with total hours dropping to its lowest level since September to November 1994. Average actual weekly hours fell by a record 5.6 hours on the quarter to a record low of 25.8 hours.
Over the year, total actual weekly hours worked in the UK decreased by 203.3 million, to 849.3 million hours in the three months to June 2020. This was the largest annual decrease since estimates began in 1971, with total hours dropping to its lowest level since September to November 1994. Over the same period, average actual weekly hours fell by 6.3 hours to a record low of 25.8 hours. The accommodation and food service activities industrial sector saw the biggest annual fall in average actual weekly hours, down 15.4 hours to a record low of 13.0 hours per week.
Back to table of contents7. Redundancies
Figure 9: Redundancies increased by 27,000 on the quarter
UK redundancies, seasonally adjusted, between April to June 2005 and April to June 2020
Source: Office for National Statistics – Labour Force Survey
Download this chart Figure 9: Redundancies increased by 27,000 on the quarter
Image .csv .xlsRedundancies increased by 30,000 on the year and 27,000 on the quarter to 134,000. While this is the highest level since February to April 2013, the level remains well below that seen during the 2008 downturn.
The redundancies estimates measure the number of people who were made redundant or who took voluntary redundancy in the three months before the Labour Force Survey interviews.
Back to table of contents8. Pay As You Earn Real Time Information
Another source that shows current labour market conditions is experimental data on the number of payroll employees and median earnings using HM Revenue and Customs’ (HMRC’s) Pay As You Earn (PAYE) Real Time Information (RTI).
Figure 10: After rising for several years, the number of employees on payroll has fallen in recent months
Paid employees, seasonally adjusted, UK, July 2014 to July 2020
Source: HM Revenue and Customs – Pay As You Earn Real Time Information
Download this chart Figure 10: After rising for several years, the number of employees on payroll has fallen in recent months
Image .csv .xlsThe latest figures show a fall in payroll employees in recent months. Early estimates for July 2020 from PAYE RTI indicate that the number of payroll employees fell by 2.5% compared with March 2020. In July, 730,000 fewer people were in paid employment when compared with March 2020 and 114,000 fewer when compared with June 2020.
Figure 11: Both inflows to and outflows from payroll employment have been below their pre-coronavirus levels in recent months
Month-on-month change in paid employment and contributions to this change from inflows (positive) and outflows (negative), seasonally adjusted, UK, January 2017 to July 2020
Source: HM Revenue and Customs – Pay As You Earn Real Time Information
Notes:
The latest period, is based on early data and therefore could be subject to revisions.
Testing of this experimental data indicates a tendency for both inflows and outflows to be revised downwards. For this reason, additional caution should be used when interpreting these statistics. The scale of these revisions should not affect the broad analysis presented in the bulletin text.
Download this chart Figure 11: Both inflows to and outflows from payroll employment have been below their pre-coronavirus levels in recent months
Image .csv .xlsDeclines in the number of paid employees in recent months can be explained by examining inflows and outflows from payroll employment, included in the Earnings and employment from PAYE RTI bulletin (see Figure 11). For most of the periods prior to the coronavirus (COVID-19) pandemic, outflows and inflows were broadly equal – with inflows being slightly higher, resulting in a net increase in paid employment.
In recent periods, the changes in inflows and outflows driving the fall in payroll employees have differed. The fall in paid employment in April 2020 was because of, in (broadly) equal part, an increase in outflows and a fall in inflows compared with their pre-coronavirus trends. However, from May onwards, outflows have fallen and remained below their pre-coronavirus level while inflows have remained below pre-coronavirus levels since April 2020. As a result, the fall in paid employment in the latest three months can be explained primarily through lower than usual inflows, rather than higher than usual outflows.
Early estimates for July 2020 indicate that median monthly pay increased to £1,864, an increase of 2.5% when compared with the same period of the previous year.
Back to table of contents9. Claimant Count (Experimental Statistics)
These Claimant Count Experimental Statistics relate to 9 July 2020. Enhancements to Universal Credit as part of the UK government’s response to the coronavirus (COVID-19) mean that an increasing number of people became eligible for unemployment-related benefit support although still being in work. Consequently, changes in the Claimant Count will not be wholly because of changes in the number of people who are not in work. We are not able to identify to what extent people who are employed or unemployed have affected the numbers.
More detail on the Claimant Count can be found in the Employment in the UK bulletin.
Figure 12: UK Claimant Count level increased by 116.8% since March 2020
UK Claimant Count, seasonally adjusted, January 2008 to July 2020
Source: Department for Work and Pensions
Download this chart Figure 12: UK Claimant Count level increased by 116.8% since March 2020
Image .csv .xlsBetween June 2020 and July 2020, the Claimant Count increased by 94,400 (3.6%) to 2.7 million (Figure 12). Since March 2020, the Claimant Count has increased by 116.8%, or 1.4 million.
Back to table of contents10. Vacancies
Figure 13: May to July 2020 saw a 10% increase in the level of vacancies since the record low in April to June 2020
Number of vacancies in the UK, seasonally adjusted, between May to July 2001 and May to July 2020
Source: Office for National Statistics – Vacancy Survey
Download this chart Figure 13: May to July 2020 saw a 10% increase in the level of vacancies since the record low in April to June 2020
Image .csv .xlsFor May to July 2020, there were an estimated 370,000 vacancies in the UK, which is 10% higher than the record low in April to June 2020. The increase was driven by small businesses (less than 50 employees), some of which reported taking on staff to meet coronavirus (COVID-19) guidelines. Estimated vacancies for May to July 2020 were 274,000 fewer than in the previous quarter, February to April 2020 (where the responses for the first two months are prior to the start of coronavirus social distancing measures), and 453,000 fewer than a year earlier.
While the experimental single-month estimates should not be considered accurate estimates of vacancies in the reported months, they do indicate for July 2020 an increase of approximately 30% in the estimated vacancies compared with April 2020, with the accommodation and food service activities sector showing the strongest recovery.
Back to table of contents11. Earnings growth
Figure 14: Annual growth in employee total pay (including bonuses) is estimated to be negative 1.2%; this translates to a fall of 2.0% in real terms
Great Britain average weekly earnings annual growth rates, seasonally adjusted, between January to March 2001 and April to June 2020
Source: Office for National Statistics – Monthly Wages and Salaries Survey
Download this chart Figure 14: Annual growth in employee total pay (including bonuses) is estimated to be negative 1.2%; this translates to a fall of 2.0% in real terms
Image .csv .xlsThe rate of earnings growth has been slowing since April to June 2019, when it stood at 4.0% for total pay and 3.9% for regular pay, the highest nominal pay growth rates since 2008. Total pay had slowed to 2.9% in December 2019 to February 2020 immediately prior to the coronavirus (COVID-19) pandemic. Since then, it has slowed sharply to negative 1.2% in the three months to June 2020. Nominal regular pay growth for April to June 2020 was negative for the first time since records began in 2001, at negative 0.2%.
Pay is now growing at a slower rate than inflation, at negative 2.0% for total real pay, the lowest rate since January to March 2012. Regular pay growth in real terms was also negative, at negative 1.0%. The difference between the two measures is because of subdued bonuses, which fell by an average of negative 19.4% (in nominal terms) in the three months from April to June 2020. Between April to June 2019 and April to June 2020, average pay growth varied by industry sector. The public sector saw the highest estimated growth, at 4.1% for regular pay, while negative growth was seen in the construction sector (estimated at negative 8.7%), the wholesaling, retailing, hotels and restaurants sector (estimated at negative 3.9%), and the manufacturing sector (estimated at negative 2.5%).
For the sectors of wholesaling, retailing, hotels and restaurants, and construction where the highest percentage of employees returned to work from furlough, there was a slight improvement in pay growth for the single month of June 2020 compared with April to June 2020, but growth remained negative.
The Pay As You Earn (PAYE) Real Time Information (RTI) publication estimates growth in median pay at 1.1% in June 2020, which is higher than the estimate of change in mean earnings in this Average Weekly Earnings series. The lower percentage figure for mean pay growth was driven by more downward pressure on pay among both higher- and lower-paid employees, with less impact on those in the middle. Reduced pay for furloughed staff is more likely to impact lower-paid employees, and reduced bonuses have the most impact among the highest paid.
Back to table of contents12. Economic commentary
April to June 2020 saw the largest quarterly decrease in the total number of people in employment since May to July 2009 (mainly because of a drop in self-employment), although the employment rate remained high. The unemployment rate has remained unchanged on the quarter while the level of economic inactivity increased.
Despite the quarterly decrease in the level of employment, the number of employees increased in the three months to June 2020. In fact, the period experienced a record increase in the number of full-time employees. This can partly be attributed to 253,000 job-to-job flows from self-employment into employee status. The number of paid employees, as reported by HM Revenue and Customs’ (HMRC’s) Pay As You Earn (PAYE) Real Time Information (RTI) data, fell by 730,000 between March and July 2020. The Office for National Statistics (ONS) explains the discrepancy between these two figures as a group of employees who report in the Labour Force Survey (LFS) that they are in employment and temporarily away from work because of the pandemic but are not being paid. Another factor is the changing of reported status of people in the survey. Such people are not counted in the PAYE RTI figure as they are not recorded on the company’s payroll. This was true for over around 300,000 people in June 2020. Women and the youngest and oldest workers were more likely to be temporarily away from paid work.
Several external reports have also cited the Claimant Count as high and rising because of deteriorating economic conditions and a surge in out-of-work benefit claims. The Resolution Foundation suggested that the difference between the Claimant Count and headline LFS measure of unemployment is partly a result of the easing of the usual work-search conditions and definitional changes, and they attribute 27% (400,000) of the rise in Claimant Count between March and May to the number of Self-Employment Income Support Scheme (SEISS) recipients who are still working, furloughed workers or self-employed.
The employment rate remains high by historical standards, also because of the government’s job retention schemes. The Business Impact of Coronavirus (COVID-19) Survey (BICS) results for the period 15 to 28 June 2020 showed that of firms continuing to trade, 17% of the workforce had been furloughed under the Coronavirus Job Retention Scheme (CJRS), rising to 86% of those who had temporarily closed or paused trading. The impact of this shows in the reduction of the number of hours worked rather than employment. Average actual weekly hours worked continued to decline to reach a record low of 25.8 hours in the three months to June 2020.
The CJRS dampened earnings growth as furloughed workers receive 80% of their pay unless topped up by their employers. The BICS for the period 29 June to 12 July 2020 showed 56.1% of businesses that had a proportion of their workforce furloughed in the last two weeks of June did not top up the CJRS payments. This was most common in the water supply, sewerage, waste management and remediation, and accommodation and food industries.
Workers are increasingly returning from furlough as businesses continue to open. The BICS showed, of businesses continuing to trade, 7% of the workforce had returned from furlough between 29 June and 12 July 2020. The Bank of England reported a deterioration in the employment outlook with the rate of redundancies having increased in June and July. The heaviest job losses were reported by airline carriers, holiday operators, non-food retailers, automotive manufacturers, and firms along aerospace supply chains.
The LFS shows that redundancies picked up slightly in the three months to June 2020, increasing by 27,000 (25.1%) compared with the three months to March 2020. Unemployment has remained unchanged (at 3.9%). Labour market flows analysis shows that more people left employment for economic inactivity than for unemployment. This resulted in a rise in economic inactivity, driven by the number of people who cited the reason for economic inactivity as believing that no other jobs were available. The growth of economic inactivity was also driven by movement out of medium- and long-term unemployment. The current economic uncertainty owing to the coronavirus pandemic and a historically low level of vacancies may have deterred those unemployed for over six months from continuing to look for work. The latest Vacancy Survey shows that the number of vacancies for May to July 2020 are around 10% higher than the record low in the period April to June 2020. This was driven by growth in vacancies offered by small businesses of 45% compared with record low levels in April to June 2020. The Bank of England report that variation in vacancies numbers are dispersed across sectors; this could possibly lead to a greater level of mismatch. The Bank of England also expects that the unemployment rate will rise to 7.5% in Quarter 4 (Oct to Dec) 2020. The arts, entertainment and recreation industry saw the largest quarterly percentage decline in vacancies, while the public admin and defence sector recorded the smallest. In the monthly vacancy series, the vacancy levels in the arts, entertainment and recreation industry were similar for July compared with April, which suggests that the industry had not yet started to recover.
The inaugural estimates of experimental Adzuna online job adverts by UK country and NUTS1 regions show that on 31 July 2020, online job adverts were closest to their 2019 average in London and Northern Ireland. Compared with their 2019 averages, the online job adverts were lowest in Yorkshire and The Humber and the East of England. The recovery from the lockdown minimum to the latest value was strongest in Northern Ireland and London and weakest in Yorkshire and The Humber and the East of England.
The government announced on 8 July 2020 that some Value Added Tax (VAT) registered businesses were able to apply for a temporary 5% reduced rate of VAT from 15 July. This applies to businesses in the hospitality, hotel and holiday accommodation industries and admission to certain attractions. Data for May to July 2020 show the accommodation and food service activities sector is showing the strongest recovery in vacancies from its record low in April to June. Experimental Adzuna adverts data for 17 July show the growth in the total number of job adverts in the categories “travel/tourism” and “catering and hospitality” continued to decline compared with their respective 2019 averages but at a slower rate compared with the week prior to the announcement of VAT cuts in July 2020. In addition to VAT cuts, the Eat Out to Help Out Scheme was announced effective from 3 to 31 August 2020; this involves a 50% discount applied to food and non-alcoholic drinks in registered restaurants. This is intended to stimulate labour demand and hiring activity in the accommodation and food industry in coming months.
Back to table of contents13. Labour market data
Summary of labour market statistics
Dataset A01 | Released 11 August 2020
Estimates of employment, unemployment and other employment-related statistics for the UK.
Employment, unemployment and economic inactivity
Dataset A02 SA | Released 11 August 2020
Estimates of UK employment, unemployment and economic inactivity for people aged 16 years and over and people aged between 16 and 64 years based on the Labour Force Survey (LFS).
Average weekly earnings
Dataset EARN01 | Released 11 August 2020
Estimates of Great Britain earnings growth based on the Monthly Wages and Salaries Survey.
Vacancies by industry
Dataset VACS02 | Released 11 August 2020
Estimates of the number of UK job vacancies for each industry, based on a survey of businesses.
Real Time Information statistics
Dataset Real Time Information statistics | Released 11 August 2020 Earnings and employment statistics from Pay As You Earn (PAYE) Real Time Information (RTI) (Experimental Statistics) seasonally adjusted.
Claimant Count
Dataset CLA01 | Released 11 August 2020
Experimental estimates of the Claimant Count including Jobseeker’s Allowance and out of work Universal Credit claimants.
Labour Force Survey weekly estimates
Dataset X07 | Released 11 August 2020
LFS weekly estimates of employment, unemployment, economic inactivity and hours in the UK. All estimates are calculated from highly experimental weekly LFS datasets.
View all related data on the related data page. Alternatively, Nomis provides free access to the most detailed and up-to-date UK labour market statistics from official sources.
14. Glossary
Average weekly earnings
Average weekly earnings measures money paid by employers to employees in Great Britain before tax and other deductions from pay. The estimates are not just a measure of pay rises as they also reflect, for example, changes in the overall structure of the workforce. More high-paid jobs in the economy would have an upward effect on the earnings growth rate.
Economic inactivity
People not in the labour force (also known as economically inactive) are not in employment but do not meet the internationally accepted definition of unemployment because they have not been seeking work within the last four weeks and/or they are unable to start work in the next two weeks. The economic inactivity rate is the proportion of people aged between 16 and 64 years who are not in the labour force.
Employment
Employment measures the number of people in paid work or who had a job that they were temporarily away from (for example, because they were on holiday or off sick). This differs from the number of jobs because some people have more than one job. The employment rate is the proportion of people aged between 16 and 64 years who are in employment. A more detailed explanation is available in A guide to labour market statistics.
Unemployment
Unemployment measures people without a job who have been actively seeking work within the last four weeks and are available to start work within the next two weeks. The unemployment rate is not the proportion of the total population who are unemployed. It is the proportion of the economically active population (those in work plus those seeking and available to work) who are unemployed.
Vacancies
Vacancies are defined as positions for which employers are actively seeking recruits from outside their business or organisation. The estimates are based on the Vacancy Survey; this is a survey of businesses designed to provide estimates of the stock of vacancies across the economy, excluding agriculture, forestry and fishing (a small sector for which the collection of estimates would not be practical).
Claimant Count
The Claimant Count measures the number of people claiming unemployment-related benefits.
The Claimant Count estimates are currently designated as Experimental Statistics because the Universal Credit estimates are still being developed by the Department for Work and Pensions (DWP). However, the Claimant Count estimates provide the best available estimates of the number of people claiming unemployment-related benefits in the UK.
The Claimant Count does not meet the internationally agreed definition of unemployment specified by the International Labour Organization (ILO). The estimates are sourced from the Jobcentre Plus administrative system.
There is a large degree of overlap between the Claimant Count and unemployment, although the latter figures are generally much higher. People who are not claimants can appear among the unemployed if they are not entitled to unemployment-related benefits. For example:
people who are only looking for part-time work
young people under 18 years are not usually eligible to claim Jobseeker's Allowance
students looking for vacation work
people who have left their job voluntarily
Some people recorded in the Claimant Count would not be counted as unemployed. For example, in certain circumstances people can claim Jobseeker's Allowance or Universal Credit while they have relatively low earnings from part-time work. These people would not be unemployed.
Pay As You Earn (PAYE) Real Time Information (RTI)
These data come from HM Revenue and Customs' (HMRC's) Pay As You Earn (PAYE) Real Time Information (RTI) system. They cover the whole population rather than a sample of people or companies, and they will allow for more detailed estimates of the population. The release is classed as Experimental Statistics as the methodologies used to produce the statistics are still in their development phase. As a result, the series are subject to revisions.
PAYE is the system employers and pension providers use to take Income Tax and National Insurance contributions before they pay wages or pensions to employees and pensioners. This publication relates to employees only and not pensioners.
A more detailed glossary is available.
Back to table of contents15. Measuring the data
Coronavirus
In response to the developing coronavirus (COVID-19) pandemic, we are working to ensure that we continue to publish economic statistics. For more information, please see COVID-19 and the production of statistics.
We have reviewed all publications and data published as part of the labour market release in response to the coronavirus pandemic. This has led to the postponement of some publications and datasets to ensure that we can continue to publish our main labour market data. This will protect the delivery and quality of our remaining outputs and ensure we can respond to new demands as a direct result of the coronavirus.
For more information on how labour market data sources, among others, will be affected by the coronavirus pandemic, see the statement published on 27 March 2020. A further article published on 6 May 2020 detailed some of the challenges that we have faced in producing estimates at this time. A blog published by Jonathan Athow, Deputy National Statistician for Economic Statistics, explains why nearly half a million employees are not being paid.
Our latest data and analysis on the impact of the coronavirus on the UK economy and population is available on our dedicated coronavirus web page. This is the hub for all special coronavirus-related publications, drawing on all available data.
After EU withdrawal
As the UK leaves the EU, it is important that our statistics continue to be of high quality and are internationally comparable. During the transition period, those UK statistics that align with EU practice and rules will continue to do so in the same way as before 31 January 2020.
After the transition period, we will continue to produce our labour market statistics in line with the UK Statistics Authority's Code of Practice for Statistics and in accordance with International Labour Organization (ILO) definitions and agreed international statistical guidance.
The employment, unemployment and economic inactivity estimates rely on data collected from the LFS, a survey run by field interviewers with people across the UK every month.
The LFS performance and quality monitoring reports provide data on response rates and other quality related issues for the LFS, including breakdowns of response by LFS wave, region and question-specific response issues. The average weekly earnings and vacancies estimates rely on data collected from surveys of employers.
More quality and methodology information on strengths, limitations, appropriate uses, and how the data were created is available in the following QMI reports:
Future publication dates
15 September 2020
13 October 2020
10 November 2020
15 December 2020
26 January 2021
23 February 2021
Sampling variability
| Level | Sampling variability of level (*) | Change on quarter | Sampling variability of change on quarter (*) | Change on year | Sampling variability of change on year (*) | |
|---|---|---|---|---|---|---|
| Employment (000s, aged 16+ ) | 32,924 | ± 197 | -220 | ± 166 | 113 | ± 253 |
| Employment rate (aged 16 to 64) | 76.4 | ± 0.4 | -0.2 | ± 0.4 | 0.3 | ± 0.6 |
| Average weekly hours | 25.8 | ± 0.2 | -5.6 | ± 0.2 | -6.3 | ± 0.3 |
| Unemployment (000s, aged 16+) | 1,338 | ± 80 | -10 | ± 82 | 9 | ± 104 |
| Unemployment rate (aged 16+) | 3.9 | ± 0.2 | 0.0 | ± 0.2 | 0.0 | ± 0.3 |
| Economically active (000s, aged 16+) | 34,262 | ± 188 | -230 | ± 162 | 122 | ± 243 |
| Economic activity rate (aged 16 to 64) | 79.6 | ± 0.4 | -0.2 | ± 0.4 | 0.4 | ± 0.5 |
| Economically inactive (000s, aged 16 to 64) | 8,435 | ± 172 | 82 | ± 146 | -127 | ± 221 |
| Economic inactivity rate (aged 16 to 64) | 20.4 | ± 0.4 | 0.2 | ± 0.4 | -0.4 | ± 0.5 |
| Redundancies (000s, aged 16+) | 134 | ± 24 | 27 | ± 31 | 30 | ± 30 |
Download this table Table 1: Labour Force Survey sampling variability (95% confidence intervals)
.xls .csv
| Annual growth rate (estimate) | Sampling variability of growth rate¹ | |
|---|---|---|
| Total pay (nominal) | -1.2 | ± 0.5 |
| Total pay (real) | -2.0 | |
| Regular pay (nominal) | -0.2 | ± 0.5 |
| Regular pay (real) | -1.0 |
Download this table Table 2: Summary of employee earnings, seasonally adjusted, Great Britain, April to June 2020
.xls .csv16. Strengths and limitations
Accuracy of the statistics: estimating and reporting uncertainty
Some of the figures in this bulletin come from surveys, which gather information from a sample rather than from the whole population. The sample is designed to be as accurate as possible given practical limitations such as time and cost constraints. Therefore, the estimates presented in this bulletin contain some uncertainty and are not precise figures. This can have an impact on how changes in the estimates should be interpreted, especially for short-term comparisons.
As the number of people available in the sample gets smaller, the variability of the estimates that we can make from that sample size gets larger. Estimates for small groups (for example, unemployed people aged between 16 and 17 years), which are based on small subsets of the Labour Force Survey (LFS) sample, are less reliable and tend to be more volatile than for larger aggregated groups (for example, the total number of unemployed people).
In general, changes in the numbers (and especially the rates) reported in this bulletin between three-month periods are small and are not usually greater than the level that can be explained by sampling variability. Short-term movements in reported rates should be considered alongside longer-term patterns in the series and corresponding movements in other sources to give a fuller picture.
Further information is available in A guide to labour market statistics.
Where to find data about uncertainty and reliability
Dataset A11 shows sampling variabilities for estimates derived from the LFS.
Sampling variability information for average weekly earnings growth rates is available from the “Sampling Variability” worksheets within datasets EARN01 and EARN03. The sampling variability of the three-month average vacancies level is around plus or minus 1.5% of that level. Information on revisions is available in the labour market statistics revisions policy.
Back to table of contents