Table of contents
- Other pages in this release
- Main points
- Vacancies for May to July 2020
- Jobs for March 2020 (first published on 16 June 2020)
- Public sector employment for March 2020 (first published on 16 June 2020)
- Vacancies, jobs and public sector employment data
- Glossary
- Measuring the data
- Strengths and limitations
- Related links
1. Other pages in this release
2. Main points
There were an estimated 370,000 vacancies in the UK in May to July 2020, this is 10% higher than the record low in April to June 2020.
Vacancies in the larger businesses saw record lows in May to July 2020; businesses in the 250 to 2,499 size band fell to a record low of 66,000 vacancies and businesses in the 2,500 plus size band fell to a record low of 140,000 vacancies.
Vacancies for smaller businesses (49 or fewer employees) saw record lows in April to June 2020 but have since increased by around 45%; medium sized businesses (50 to 249 employees) were also at a record low in April to June 2020 but have increased by around 10%.
Accommodation and food service activities" is showing signs of recovery with vacancies per 100 employee jobs ratio increasing more than other industries after being one of lowest ratio by sector in April to June 2020.
Workforce jobs have continued to increase to March 2020, however, there are signs of levelling off in recent quarters mainly because of a decrease in self-employed jobs, which includes data after the implementation of coronavirus (COVID-19) measures.
Public sector employment has continued to increase in March 2020, driven by increases in the NHS (31.9% of all people employed in the public sector), the Civil Service, public bodies and HM Forces.
Because of social distancing measures leading to the temporary closure of businesses across the UK, there have been some difficulties in collecting data and producing estimates. More information can be found in Measuring the data.
3. Vacancies for May to July 2020
The monthly Vacancy Survey asks businesses for the number of external vacancies on a specified count date, used for three-month rolling averages. Count dates for the latest data, May to July 2020, are 7 May, 5 June and 3 July 2020, all of which follow the start of coronavirus (COVID-19) social distancing measures. Count dates for the previous quarter, February to April 2020, were 7 February, 6 March and 3 April 2020; the responses for the first two dates are prior to the start of coronavirus social distancing measures.
For the three-month rolling average of vacancies, the standard errors are around 10,000 (1.5% expressed as a coefficient of variation), giving a 95% confidence interval of plus or minus 20,000.
Figure 1: May to July 2020 saw a ten percent increase in the level of vacancies since the record low in April to June 2020
Number of vacancies in the UK, seasonally adjusted, between May to July 2001 and May to July 2020
Source: Office for National Statistics – Vacancy Survey
Download this chart Figure 1: May to July 2020 saw a ten percent increase in the level of vacancies since the record low in April to June 2020
Image .csv .xlsThe estimated number of vacancies in the UK fell sharply during the recession of 2008 to 2009. Since 2012, it has generally increased, reaching a record high of 855,000 in November 2018 to January 2019. Vacancies remained at a high level until the start of coronavirus social distancing measures, where they fell more sharply than during the recession. For May to July 2020, there were an estimated 370,000 vacancies in the UK, which is 10% higher than the record low in April to June 2020. The increase is driven by small businesses (49 or fewer employees), some of which are reporting taking on staff to meet COVID-19 guidelines. Estimated vacancies for May to July 2020 are 274,000 fewer than in the previous quarter February to April 2020 (where the responses for the first two months are prior to the start of coronavirus social distancing measures) and 453,000 fewer than a year earlier.
The vacancy headline estimate is based on a seasonally adjusted, three-month moving average and has National Statistics status. Single-month vacancy estimates are available in dataset X06. They should be used with caution as they are experimental, non-seasonally adjusted statistics and should not be considered accurate estimates of vacancies in the reported months, because of the high volatility caused by the survey sample design (see Strengths and limitations).
Figure 2: The experimental single month series indicates an increase of approximately 30% in the estimated vacancies for July 2020 compared with April 2020
Moving three-month averages of vacancies and single-month vacancies in the UK, both non-seasonally adjusted Experimental Statistics, between May to July 2001 and May to July 2020
Source: Office for National Statistics – X06 dataset
Download this chart Figure 2: The experimental single month series indicates an increase of approximately 30% in the estimated vacancies for July 2020 compared with April 2020
Image .csv .xlsThe three-month average non-seasonally adjusted series in Figure 2 is more volatile than the seasonally adjusted series shown in Figure 1.
While the experimental single-month estimates should not be considered accurate estimates of vacancies in the reported months, it does indicate an increase of approximately 30% in the estimated vacancies for July 2020 compared with April 2020, with the "accommodation and food service activities" sector showing the strongest recovery.
We now publish a weekly Adzuna Online job advert estimates dataset as part of the Coronavirus and the latest indicators for the UK economy release. The online job advert estimates show a decline of around 60% in total vacancies from early March to early May generally followed by an increase and stabilisation of vacancies in July. Catering and hospitality online job adverts saw the largest increase in vacancies between the start of June and start of July which is consistent with our vacancy survey. The online job advert estimates for July show a smaller increase in vacancies compared with our vacancy survey. The increase in our vacancy survey estimates is driven by smaller businesses. Any vacancies that are not advertised online would not be included in the online job advert estimates; if small businesses are advertising vacancies through alternative methods this could explain the difference between our vacancy survey and the online job advert estimates. The latest weekly online job adverts publish vacancies with a lag of six days and includes regional estimates of vacancies.
Figure 3: Accommodation and food service activities is showing signs of recovery with vacancies per 100 employee jobs ratio increasing more than other industries after being one of lowest ratio by sector in April to June 2020
Job vacancies per 100 employee jobs for selected industries in the UK, seasonally adjusted, between May to July 2001 and May to July 2020
Source: Office for National Statistics – Vacancy Survey
Download this chart Figure 3: Accommodation and food service activities is showing signs of recovery with vacancies per 100 employee jobs ratio increasing more than other industries after being one of lowest ratio by sector in April to June 2020
Image .csv .xlsFor May to July 2020, it is estimated that:
the vacancies per 100 employee jobs ratio has increased to 1.2, after a record low of 1.1 in April to June 2020
"accommodation and food service activities" is showing signs of recovery with vacancies per 100 employee jobs ratio increasing more than other industries after being one of lowest ratio by sector in April to June 2020
"human health and social work activities" remains the largest sector in terms of both vacancy level (103,000) and ratio (2.5) and accounts for 27.8% of all vacancies; areas of this sector such as care homes and home care are starting to show signs of a recovery
there are quarterly decreases in all sectors; sectors contributing most strongly to the quarterly movement are "wholesale, retail trade and repair of motor vehicles" down 57,000 (negative 57.0%) and "accommodation and food service activities" down by 37,000 (negative 67.9%); both of these industries have been affected heavily by social distancing measures, with hotels, restaurants and retail stores being closed as a result
all sectors show negative annual movements, the two sectors contributing the most to the 453,000 decrease in all vacancies are "wholesale and retail trade; repair of motor vehicles and motor cycles" (down 91,000) and "accommodation and food service activities" (down 75,000)
4. Jobs for March 2020 (first published on 16 June 2020)
Workforce jobs estimates are a combination of estimates of employee jobs mainly sourced from employer surveys, self-employment jobs from the Labour Force Survey, HM Forces personnel and government-supported trainees.
The majority of the latest employee jobs data were sought on a specified count date, 13 March 2020, before the start of coronavirus (COVID-19) social distancing measures. Latest self-employment estimates from the Labour Force Survey are based on interviews from the start of February to the end of April 2020, so only around half of these relate to the period prior to the start of social distancing, while interviews in the final week of March and the whole of April relate to the lockdown period.
Figure 4: Between December 2019 and March 2020, the total number of jobs in the UK increased by 35,000 to reach an estimated 35.83 million
Number of jobs in the UK, seasonally adjusted, March 2020
Source: Office for National Statistics – Workforce jobs
Download this chart Figure 4: Between December 2019 and March 2020, the total number of jobs in the UK increased by 35,000 to reach an estimated 35.83 million
Image .csv .xlsThe number of jobs is not the same as the number of people in employment. This is because a person can have more than one job. Estimates for the number of people in employment are available in Employment in the UK.
It is estimated that:
the number of jobs has been generally increasing since 2013, but is showing signs of levelling off in recent quarters
there were a record-high 35.83 million jobs in the UK in March 2020; this is 35,000 more than in December 2019 and 289,000 higher than in March 2019
the 35,000 growth in jobs is composed of an increase of 181,000 in employee jobs, a fall of 143,000 in self- employment jobs, a rise of 1,000 in HM Forces personnel and a fall of 4,000 in government-supported trainees
the largest sector, with an estimated 4.97 million jobs, was the “wholesale and retail trade; repair of motor vehicles and motorcycles” sector in March 2020; this represents 13.9% of total jobs
the next largest sector was “human health and social work”, with 4.48 million jobs in March 2020
several sectors were at a record high in March 2020, including “professional, scientific and technical activities” (3.29 million jobs), “accommodation and food service activities” (2.53 million jobs), “information and communication” (1.56 million jobs) and “real estate activities” (0.66 million jobs)
Figure 5: The small increase in Workforce jobs between December 2019 and March 2020 is driven by an increase in employee jobs, but is counterbalanced by a fall in self-employment jobs
Changes in the number of jobs in the UK, seasonally adjusted, December 2019 to March 2020
Source: Office for National Statistics – Workforce jobs
Download this chart Figure 5: The small increase in Workforce jobs between December 2019 and March 2020 is driven by an increase in employee jobs, but is counterbalanced by a fall in self-employment jobs
Image .csv .xlsThe sectors showing the largest estimated quarterly increase in jobs are "professional, scientific and technical activities" (57,000), "information and communication" (30,000) and "accommodation and food service activities" (22,000). In these sectors employee jobs are driving the majority of the positive movement in jobs, with positive contribution from self-employment jobs (except "accommodation and food service activites", which saw a fall of 4,000 in self-employment jobs).
The sectors showing the largest estimated quarterly falls in jobs are "other service activities" (50,000), "agriculture, forestry and fishing" (37,000) and "construction" (11,000). In "construction" the employee jobs increased by 17,000 and self-employment jobs fell by 31,000, but in both of the other sectors there were falls in both employee jobs and self-employment jobs.
The quarterly movement in "human health and social work activities" is an increase of 4,000, which is not significant, but it should be noted that the overall movement includes a 38,000 increase in employee jobs and a fall of 28,000 in self-employment jobs. Similarly, "transportation and storage" has fallen by 3,000 jobs, which is caused by a 34,000 increase in employee jobs and a 36,000 fall in self-employment jobs.
Back to table of contents5. Public sector employment for March 2020 (first published on 16 June 2020)
Public sector employment estimates are point-in-time employment estimates and relate to a specific day in the published month. The reference date for this quarter is 13 March 2020 for the local authorities survey, 1 April for HM Forces, and 31 March for all other sources. The majority of responses are from the end of March and early April, after the start of coronavirus (COVID-19) social distancing measures.
Figure 6: Since 2018 public sector employment has been steadily increasing after a long term fall from 2009
Total public sector employment, seasonally adjusted, UK, March 1999 to March 2020
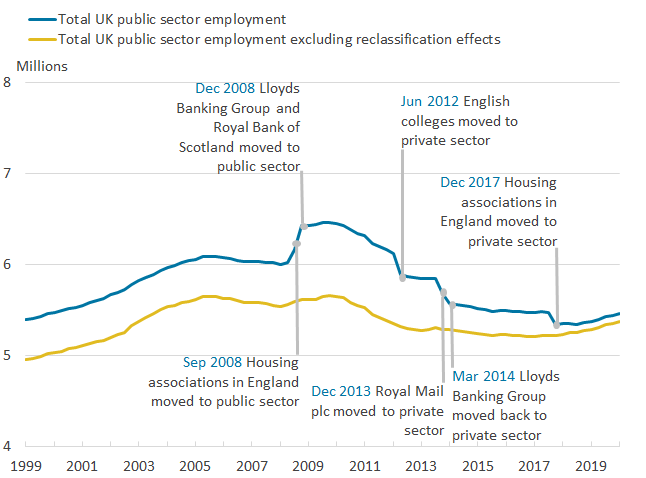
Source: Office for National Statistics – Quarterly Public Sector Employment Survey
Download this image Figure 6: Since 2018 public sector employment has been steadily increasing after a long term fall from 2009
.png (24.0 kB) .xlsx (23.6 kB)
There were an estimated 5.47 million employees in the public sector for March 2020. This was an increase of 26,000 (0.5%) compared with December 2019 and an increase of 91,000 (1.7%) compared with March 2019.
Of all people in paid work, 16.6% were employed in the public sector for March 2020. This is 0.1 percentage points higher than December 2019 and 0.2 percentage points higher than March 2019.
Private sector employment estimates are derived as the difference between total employment estimates, sourced from the Labour Force Survey, and public sector employment estimates collected from public sector organisations. The number of employees in the private sector was 27.53 million for March 2020, which was 20,000 (0.1%) fewer than for December 2019 and 154,000 (0.6%) more than the estimate for a year earlier.
Figure 7: Record high of central government employment contrasts with record low of local government employment
Public sector employment in local and central government, seasonally adjusted, UK, March 1999 to March 2020
Source: Office for National Statistics – Quarterly Public Sector Employment Survey
Notes:
July 2010: Academies Act 2010 passed.
June 2012: English colleges moved to the private sector.
Download this chart Figure 7: Record high of central government employment contrasts with record low of local government employment
Image .csv .xlsThe latest estimates show a continuing trend of more people employed in central government and fewer people employed in local government, mainly because of increases in the National Health Service and some local authority schools in England converting to academy status. Employees move from local government to central government when local authority schools become academies. In March 2020, academy conversions accounted for 3,000 employees over the quarter and 31,000 over the year.
The estimated number of people employed in central government continued to increase to reach a new record high of 3.30 million for March 2020. It is up 27,000 (0.8%) compared with December 2019 and up 108,000 (3.4%) compared with March 2019, as shown in Figure 7.
The estimated number of people employed in local government decreased by 1,000 (0.0%) between December 2019 and March 2020 to reach 2.01 million. It is down 16,000 (0.8%) compared with March 2019, as shown in Figure 7. Since 2018, the rate of decrease in local government employment has lessened.
Figure 8: Without the transfer of academies from local to central government, employment in local government has stabilized since 2018
Public sector employment in local and central government, excluding academy transfers, seasonally adjusted, UK, March 1999 to March 2020
Source: Office for National Statistics – Quarterly Public Sector Employment Survey
Notes:
July 2010: Academies Act 2010 passed.
June 2012: English colleges moved to the private sector.
Download this chart Figure 8: Without the transfer of academies from local to central government, employment in local government has stabilized since 2018
Image .csv .xlsExcluding transfers of academy schools from local to central government, employment continues to increase in central government, while in local government the level of employment has decreased before stabilising, as shown in Figure 8.
Without academy conversions, for March 2020, employment in central government increased by 24,000 on the previous quarter and 77,000 on the previous year, while in local government it increased by 2,000 on the quarter and 15,000 on the year.
Increases in employment in March 2020 in the NHS of 17,000 employees, police of 4,000 employees, Civil Service of 3,000 employees and HM Forces of 1,000 employees contributed to the rise in public sector employment compared with December 2019.
Figure 9: NHS and public administration employment continues to increase, contributing to the growth in public sector employment
Public sector employment, by selected industries, seasonally adjusted, UK, March 1999 to March 2020
Source: Office for National Statistics – Quarterly Public Sector Employment Survey
Download this chart Figure 9: NHS and public administration employment continues to increase, contributing to the growth in public sector employment
Image .csv .xlsFor March 2020, there were 1.74 million people employed in the NHS, the highest figure on record. The NHS headcount increased by 17,000 (1.0%) from December 2019. This is the largest quarterly percentage increase for the NHS in the first quarter since 2004. Compared with March 2019, the NHS headcount increased by 61,000 (3.6%).
Some of the increase could be as a result of coronavirus (COVID-19) planning, however, it is not possible to confirm how much. Prior to the coronavirus, the NHS headcount had been increasing since September 2013 with quarterly percentage growths of between 0.8% and 0.9% in 2019. For March 2020, the NHS accounted for 31.9% of all people employed in the public sector and 5.3% of all people in paid work in the UK.
There were an estimated 1.07 million people employed in public administration for March 2020. This was 2,000 (0.2%) more than for December 2019 and 17,000 (1.6%) more than for a year earlier. Employment in public administration has increased every quarter since December 2016. Increases in the Home Civil Service have contributed to the growth in public administration.
For March 2020, there were 456,000 people employed in the Home Civil Service (8.3% of total public sector employment). This was 3,000 (0.7%) more compared with December 2019 and 10,000 (2.2%) more than for March 2019. The Home Civil Service has seen a steady increase in employment since the record low of 416,000 recorded for June, September and December 2016.
Back to table of contents6. Vacancies, jobs and public sector employment data
Vacancies by industry
Dataset VACS02 | Released 11 August 2020
Estimates of vacancies by industry (Standard Industrial Classification 2007).
Workforce jobs summary
Dataset JOBS01 | Released 16 June 2020
Estimates of jobs by type of job (including employee jobs, self-employment jobs, HM Forces and government-supported trainees).
Workforce jobs by industry
Dataset JOBS02 | Released 16 June 2020
Estimates of jobs by industry (Standard Industrial Classification 2007).
Public sector employment
Dataset | Released 16 June 2020
Quarterly estimates of UK and regional public sector employment, made up of central government (including Civil Service), local government and public corporations. The estimates also include an industrial breakdown.
Public sector employment time series
Dataset | Dataset ID: PSE | Released 16 June 2020
Seasonally adjusted and non-seasonally adjusted quarterly time series of UK public sector employment, containing the latest estimates.
EMP13: Employment by industry
Dataset | Released 11 August 2020
Estimates of public and private sector employment from the Labour Force Survey. This table is updated four times a year in February, May, August and November.
7. Glossary
Vacancies
Vacancies are defined as positions for which employers are actively seeking recruits from outside their business or organisation. The estimates are based on the Vacancy Survey; this is a survey of businesses designed to provide estimates of the stock of vacancies across the economy, excluding "agriculture, forestry and fishing" (a small sector for which the collection of estimates would not be practical).
Jobs
A job is an activity performed for an employer or customer by a worker in exchange for payment, usually in cash, or in kind, or both. The number of jobs is not the same as the number of people in employment. This is because a person can have more than one job. The number of jobs is the sum of employee jobs from employer surveys, self-employment jobs from the Labour Force Survey (LFS), those in HM Forces and government-supported trainees. The number of people in employment is measured by the LFS; these estimates are available in our Employment in the UK release.
Central government
Central government includes all administrative departments of government and other central agencies and non- departmental public bodies (NDPBs); as such, it is wider than the "Civil Service". This sector also includes HM Forces and the NHS. Within education, academies are classified to central government.
Civil Service
A civil servant is a person employed in the public sector on behalf of a central government department, agency or non-departmental government body (NDPB). The UK Home Civil Service excludes the Northern Ireland Civil Service, other Crown servants and employees of the wider public sector; there are Home Civil Service employees based in Northern Ireland and overseas.
Local government
Local government covers those types of public administration that only cover a locality and any bodies controlled and mainly financed by them. It includes police forces and their civilian staff for England and Wales, excluding the British Transport Police.
Public corporations
Public corporations are companies or quasi-corporations controlled by government. These companies receive more than half their income from sales of goods or services into the marketplace. A more detailed glossary is available.
Back to table of contents8. Measuring the data
Coronavirus (COVID-19)
In response to the developing coronavirus (COVID-19) pandemic, we are working to ensure that we continue to publish economic statistics. For more information, please see COVID-19 and the production of statistics.
We have reviewed all publications and data published as part of the labour market release in response to the coronavirus pandemic. This has led to the postponement of some publications and datasets to ensure that we can continue to publish our main labour market data. This will protect the delivery and quality of our remaining outputs as well as ensuring we can respond to new demands as a direct result of the coronavirus.
For more information on how labour market data sources, among others, will be affected by the coronavirus pandemic, see the statement published on 27 March 2020. A further article published on 6 May 2020, detailed some of the challenges that we have faced in producing estimates at this time.
Our latest data and analysis on the impact of the coronavirus on the UK economy and population are now available on our dedicated COVID-19 webpage. This will be the hub for all special coronavirus-related publications, drawing on all available data.
Impact on production of vacancy and workforce job estimates
Because of social distancing measures leading to the temporary closure of businesses across the UK, there have been some difficulties in collecting data using the Vacancy Survey and the Short-Term Employment Surveys. Survey response rates were lower than is typical. To protect the quality of our output, we have used alternative sources where possible to inform data. We have used Standard Industrial Classification (SIC) section-level indications from the Business Impact of COVID-19 Survey (BICS), as well as survey contributor-level comments provided to us over the telephone or electronically, as a guide on whether businesses are operational and likely, or not, to be actively recruiting and to confirm employment figures.
Impact on production of public sector estimates
For March 2020, the Public Sector Employment Survey received 92% response to all questionnaires, compared with 93% for December 2019. The impact on the survey response and levels of imputation and construction are not statistically significant. Survey contributor-level comments provided to us over the telephone or electronically suggested the estimates were largely unaffected by coronavirus planning.
Sources
The data in this bulletin come from surveys of businesses. It is not feasible to survey every business in the UK, so these statistics are estimates based on samples, not precise figures.
Vacancies
Estimates of vacancies are obtained from the Vacancy Survey, a survey of employers.
Jobs
Estimates of jobs are compiled from a number of sources, including Short-Term Employment Surveys (STES), the Quarterly Public Sector Employment Survey (QPSES) and the Labour Force Survey (LFS). STES is a group of surveys that collect employment and turnover information from private sector businesses. In December of each year, the jobs estimates are "benchmarked" to the latest estimates from the Business Register and Employment Survey (BRES).
More quality and methodology information on strengths, limitations, appropriate uses, and how the data were created is available in the Vacancy Survey QMI and Workforce jobs QMI.
Public sector employment
The main source of Public sector employment (PSE) is the Quarterly Public Sector Employment Survey, which aims to obtain complete coverage of local authorities and the Civil Service, and coverage of all public bodies with 20 or more employees. It is difficult to achieve complete coverage for local and central government, for example, in the education sector. Further information can be found in the Public sector employment QMI.
While this bulletin focuses on headcount estimates of PSE, full-time equivalent estimates (based on the number of hours worked divided by the standard full-time hours) are available in the accompanying PSE datasets.
All PSE time series in this release, with the exception of the regional series, are seasonally adjusted to aid interpretation. Relationships that hold in the unadjusted series do not necessarily hold for the seasonally adjusted series. For example, total PSE equals the total of all public sector industry estimates before seasonal adjustment, but this is not necessarily true after seasonal adjustment.
Comparisons of public and private sector employment over time are complicated by a number of major reclassifications, where bodies employing large numbers of people have moved between the public and private sectors. We produce estimates of public and private sector employment excluding the effects of major reclassifications to help you understand underlying trends in employment. We publish these alongside estimates of total public and private sector employment in Tables 5, 6a and 7a of the PSE datasets.
While our headline estimates of public sector employment are derived from the Quarterly Public Sector Employment Survey (QPSES), estimates of public and private sector employment from the Labour Force Survey (a survey of households) are available at Dataset EMP13. While the QPSES estimates follow national accounts definitions of public and private sector employment, the estimates from the Labour Force Survey are based on survey respondents' perceptions of whether they are employed in the public or private sector and they provide higher estimates of public sector employment than the QPSES survey.
More detailed statistics on employment in the Civil Service, such as regional analyses, diversity and earnings statistics, can be found in the annual Civil Service statistics release. Responsibility for the collection and publication of this annual release was transferred to the Cabinet Office with effect from 1 October 2018, and statistics for 2019 were published on 24 July 2019.
Estimates of public sector employment (PSE) in Scotland are published quarterly by the Scottish Government on the same day as this bulletin.
Estimates of public and private sector employment in Northern Ireland are published by the Northern Ireland Statistics and Research Agency (NISRA) in the Northern Ireland Quarterly Employment Survey release.
Sampling variability
Sampling variability information for jobs is available in Table 1 in this bulletin and in dataset JOBS07: Workforce jobs sampling variability.
The sampling variability of the three-month average vacancies level is around plus or minus 1.5% of that level.
The sampling variability of the three-month average vacancies level, for a typical industrial sector is around plus or minus 6% of that level.
| SIC 2007 Section | United Kingdom | ||
|---|---|---|---|
| Estimate for Mar 2020 | Sampling variability of estimate¹ | ||
| A | Agriculture, forestry & fishing | 376 | ±41 |
| B | Mining & quarrying | 64 | ±5 |
| C | Manufacturing | 2,707 | ±39 |
| D | Electricity, gas, steam & air conditioning supply | 154 | ±11 |
| E | Water supply, sewerage, waste & remediation activities | 234 | ±9 |
| F | Construction | 2,284 | ±59 |
| G | Wholesale & retail trade; repair of motor vehicles and motorcycles | 4,949 | ±59 |
| H | Transport & storage | 1,790 | ±47 |
| I | Accommodation & food service activities | 2,521 | ±55 |
| J | Information & communication | 1,563 | ±48 |
| K | Financial & insurance activities | 1,130 | ±27 |
| L | Real estate activities | 660 | ±36 |
| M | Professional scientific & technical activities | 3,285 | ±75 |
| N | Administrative & support service activities | 3,009 | ±61 |
| O | Public admin & defence; compulsory social security | 1,544 | ±13 |
| P | Education | 2,984 | ±41 |
| Q | Human health & social work activities | 4,483 | ±65 |
| R | Arts, entertainment & recreation | 1,028 | ±43 |
| S/T | Other service activities/Private Households | 1,026 | ±43 |
| All jobs | 35,793 | ±194 | |
Download this table Table 1: Sampling variability for estimates of jobs in the UK, thousands
.xls .csv
| Response (% of questionnaires returned) | Response (% of employment returned) | |
|---|---|---|
| Local Authorities Survey | 93 | 88 |
| Public Bodies Survey | 87 | 69 |
| Civil Service Survey | 100 | 100 |
| Other sources | 100 | 100 |
Download this table Table 2: Response rates for sources of UK public sector employment, March 2020
.xls .csv9. Strengths and limitations
Accuracy of the statistics: estimating and reporting uncertainty
The figures in this bulletin mainly come from surveys of businesses, which gather information from a sample rather than from the whole population. The samples are designed to be as accurate as possible given practical limitations such as time and cost constraints. Results from sample surveys are always estimates, not precise figures. This can have an impact on how changes in the estimates should be interpreted, especially for short-term comparisons.
As the number of people available in the sample gets smaller, the variability of the estimates that we can make from that sample size gets larger. Estimates for small groups (for example, vacancies in the construction industry), which are based on small subsets of the Vacancy Survey sample, are less reliable and tend to be more volatile than for larger aggregated groups (for example, total vacancies in the UK).
In general, short-term changes in the growth rates reported in this bulletin are not usually greater than the level that can be explained by sampling variability. Short-term movements in reported rates should be considered alongside longer-term patterns in the series and corresponding movements in other sources to give a fuller picture.
Vacancies
The vacancy headline estimate is based on a seasonally adjusted, three-month moving average and has National Statistics status. Further information about how single estimates have impacted the three-month estimates is available in the x06 dataset. These experimental estimates are non-seasonally adjusted and should not be considered accurate estimates of vacancies in the reported months because of the high volatility caused by the survey sample design. They can be used to indicate an approximate change in the level of total vacancies. Approximately 80% of the rotational survey overlaps every three months, therefore a comparison of vacancy estimates for a given month to three months prior can provide a reasonable indication of the change in monthly vacancies.
Public sector employment
Public sector employment estimates are based on a complete census of local government and Civil Service and cover all public bodies with 20 or more employees. The usual sampling and estimation techniques applicable to our business surveys are therefore not applicable (for instance, it is not possible for sampling errors or confidence intervals to be produced).
Our targets for response to the Local Authorities and Public Bodies Quarterly Public Sector Employment Survey (QPSES) before the results are compiled are 90% (number of respondents) and 90% (of total employment). In addition, each survey has a list of critical respondents (usually those with the largest employment) for which special efforts are made to achieve 100% response and clearance of test failures. For the Civil Service QPSES, the targets for response before the results are compiled are 100% (number of respondents) and 100% (of total employment).
Data for non-responders are imputed based on previous returns and known annual changes in seasonality. It is extremely rare for a local authority, public body or Civil Service department to non-respond for two consecutive quarters. The data collection is statutory for local authorities and public bodies (Statistics of Trade Act 1947) and positive action is taken to address non-response issues as and when they occur.
Non-sampling error, or bias, is the variation that occurs by chance from the true values for the population and is not because of sampling. This type of error averages close to zero over a large number of repeats of the survey.
Further information is available in A guide to labour market statistics.
Back to table of contents