Table of contents
- Main points
- Things you need to know about this release
- The households and non-profit institutions serving households (NPISH) saving ratio fell in Quarter 1 2017 due to increases in Income Tax and individual final consumption
- Real households and non-profit institutions serving households (NPISH) disposable income (RHDI) fell
- The increase in household debt was driven by consumer credit expansion and easier lending conditions in the mortgage market
- Which sectors were net lenders or net borrowers?
- Links to related statistics
- Upcoming changes to this bulletin
- Quality and methodology
1. Main points
The saving ratio continued to fall and in Quarter 1 (Jan to Mar) 2017 was 1.7%, a fall from 3.3% in Quarter 4 (Oct to Dec) 2016. This was the lowest since records began in Quarter 1 1963.
Real households disposable income (RHDI) fell by 1.4% in Quarter 1 2017; this was due to a decrease in gross disposable income of 0.9% and an increase in the deflator of 0.5%.
Net borrowing for central government was £4.6 billion in Quarter 1 2017, the lowest since Quarter 1 2002.
The fall in the saving ratio and the reduction of the central government’s net borrowing was due mainly to increases on taxes on income and wealth.
2. Things you need to know about this release
Understanding the sector and financial accounts
This bulletin presents UK aggregate data for the main economic indicators and summary estimates from the institutional sectors of the UK economy: private non-financial corporations, public corporations, financial corporations, central and local government, and households and non-profit institutions serving households (NPISH) as well as the rest of the world sector, that are presented in the UK Economic Accounts (UKEA) dataset.
This bulletin uses data from the UKEA. The UKEA provides detailed estimates of national product, income and expenditure, UK Sector Non-financial and Financial Accounts and UK Balance of Payments. These accounts are the underlying data that produce a single estimate of gross domestic product (GDP) using income, production and expenditure data.
The sector accounts are fully integrated, but with a statistical discrepancy, shown for each sector’s account. This reflects the difference between a sector’s net lending or net borrowing from the non-financial account and the net lending or net borrowing from the financial accounts, which should theoretically be equal but differ due to different data sources and measurement practices.
Comparability
Data in this bulletin are internationally comparable. The UK National Accounts are compiled in accordance with the European System of Accounts: ESA 2010, under EU law. ESA 2010 is itself consistent with the standards set out in the United Nations System of National Accounts 2008: SNA 2008.
An explanation of the sectors and transactions described in this bulletin can be found in chapter 2 of the European System of Accounts 2010: ESA 2010 manual.
Estimates within this release
This bulletin includes new data for the latest available quarter, Quarter 1 (Jan to Mar) 2017; there are no revisions made to previously published data. This bulletin follows the National Accounts Revisions Policy.
All data within this bulletin are estimated in current prices (also called nominal prices), with the exception of real households and NPISH disposable income, which is estimated in chained volume measures.
Current price series are expressed in terms of the prices during the time period being estimated. In other words, they describe the prices recorded at the time of production or consumption and include the effect of price inflation over time. Chained volume measure price series (also known as real terms) remove the effect of price inflation.
All figures given in this bulletin are adjusted for seasonality, unless otherwise stated. Seasonal adjustment removes seasonal or calendar effects from data to enable more meaningful comparisons over time.
Population estimates published in this bulletin are consistent with those published on 23 June 2016 in the Population Estimates for UK, England and Wales, Scotland and Northern Ireland publication.
Pre-release access
On 15 June 2017, the National Statistician announced that pre-release access to our statistics will stop with effect from 1 July 2017. Pre-release access will be given for this bulletin.
The quarterly sector accounts dataset is produced by the Office for National Statistics (ONS) with a quality assurance role provided by members of the Government Statistical Service (GSS) working in ONS. Ministers and those officials not directly involved in the production and release of statistics will no longer have access to the bulletin and data tables in advance of publication.
Notices for this bulletin
In the 31 March 2017 publication we identified a processing error in flows of UK corporate bonds. We are investigating the options for addressing the error and will publish revised data on 29 September 2017. The series known to be directly affected are KLC5 and KLC8 (Bonds issued by UK monetary financial institutions and other UK residents). There will be knock-on impacts on bond asset flows and higher-level aggregates.
In the publication of 23 December 2016, we informed you that the tables in the UK Economic Accounts do not contain the most recent data for inventory holding gains for financial corporations and private non-financial corporations for 2015 onwards due to late processing of these data. Data for 2016 were updated in the UK Economic Accounts published on 31 March 2017. Data for 2015 will be updated in the publication on 29 September 2017.
Real households and non-profit institutions serving households (NPISH) disposable income (RHDI) explained
Households and NPISH income is measured in two ways: in current prices (also called nominal prices) and in real terms, where the effect of price inflation is removed.
Gross households and NPISH disposable income (GDI) is the estimate of the total amount of money from income that households and NPISH have available; that is, from wages received, income of the self-employed, social benefits and net income (such as interest on savings and dividends from shares) less taxes on income and wealth. All the components that make up GDI are estimated in current prices. In other words, gross disposable income tells us how much income households and NPISH have to spend, save or invest in the time period being measured (quarter or year) once taxes on income and wealth have been paid.
By adjusting GDI to remove the effects of inflation, we are able to estimate another useful measure of disposable income called real households and NPISH disposable income (RHDI). This is a measure of the real purchasing power of households and NPISH incomes, in terms of the physical quantity of goods and services they would be able to purchase if prices remained constant over time. To remove the effect of price changes on the current price GDI data we use the most relevant national accounts price deflator: the households and NPISH final consumption implied deflator. This divides total current price households and NPISH final consumption by total chained volume measure households and NPISH final consumption to derive a price index.
GDI is then divided by this price index to remove the effects of price inflation. In other words, RHDI enables a comparison over time of how much households and NPISH have to spend, save or invest once taxes on income have been paid, by supposing a given amount of money could buy the same amount of goods and services in each time period.
The households and non-profit institutions serving households (NPISH) saving ratio explained
The saving ratio estimates the amount of money households and NPISH have available to save (known as gross saving) as a percentage of their total disposable income (known as total available resources).
Gross saving estimates the difference between households and NPISH total available resources (mainly wages received, revenue of the self-employed, social benefits and net income such as interest on savings and dividends from shares, but deducting taxes on income and wealth) and their current consumption (expenditure on goods and services).
The saving ratio is published in the UK Economic Accounts (UKEA) as non-seasonally adjusted (NSA) and seasonally adjusted (SA) formats, with the latter removing seasonal effects to allow comparisons over time.
The saving ratio can be volatile and is sensitive to even relatively small movements to its components, particularly on a quarterly basis. This is because gross saving is a small difference between two numbers. It is therefore often revised at successive publications when new or updated data are included.
The saving ratio is considered to be an indicator of households and NPISH confidence. A higher saving ratio may be the result of an increase in income, a decrease in expenditure, or some combination of the two. A rise in the saving ratio may be an indication that households are acting more cautiously by spending less. Conversely, a fall in the saving ratio may be an indication that households are more confident and spending more. Other factors such as interest rates and inflation should also be considered when interpreting the households and NPISH saving ratio.
Reliability
Estimates for the most recent quarters are provisional and are subject to revision in the light of updated source information. Our revisions to economic statistics page shows our work on revisions analysis, linking to articles and revisions policies.
Revisions to data provide one indication of the reliability of main indicators. Revisions triangles are published on our website for the households and non-profit institutions serving households saving ratio.
Who uses these data?
The data used in this bulletin have a broad range of users. They are widely used by government departments to inform and monitor the effect of policy decisions. The data also aid assessments of the economy: such as informing the Bank of England’s Monetary Policy Committee (MPC) when setting monetary policy and the Office for Budget Responsibility’s (OBR) forecasts and evaluations of economic growth and public sector finances. Theoretical and policy debate is also supported by UKEA data at knowledge and research institutions such as think-tanks, lobby groups and universities by researchers, analysts, academics and students. In addition, trade organisations use the sector accounts to further their understanding of their respective industry.
Back to table of contents3. The households and non-profit institutions serving households (NPISH) saving ratio fell in Quarter 1 2017 due to increases in Income Tax and individual final consumption
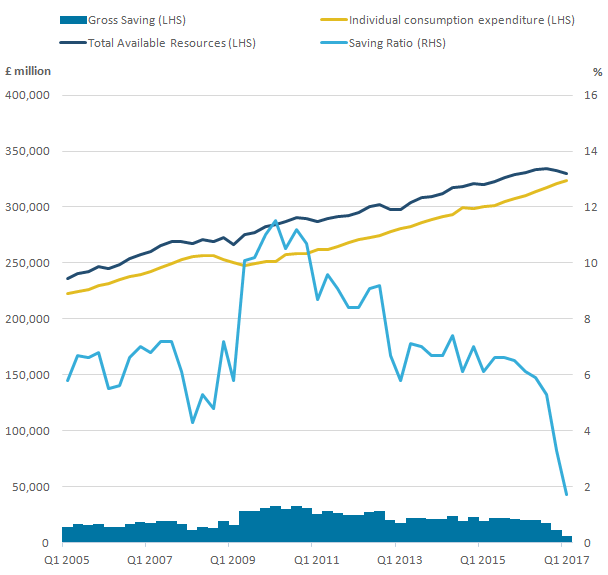
In Quarter 1 (Jan to Mar) 2017, the households and NPISH saving ratio fell to 1.7% from 3.3% in Quarter 4 (Oct to Dec) 2016. This was the lowest quarterly saving ratio since comparable records began in Quarter 1 1963 (Figure 1).
Although we note the saving ratio can be volatile, the saving ratio has been falling since Quarter 3 (July to Sept) 2015.
Figure 1: UK households and non-profit institutions serving households quarterly saving ratio
Quarter 1 (Jan to Mar) 2005 to Quarter 1 (Jan to Mar) 2017
Source: Office for National Statistics
Notes:
- Q1 refers to Quarter 1 (Jan to Mar)
Q2 refers to Quarter 2 (Apr to June)
Q3 refers to Quarter 3 (July to Sept)
Q4 refers to Quarter 4 (Oct to Dec)
Download this image Figure 1: UK households and non-profit institutions serving households quarterly saving ratio
.png (21.2 kB) .xls (3.3 MB)
The saving ratio fell in Quarter 1 2017 due mainly to a £5.0 billion rise in taxes on income and wealth paid by households and a rise in final consumption expenditure of £2.8 billion.
The latest estimates for taxes on income and wealth may in part reflect timing issues, although there is evidence for increased taxes.
There were higher capital gains on the disposal of all assets for the financial year ending (FYE) 2016, partly due to factors such as equity and house price increases. This has led to an increase of capital gains tax receipts in Quarter 1 2017.
Income Tax paid on self-assessment income increased by £2.0 billion. The increase in self-assessment data is based on tax payers reporting tax paid on profits and dividends for the FYE 2016 leading to estimated larger payments for Quarter 1 2017. From 6 April 2016, the government made changes to the tax applied to dividends. These changes are likely to have led to changes in the timing of dividend payments and the taxes paid on them. The increase in self-assessment income also corresponds with an increasing number of self-employed workers.
The remainder of the tax increase is due largely to an increase in receipts from taxes on income from employment, with some evidence of growth in bonus payments in the financial sector.
These increases are consistent with the data published in Appendix 6, table PSA6D part 2 of the Public Sector Finances published on 21 June 2017.
Higher final consumption expenditure and low returns on savings were also causes of this historically low saving ratio.
The main reasons for the rise in final consumption expenditure of £2.8 billion were increased spending on motor vehicles and fuel; and spending on hotels and restaurants. It is also important to note that incentives to save have been reduced, as the Bank of England base rate was cut to 0.25% from August 2016.
The rises in tax paid on income and wealth and final consumption expenditure were partly offset by a rise in net property income (income received from financial investments) of £2.4 billion and a rise in wages and salaries of £1.2 billion.
Figure 2: Contributions to the change in gross saving of UK households and non-profit institutions serving households
Quarter 2 (Apr to June) 2013 to Quarter 1 (Jan to Mar) 2017
Source: Office for National Statistics
Notes:
- Q1 refers to Quarter 1 (Jan to Mar)
Q2 refers to Quarter 2 (Apr to June)
Q3 refers to Quarter 3 (July to Sept)
Q4 refers to Quarter 4 (Oct to Dec)
Download this chart Figure 2: Contributions to the change in gross saving of UK households and non-profit institutions serving households
Image .csv .xlsThe saving ratio fell by 4.4 percentage points when compared with the corresponding quarter a year ago, Quarter 1 2016. This was due mainly to an increase in individual final consumption of £13.8 billion, a fall in net property income of £5.2 billion, a rise in taxes on income and wealth of £3.8 billion and a fall in net other current transfers of £1.0 billion offset by an increase in gross operating surplus, and mixed income, the income of the self-employed, of £3.1 billion, an increase in wages and salaries of £6.9 billion and a rise in employer social contributions of £3.1 billion.
For a further explanation of how the saving ratio is calculated, please refer to the Things you need to know about this release section of this bulletin.
Back to table of contents4. Real households and non-profit institutions serving households (NPISH) disposable income (RHDI) fell
The level of real households and NPISH disposable income (RHDI) fell by 1.4% in Quarter 1 (Jan to Mar) 2017, following a decrease of 0.4% in the previous quarter. This represents 3 successive quarters of falling RHDI.
Figure 3: UK households and non-profit institutions serving households main quarterly gross disposable income components
Quarter 2 (Apr to June) 2013 to Quarter 1 (Jan to Mar) 2017
Source: Office for National Statistics
Notes:
- Q1 refers to Quarter 1 (Jan to Mar)
Q2 refers to Quarter 2 (Apr to June)
Q3 refers to Quarter 3 (July to Sept)
Q4 refers to Quarter 4 (Oct to Dec)
Download this chart Figure 3: UK households and non-profit institutions serving households main quarterly gross disposable income components
Image .csv .xlsThe fall in RHDI of 1.4% in Quarter 1 2017 was due to an fall in nominal gross disposable income of 0.9% together with a rise in the households and NPISH final consumption deflator of 0.5%.
The fall in nominal gross disposable income was due to a rise in taxes on income and wealth of £5.0 billion and falls in net social benefits other than transfers in kind of £0.9 billion and net other current transfers of £0.5 billion. This was partially offset by a rise in net property income of £2.4 billion, and a rise in wages and salaries of £1.2 billion (Figure 3).
Compared with the same quarter a year ago, Quarter 1 2016, RHDI fell by 1.4%. Gross disposable income increased by 0.4% and the deflator increased by 1.8%.
Real households and NPISH disposable income (RHDI) per head
We also measure RHDI on a per head basis to remove the effect of changes in the size of the population from RHDI growth.
In Quarter 1 2017, RHDI per head decreased by 1.6%, following a decrease of 0.6% in the previous quarter. There was a fall in gross disposable income per head in Quarter 1 2017 of 1.1%.
Figure 4: Real household and non-profit institutions serving households income per head, at chained volume measures
Quarter 1 (Jan to Mar) 2005 to Quarter 1 2017
Source: Office for National Statistics
Notes:
- Q1 refers to Quarter 1 (Jan to Mar)
Q2 refers to Quarter 2 (Apr to June)
Q3 refers to Quarter 3 (July to Sept)
Q4 refers to Quarter 4 (Oct to Dec)
Download this chart Figure 4: Real household and non-profit institutions serving households income per head, at chained volume measures
Image .csv .xlsFor an explanation of real households and NPISH disposable income, please refer to the Things you need to know about this release section of this bulletin.
Back to table of contents5. The increase in household debt was driven by consumer credit expansion and easier lending conditions in the mortgage market
Household debt has been increasing over recent years. Liabilities due to loans to the households and non-profit institutions serving households (NPISH) sector increased up until 2008, after which there was a period of stagnation. Since 2012, there has been a trend of renewed growth, with other short- and long-term loans increasing every quarter since Quarter 4 2013.
This has been attributed to the rapid expansion of consumer credit which, as noted by the Bank of England Financial Policy Committee, grew by 10.3% in the 12 months to April 2017. This growth in consumer credit is much larger than the weak growth in household incomes and has been identified as a risk by the Bank of England. The increase in consumer credit is due in particular to high rates of growth in dealership car finance, personal loans and credit card debt.
Lending conditions in the mortgage market have also become easier, leading to the increase in loans secured on dwellings.
Figure 5: UK households and non-profit institutions serving households financial liabilities, loans
Quarter 1 (Jan to Mar) 2005 to Quarter 1 (Jan to Mar) 2017
Source: Office for National Statistics
Notes:
- Q1 refers to Quarter 1 (Jan to Mar)
Q2 refers to Quarter 2 (Apr to June)
Q3 refers to Quarter 3 (July to Sept)
Q4 refers to Quarter 4 (Oct to Dec)
Download this chart Figure 5: UK households and non-profit institutions serving households financial liabilities, loans
Image .csv .xls6. Which sectors were net lenders or net borrowers?
Public corporations, private non-financial corporations and the rest of the world sectors were net lenders, meaning their total income exceeded total outgoings and theoretically, could lend to other sectors for Quarter 1 (Jan to Mar) 2017.
Financial corporations, central government, local government and households and non-profit institutions serving households (NPISH) were net borrowers for Quarter 1 2017 (Table 1).
On a quarterly basis, households and NPISH net borrowing of £17.5 billion in Quarter 1 2017 was the highest net borrowing recorded by the sector since comparable records began in 1987.
In Quarter 1 2017, central government net borrowing of £4.6 billion was the lowest net borrowing recorded by this sector since Quarter 1 2002, when it was £3.2 billion.
Table 1: Quarterly net lending (+) and net borrowing (-) by sector
| Quarter 4 (Oct to Dec) 2016 to Quarter 1 (Jan to Mar) 2017 | |||
| £ billion, current prices, seasonally adjusted | |||
| Q4 2016 | Q1 2017 | ||
| Households and NPISH | -11.1 | -17.5 | |
| Central government | -10.2 | -4.6 | |
| Local government | -2.2 | -2.9 | |
| Financial corporations | -3.9 | -2.6 | |
| Public corporations | 0 | 0.5 | |
| Private non-financial corporations | 19.1 | 14.5 | |
| Rest of the world | 13.4 | 17.3 | |
| Source: Office for National Statistics | |||
Download this table Table 1: Quarterly net lending (+) and net borrowing (-) by sector
.xls (3.3 MB)Households and NPISH
In Quarter 1 2017, households and NPISH net borrowing was £17.5 billion, following net borrowing of £11.1 billion in the previous quarter. As discussed earlier, this increase was due mainly to a rise in taxes on income and wealth of £5.0 billion and a rise in final consumption expenditure of £2.8 billion offset by a rise in net property income of £2.4 billion. Additionally, there was a rise in gross capital formation of £1.7 billion offset by a rise in compensation of employees of £1.5 billion.
Central government
In Quarter 1 2017, central government net borrowing was £4.6 billion, following net borrowing of £10.2 billion in the previous quarter (Figure 6). This is the lowest net borrowing since Quarter 1 2002 when it was £3.2 billion.
This decrease in net borrowing was because of rises in taxes on income and wealth receipts of £6.2 billion, a rise in net other current transfers of £2.9 billion and a fall in social benefits other than transfers in kind of £1.0 billion, partially offset by a fall in taxes on production of £2.5 billion, a fall in net property income of £1.5 billion and a rise in final consumption expenditure of £0.8 billion.
Historically, there is always increased revenue in taxes on income and wealth at Quarter 1, with Quarter 1 2017 being particularly strong due to increases in self-assessment due to higher self-employment and dividend forestalling. There were also increases in net Capital Gains Tax from equity and house price increases and higher bonus payments, mostly from the financial corporations sector.
Figure 6: Net borrowing for central government sector
Quarter 2 (Apr to June) 2013 to Quarter 1 (Jan to Mar) 2017
Source: Office for National Statistics
Notes:
- Q1 refers to Quarter 1 (Jan to Mar)
Q2 refers to Quarter 2 (Apr to June)
Q3 refers to Quarter 3 (July to Sept)
Q4 refers to Quarter 4 (Oct to Dec)
Download this chart Figure 6: Net borrowing for central government sector
Image .csv .xlsCompared with the same quarter a year ago, central government’s net borrowing has decreased from £12.8 billion in Quarter 1 2016 to £4.6 billion in Quarter 1 2017. This was due to an increase in VAT receipts of £1.4 billion, increases in taxes on income of £6.5 billion, increases in net social contributions of £3.8 billion, offset by a fall in net property income of £0.9 billion and a rise in final consumption expenditure of £1.8 billion.
Local government
In Quarter 1 2017, local government net borrowing was £2.9 billion, an increase in net borrowing of £0.7 billion compared with Quarter 4 (Oct to Dec) 2016. This increase in net borrowing was due mainly to a fall in net other current transfers of £0.9 billion and rise of gross capital formation of £0.2 billion, partially offset by a fall in final consumption expenditure of £0.3 billion and other small changes throughout the accounts.
Financial corporations
In Quarter 1 2017, financial corporations’ net borrowing was £2.6 billion, following net borrowing of £3.9 billion in the previous quarter. This decrease in net borrowing was due mostly to rises in net property income of £2.4 billion and gross operating surplus of £1.1 billion, partially offset by a rise in gross capital fixed formation of £0.9 billion, a fall in net other transfers of £0.7 billion and a rise in taxes on income and wealth of £0.6 billion.
Public corporations
In Quarter 1 2017, public corporations’ net lending was £0.5 billion, following net lending of £48 million in the previous quarter. This switch to net lending was due mainly to a fall in acquisitions less disposals of non-produced non-financial assets of £0.4 billion and a rise of gross operating surplus of £0.1 billion offset by small changes in the accounts.
Private non-financial corporations (PNFCs)
In Quarter 1 2017, PNFCs’ net lending was £14.5 billion, following net lending of £19.1 billion in the previous quarter. This decreased net lending was due mainly to a fall in net property income of £5.2 billion, a rise in gross capital formation of £1.8 billion and a rise in taxes on income of £0.6 billion and partially offset by a rise in gross operating surplus of £3.1 billion (Figure 7).
Figure 7: Contributions to the change of net lending and borrowing for private non-financial corporations
Quarter 2 (Apr to June) 2013 to Quarter 1 (Jan to Mar) 2017
Source: Office for National Statistics
Download this chart Figure 7: Contributions to the change of net lending and borrowing for private non-financial corporations
Image .csv .xlsIn Quarter 1 2017 compared with the same quarter a year ago, Quarter 1 2016, the net lending position for PNFCs increased by £9.5 billion due to an increase in gross operating surplus of £7.0 billion and an increase in net property income of £5.7 billion which was partly offset by increases in taxes on income and wealth paid of £2.1 billion and gross capital formation of £1.6 billion.
Rest of the world
In Quarter 1 2017, rest of the world net lending was £17.3 billion, following net lending of £13.5 billion in the previous quarter. This was due mainly to an increase in the external balances of goods and services of £4.0 billion and an increase in net property income of £1.9 billion, partially offset by a fall in net capital transfers of £1.3 billion and a fall in net other current transfers of £0.9 billion.
Further details of the UK Balance of Payments position can be found in the Balance of Payments bulletin.
Back to table of contents8. Upcoming changes to this bulletin
This Quarterly sector accounts bulletin is currently the subject of a review by the Office for Statistics Regulation to determine its designation as a National Statistic. National Statistics are produced to high professional standards set out in the Code of Practice for Official Statistics. They undergo regular quality assurance reviews to ensure that they meet customer needs. They are produced free from any political interference.
From 29 September 2017, this bulletin and its associated dataset, the UK Economic Accounts, will present separate estimates for the households sector and the non-profit institutions serving households (NPISH) sector. Currently, these two sectors are presented as though they are one sector, households and NPISH. More detailed analysis of these sectors will therefore be possible. This work is part of the scope of methodological improvements being introduced as part of “UK National Accounts: The Blue Book, 2017 edition” due to be published on 31 October 2017.
We published an article on 5 June 2017 to inform users of the indicative impact to the main non-financial and financial account estimates being introduced when revised figures for the UK National Accounts are published on 29 September 2017. We will be publishing a further update article on 21 August 2017, which will provide the indicative impact up to 2015 for the main non-financial and financial account estimates.
Back to table of contents9. Quality and methodology
We are currently developing the Quarterly sector accounts bulletin Quality and Methodology Information document. This will be published shortly and will contain important information on:
the strengths and limitations of the data and how it compares with related data
uses and users of the data
how the output was created
the quality of the output including the accuracy of the data
The Quarterly sector accounts and the UK Economic Accounts are published at quarterly, pre-announced intervals alongside the Quarterly National Accounts and Quarterly Balance of Payments statistical bulletins.
Back to table of contents