Table of contents
- Main points
- Statistician’s comment
- Summary
- The Quarterly National Accounts show that the UK economy grew by 0.2% in Quarter 1 2017, unrevised from the second estimate
- Household saving ratio falls to a new record low
- UK current account deficit widens slightly in Quarter 1 2017
- On a 3-month on 3-month basis, production output fell, the trade balance widened but new orders in construction grew in Quarter 1 2017 compared with Quarter 4 2016
- April 2017 saw a small increase in the 3-month on 3-month growth rate for services output following 5 months of slowdown
- CPI grew faster than CPIH in April and May 2017, due to housing costs growing more slowly than other prices
- A range of goods have been contributing to 12-month growth in CPIH while the contribution from services prices has been more stable
- UK economy continues to add full-time jobs in the 3 months ending April 2017
- Total real wage growth turns negative
1. Main points
- Within the 0.2% growth in gross domestic product (GDP) in Quarter 1 (Jan to Mar) 2017, which is unrevised from the second estimate of GDP, private consumption was a smaller contributor to growth than in recent periods.
- The household saving ratio, although volatile, has been declining since Quarter 3 (July to Sept) 2015 and has reached a record low of 1.7% in Quarter 1 2017.
- Goods prices generally contribute most to the movement of the Consumer Prices Index including owner-occupiers’ housing costs (CPIH), while the contribution from services is more stable.
- The employment rate is at a joint record high of 74.8% with an increase in the share of full-time jobs in the economy.
- Rates of unemployment by duration are at or below their 2002 to 2007 long-term averages.
- Total real wages (including bonus payments) fell for the first time since July 2014.
2. Statistician’s comment
Commenting on today’s figures, ONS head of GDP Darren Morgan said:
“Gross domestic product (GDP) growth for the first 3 months of 2017 remained unrevised at 0.2%. Growth was driven by business services and construction, partially offset by declines in some consumer-focused industries, such as retail sales and accommodation.
“The saving ratio has fallen again this quarter to a new record low, partly as a result of higher tax payments reducing disposable income. Some of the fall could be as a result of the timing of those payments, but the underlying trend is for a continued fall in the saving ratio.
“Services output in April 2017 was up slightly on the month, with the largest contribution to the month-on-month growth coming from the retail trade.”
Back to table of contents3. Summary
The latest quarterly estimate for economic growth is below its average of 0.5% since the start of 2010, although the rate of growth of 2.0% between Quarter 1 (Jan to Mar) 2017 and the same quarter a year ago remains relatively strong.
Monthly services growth remains slightly positive, but the production and construction sectors have seen some contraction in the 3 months to April 2017 compared with the 3 months to January 2017. The labour market continues to perform well in terms of numbers of jobs and the share of full-time employment but nominal wage growth is not keeping pace with consumer price inflation. The household saving ratio is at a historic low and owner occupiers’ housing costs (OOH) are causing a downward drag on the Consumer Prices Index including owner-occupiers’ housing costs (CPIH) measure of inflation, while prices across services and most goods continue to rise.
More detailed theme day economic commentary is available for:
Back to table of contents4. The Quarterly National Accounts show that the UK economy grew by 0.2% in Quarter 1 2017, unrevised from the second estimate
The Quarterly National Accounts (QNA) indicated that the UK economy grew by 0.2% in Quarter 1 (Jan to Mar) 2017 and by 2.0% when compared with the same quarter of the previous year (see Figure 1). The quarterly reading is weaker than in recent periods with quarterly gross domestic product (GDP) growth averaging 0.5% since the start of 2010.
Figure 1: GDP growth, quarter-on-quarter and quarter on previous year's quarter growth rate
UK, Quarter 1 (Jan to Mar) 2008 to Quarter 1 2017
Source: Office for National Statistics
Notes:
- Q1 refers to Quarter 1 (Jan to Mar), Q2 refers to Quarter 2 (Apr to June), Q3 refers to Quarter 3 (July to Sept), and Q4 refers to Quarter 4 (Oct to Dec).
Download this chart Figure 1: GDP growth, quarter-on-quarter and quarter on previous year's quarter growth rate
Image .csv .xlsGrowth in household consumption weakens in Quarter 1 2017, while growth in business investment recovers from recent lows
The QNA provide greater information on the expenditure and income measures of GDP compared with the second estimate of GDP published on 25 May 2017. By expenditure category, household final consumption expenditure increased by 0.4% in Quarter 1 2017 and by 2.6% when compared with the same quarter of the previous year. The deceleration from 2016 growth rates meant that private consumption was a smaller contributor to GDP growth than in recent periods.
In contrast to consumption, gross fixed capital formation (GFCF) grew by 2.0% in Quarter 1 2017 compared with the same quarter of the previous year, the strongest rate of growth since Quarter 4 (Oct to Dec) 2015.
Net trade subtracted 0.2 percentage points from GDP growth on a quarter-on-same-quarter a year ago basis, the smallest subtraction since Quarter 2 (Apr to June) 2016 (Figure 2).
Figure 2: Contributions to GDP growth, expenditure components, quarter on same quarter of previous year, chained volume measure
UK, Quarter 1 (Jan to Mar) 2014 to Quarter 1 2017
Source: Office for National Statistics
Notes:
- Contributions to GDP growth do not sum to the total because the statistical discrepancy is not displayed.
- Q1 refers to Quarter 1 (Jan to Mar), Q2 refers to Quarter 2 (Apr to June), Q3 refers to Quarter 3 (July to Sept), and Q4 refers to Quarter 4 (Oct to Dec).
Download this chart Figure 2: Contributions to GDP growth, expenditure components, quarter on same quarter of previous year, chained volume measure
Image .csv .xlsOn the household side, durable goods consumption increased by 1.9% in Quarter 1 2017, the strongest quarterly increase since Quarter 1 2016. In contrast, non-durable goods consumption decreased by 1.4% in the quarter, partially unwinding a strong increase in the previous quarter. Consumption of services increased by 0.8% in Quarter 1 2017, at the higher end of recent quarterly growth outcomes.
On the business side, Figure 3 shows the components of GFCF growth on a quarter-on-same-quarter a year ago basis. The primary drivers of the increased growth in Quarter 1 2017 were business investment, which contributed 0.4 percentage points, up from negative 0.5 percentage points in Quarter 4 2016, and private sector dwellings, the contribution of which increased from 0.5 percentage points to 0.8 percentage points. In addition, investment by general government has been a driver of GFCF growth in recent quarters, contributing 0.8, 1.1 and 1.0 percentage points in Quarter 3 (July to Sept)2016, Quarter 4 2016 and Quarter 1 2017 respectively.
Investment in private sector dwellings grew by 4.0% and is reflected in GFCF growth on an asset basis. In Quarter 1 2017, the majority of growth came from dwellings and other buildings and structures (1.5 percentage points in total) due to growth of 3.9% and 2.3% respectively. Investment in dwellings on both a sector and asset basis was also relatively strong on a quarter-on-quarter basis.
Figure 3: Contributions to gross fixed capital formation (GFCF) growth by sector, quarter on same quarter of previous year, chain volume measure, seasonally adjusted
Quarter 1 (Jan to Mar) 2014 to Quarter 1 2017
Source: Office for National Statistics
Notes:
- Contributions may not sum to totals due to rounding.
- Q1 refers to Quarter 1 (Jan to Mar), Q2 refers to Quarter 2 (Apr to June), Q3 refers to Quarter 3 (July to Sept), and Q4 refers to Quarter 4 (Oct to Dec).
Download this chart Figure 3: Contributions to gross fixed capital formation (GFCF) growth by sector, quarter on same quarter of previous year, chain volume measure, seasonally adjusted
Image .csv .xls5. Household saving ratio falls to a new record low
The Quarterly sector and financial accounts published on 30 June 2017 provides further information about the UK economy and includes the household and non-profit institutions serving households (NPISH) saving ratio. The saving ratio can be volatile because gross saving is a small difference between two numbers - total resources and final consumption expenditure. Looking through the volatility, the household saving ratio has been declining since Quarter 3 (July to Sept) 2015, with the latest period showing that the household saving ratio fell from 3.3% in Quarter 4 (Oct to Dec) 2016 to 1.7% in Quarter 1 (Jan to Mar) 2017. This is the lowest saving ratio on record (Figure 4).
The decline in the household saving ratio in Quarter 1 2017 is partly due to an increase in taxes on income, though this may in part reflect timing issues. However, the underlying trend is downwards, reflecting relatively strong consumption volumes, increasing consumer prices and subdued wage growth.
Figure 4: UK final consumption expenditure, total available resources, gross saving and saving ratio, seasonally adjusted
UK, Quarter 1 (Jan to Mar) 2005 to Quarter 1 2017

Source: Office for National Statistics
Notes:
- Total available household resources equals gross disposable income plus adjustment for the change in pension entitlements.
- Saving ratio equals gross saving (total resources minus final consumption expenditure) divided by total resources.
Download this image Figure 4: UK final consumption expenditure, total available resources, gross saving and saving ratio, seasonally adjusted
.png (23.0 kB) .xls (72.7 kB)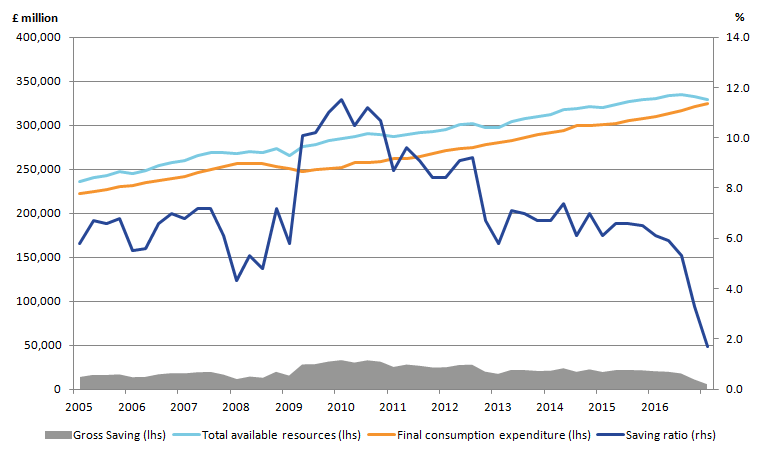
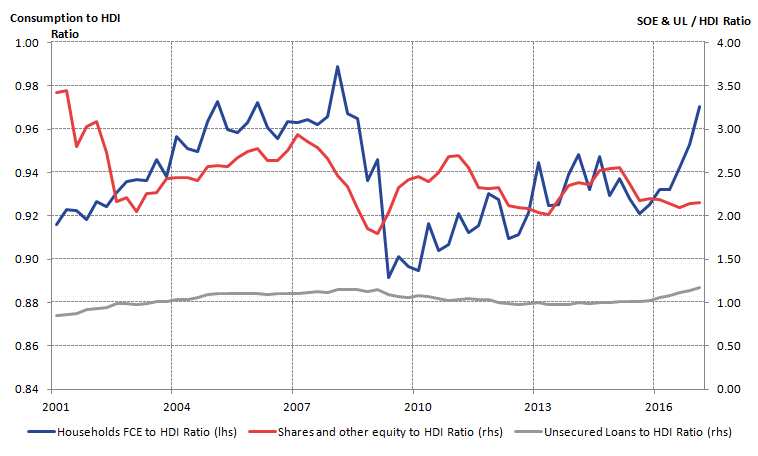
Households can consume out of current income, out of accumulated wealth, or by borrowing against future income. Figure 5 characterises this decision by showing the ratio of household consumption expenditure (HCE), shares and other equity (SOE) and unsecured loans (UL) to household disposable income (HDI).
Figure 5: UK household consumption expenditure to household disposable income (HDI), shares and other equity to HDI and unsecured loans to HDI ratio
UK, Quarter 1 (Jan to Mar) 2001 to Quarter 1 2017
Source: Office for National Statistics
Download this image Figure 5: UK household consumption expenditure to household disposable income (HDI), shares and other equity to HDI and unsecured loans to HDI ratio
.png (34.4 kB) .xls (68.1 kB)
The pre-downturn period (2001 to 2007) saw a rise in the household consumption expenditure ratio (household consumption divided by household disposable income), increasing from 0.92 to 0.97 between Quarter 1 2001 and Quarter 4 2007, as household consumption expenditure grew faster than household disposable income. This shortfall between household consumption and disposable income was partly satisfied by unsecured borrowing (which grew by 8.4% each quarter on average), drawing down savings and returns from shares and other equity.
Between Quarter 1 2008 and Quarter 1 2010, the household consumption expenditure ratio fell to a low of 0.89, as households behaved more cautiously against the backdrop of the global financial crisis.
More recently, the household consumption expenditure ratio has increased sharply to 0.97 in Quarter 1 2017, just below the peak of 0.99 in Quarter 1 2008. Since mid-2015, the ratio of shares and other equity to household disposable income has remained relatively stable, while the ratio of unsecured loans to household disposable income has increased by around 15%.
The fall in the household saving ratio is mirrored in the net lending and net borrowing data. Figure 6 shows the net lending and net borrowing position of the different sectors of the UK economy and highlights that in Quarter 1 2017, the household and non-profit institutions serving households (NPISH) sector continued to be a net borrower. In Quarter 1 2017, the public sector and financial corporations were also net borrowers, although public sector net borrowing as a share of nominal gross domestic product (GDP) has declined to its lowest since 2002.
Figure 6: Net lending and net borrowing by sector as a percentage of nominal GDP
UK, Quarter 1 (Jan to Mar) 2014 to Quarter 1 2017
Source: Office for National Statistics
Notes:
- Q1 refers to Quarter 1 (Jan to Mar), Q2 refers to Quarter 2 (Apr to June), Q3 refers to Quarter 3 (July to Sept), and Q4 refers to Quarter 4 (Oct to Dec).
Download this chart Figure 6: Net lending and net borrowing by sector as a percentage of nominal GDP
Image .csv .xls6. UK current account deficit widens slightly in Quarter 1 2017
The UK’s current account deficit as a percentage of gross domestic product (GDP) increased slightly to 3.4% in Quarter 1 (Jan to Mar) 2017. The latest Balance of Payments publication shows that the widening in the current account deficit reflected a widening in the trade and primary income deficits in the quarter. Compared with recent quarters, the current account deficit is relatively small, but Figure 7 shows the longer-term trend in the deficit, as well as a comparison with other G7 countries.
Figure 7: Current account balance as a percentage of GDP for the G7
UK, Quarter 1 (Jan to Mar) 2003 to Quarter 1 2017
Source: Office for National Statistics and Organisation for Economic Co-operation and Development (OECD)
Notes:
- UK, US and Canada are the only countries which have data available for Quarter 1 (Jan to Mar) 2017. The latest data point for the remaining countries is Quarter 4 (Sept to Dec) 2016.
Download this chart Figure 7: Current account balance as a percentage of GDP for the G7
Image .csv .xlsThe UK current account balance has been deteriorating over time, with the quarterly deficit increasing from 1.8% of GDP (2003 to 2007), second only to the US (5.2%), to 4.4% between 2013 and 2017. This is the highest average quarterly deficit in the G7.
The widening of the UK current account deficit over the period has been mainly driven by the increasing deficit in the trade in goods account, alongside a fall in investment income from UK assets abroad in the primary income account. This decline in the primary income account can be partly attributed to the fall in investment income from the EU, with income earned from EU-owned assets in the UK providing a higher return than income earned from UK-owned assets in the EU. This may have been down to the relatively strong GDP growth rate the UK has been experiencing over the period, compared with several countries in the EU.
Back to table of contents7. On a 3-month on 3-month basis, production output fell, the trade balance widened but new orders in construction grew in Quarter 1 2017 compared with Quarter 4 2016
Production
April 2017 saw a 0.2% monthly increase in total production output, following 3 consecutive monthly falls. The growth was due to rises in energy supply and manufacturing by 2.9% and 0.2% respectively. The largest contributor to the rise in manufacturing was a 1.6% increase in transport equipment, which contributed 0.2 percentage points towards growth.
Following high levels of production output in the 3 months to January 2017, total production output fell by 1.2% on a 3-month on 3-month basis due to falls of 5.8% in energy supply and 0.7% in manufacturing. The main cause of the fall was the volatile pharmaceuticals sectors, which saw an 11.9% contraction following an increase of 10.1% in the 3 months to January 2017.
Trade
The overall UK trade deficit (goods and services) narrowed by £1.8 billion in April 2017 to £2.1 billion, following a widening in March 2017. The narrowing was attributed to a decrease in imports of goods in the month as they moved back to levels seen in January and February 2017 from high levels in March 2017. Mechanical machinery, oil and cars saw the largest falls in imports between March and April 2017, following increase in imports in these commodities in March 2017.
Movements in sterling continue to have an impact on trade prices with goods export and import prices decreasing by 1.1% and 0.9% respectively in April 2017 compared with March 2017. This coincided with sterling appreciation of 2.2% in April 2017 against a basket of currencies (Sterling Exchange Rate Index). Compared with April 2016, the value of sterling remains 7.7% lower as goods export and import prices have risen by 9.3% and 8.4% respectively – as a result, the UK’s terms of trade have improved.
The total trade deficit widened by £1.7 billion to £8.6 billion in the 3 months to April 2017, following a narrowing in the 3 months to January 2017. The main causes of the widening in the 3 months to April 2017 were increased imports of aircraft, cars and chemicals, and a fall in the export of services.
Construction
Construction output fell by 1.6% on a monthly basis in April 2017 – driven by falls in both repair and maintenance (negative 1.0%), and all new work (negative 1.8%) – following growth of 0.7% in March (revised up from negative 0.7%).
Output fell by 0.6% in both the 3-month on 3-month and month-on-previous-year time series in April 2017. The driver of the 3-month on 3-month fall was a 0.9% fall in all new work and the month-on-previous-year fall was driven by a 2.5% fall in all repair and maintenance.
New orders data for Quarter 1 (Jan to Mar) 2017 saw an increase of 0.7% following 2 quarters of decline – showing signs of strength in the sector. New orders are seen as a leading indicator of construction output volumes as they measure the value of new (legally binding) contracts for future construction work.
Back to table of contents8. April 2017 saw a small increase in the 3-month on 3-month growth rate for services output following 5 months of slowdown
On a monthly basis, total services output saw a 0.2% rise in April 2017 following a 0.3% rise in March 2017. The main driver of growth in April 2017 was the distribution, hotels and restaurants sector, which grew by 1.1%, contributing 0.2 percentage points towards the monthly growth. The main driver within this sector was the sub-sector retail trade, except motor vehicles and motorcycles, which contributed 0.2 percentage points towards total services growth. The business services and finance sector saw a 0.2% growth, which contributed 0.1 percentage points towards monthly growth.
Contributing towards downward pressure was transport, storage and communication, which saw a 0.7% contraction month-on-month – contributing negative 0.1 percentage points towards total services growth. Similar to February and March 2017, government and other services has remained virtually flat this month.
Figure 8 shows the 3-month average index of the selected components of total services. Following five consecutive periods of slowdown in 3-month on 3-month total services output growth, from 1.0% in October 2016, April 2017 saw a rise in growth to 0.2% from 0.1% in March 2017. Driving the 3-month on 3-month services output was a 0.3% growth in business services and finance, which contributed 0.1 percentage points towards total services output. This sector has seen positive 3-month on 3-month growth since October 2011.
Figure 8: Index of Services by selected components and total services, 3-month average
UK, January 2010 to April 2017
Source: Office for National Statistics
Download this chart Figure 8: Index of Services by selected components and total services, 3-month average
Image .csv .xls9. CPI grew faster than CPIH in April and May 2017, due to housing costs growing more slowly than other prices
Figure 9 shows the 12-month growth rates for the Consumer Prices Index (CPI), Consumer Prices Index including owner-occupiers’ housing costs (CPIH), owner occupiers’ housing costs (OOH) and the Index for Private Housing Rental Prices (IPHRP) from January 2014 to May 2017. Over this period, CPI annual growth rates have been both above and below CPIH annual growth rates. The condition for the order of these growth rates is related to the relative growth rate for owner-occupiers’ housing costs compared with the rest of the CPI basket.
From Figure 9 it can be seen that between January and July 2014, CPI experienced higher growth than OOH, leading to CPI growing faster than CPIH. From August 2014 onwards, this situation was reversed with growth in OOH exceeding CPI. This, in turn, caused the rate of growth in CPIH to increase more quickly than the rate for CPI. Since OOH accounts for approximately 17% of the CPIH basket of goods and services, it is the main cause of differences between CPI and CPIH.
Figure 9: CPI, CPIH, OOH component and IPHRP 12-month growth rates
UK, January 2014 to May 2017
Source: Office for National Statistics
Notes:
- CPIH has been re-assessed to evaluate the extent to which it meets the professional standards set out in the Code of Practice for Official Statistics. The assessment report includes a number of requirements that need to be implemented for CPIH to regain its status as a National Statistic and we are working to address these.
Download this chart Figure 9: CPI, CPIH, OOH component and IPHRP 12-month growth rates
Image .csv .xlsFrom November 2016, the annual growth rates for CPI and CPIH began to converge as growth in owner occupiers’ housing costs began to slow. The 12-month growth rate for CPI and CPIH were identical in February and March 2017. From April 2017, the rate of CPI growth has been stronger than the growth rate for CPIH as OOH growth continued to slow.
Figure 9 also shows the rate of growth of the Index of Private Housing Rental Prices (IPHRP), which measures the change in price of renting a property from private landlords. There is a relationship between the change in IPHRP and OOH due to the fact that the rental equivalence approach of calculating OOH includes imputed rents. Between 2014 and January 2015, IPHRP and OOH had been growing at similar rates. However, the rate of growth in rental prices surpassed that for owner occupiers’ housing costs during 2015, which was largely the result of higher rental price growth in London.
More recently, however, growth in rental prices and owner occupiers’ housing costs has slowed with the annual growth in IPHRP for May 2017 at 1.8%, a fall of 0.7 percentage points from May 2016.
Back to table of contents10. A range of goods have been contributing to 12-month growth in CPIH while the contribution from services prices has been more stable
Figure 10 shows the headline Consumer Prices Index including owner-occupiers’ housing costs (CPIH) rate and the contributions made to CPIH by goods and services each month from January 2006. Services have made a relatively consistent contribution to headline CPIH over the period with its contribution always being positive and ranging from 0.8% and 2.2%.
The contribution to CPIH from goods prices meanwhile has been more variable ranging from negative 1.0% to 2.5% and accounting for most of the volatility seen in the headline CPIH growth rate over the period.
Figure 10: Contributions to the 12-month growth rate of CPIH by goods and services
UK, January 2006 to May 2017
Source: Office for National Statistics
Notes:
- The contributions to growth may not sum due to rounding.
Download this chart Figure 10: Contributions to the 12-month growth rate of CPIH by goods and services
Image .csv .xlsThe majority of the “service” components of CPIH have relatively low levels of direct import penetration, with only two components – “cultural services” and “telephone and telefax equipment and services” – having import penetration above 10%. The “goods” components of CPIH are relatively more import intensive with almost half of the components having direct import penetration above 30%.
Goods price inflation
Figure 11 shows price indices for several class-level categories within CPIH and aggregate categories for “all services” and “all goods” over the period since January 2015. The swathe denotes the range of indices each month showing the maximum and minimum values regardless of category. Prices are indexed to January 2015.
Figure 11: Selected class-level categories of CPIH, all services and all goods.
UK, January 2015 to May 2017

Source: Office for National Statistics
Download this image Figure 11: Selected class-level categories of CPIH, all services and all goods.
.png (39.3 kB) .xls (33.3 kB)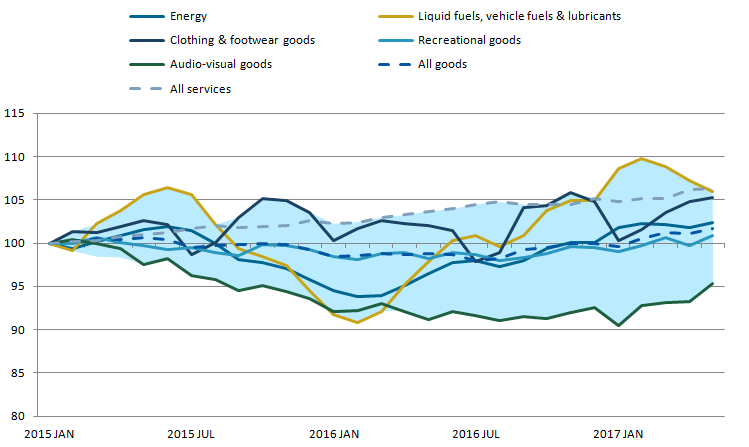
Prices for services have been growing relatively consistently over the period since January 2015 and remain at the higher end of the swathe of prices. While the aggregate “all goods” category has shown relatively modest changes from the January 2015 level, the individual components show considerably more volatility.
Of particular note is the category “liquid fuels, vehicle fuels and lubricants”, which has been at both the maximum and minimum of the range of prices more than once over the period and is currently towards the top of the range. The “clothing and footwear goods” category has also been volatile, though for the most part has been above the “all goods” aggregate category and remains towards the top of the range this month.
“Audio-visual goods” have consistently been at or near the bottom of the range and remain the lowest this month, but have nonetheless been increasing since January 2017. The Consumer Prices Inflation bulletin for May 2017 noted that a variety of recreational and cultural goods had the largest upward effect on CPIH this month, rising by 0.9% between April and May 2017.
Back to table of contents11. UK economy continues to add full-time jobs in the 3 months ending April 2017
The number of people in work increased by 109,000 to 31.95 million in the 3 months to April 2017 compared with the previous 3 months, with an increase in full-time employment (162,000) partly offset by a fall in part-time employment (53,000) (Figure 12). The employment rate reached a joint record high of 74.8%.
Figure 12: Quarterly change in employment (thousands)
UK, February to April 2009 and February to April 2017
Source: Office for National Statistics
Download this chart Figure 12: Quarterly change in employment (thousands)
Image .csv .xlsOther indicators of labour market activity were relatively stable in the 3 months ending April 2017. Average hours worked per week decreased slightly from 32.3 to 32.2 compared with the previous 3 months. Similarly, the number of vacancies remained close to a record high in the 3 months to May 2017, while the number of unemployed people per vacancy fell to 2.0 in the 3 months to April 2017, the equal lowest on record.
The unemployment rate was 4.6% in the 3 months ending April 2017, down from 5.0% a year earlier. Consistent with recent periods, the fall in the unemployment rate compared with a year ago reflects an increase in the employment rate (from 74.2% to 74.8%) alongside a largely unchanged participation rate (the proportion of people aged 16 and over who were economically active).
Compared with the over-16s’ participation rate, the headline economic activity rate features only those aged 16 to 64 and is now 78.5%, the equal highest since records began in 1971. Since mid-2011, the economic activity rate has exhibited an increasing trend.
Unemployment by duration
Figure 13 shows unemployment by duration. Long-term unemployment, as a share of the economically active, remained at 1.2% in the 3 months to April 2017, close to its pre-crisis average of 1.1%. Short-term unemployment as a percentage of the economically active continued to decline and is now at 2.7%, below its pre-crisis average level of 3.2%.
Figure 13: Unemployment as a percentage of economically active, by duration
UK, seasonally adjusted, February to April 1993 and February to April 2017

Source: Office for National Statistics
Notes:
- Average unemployment rate given in the dotted lines are for the period 2002 to 2007.
Download this image Figure 13: Unemployment as a percentage of economically active, by duration
.png (35.4 kB) .xls (43.5 kB)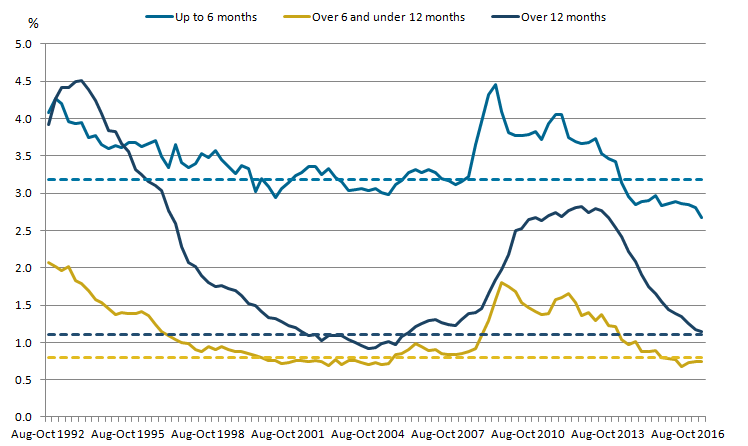
12. Total real wage growth turns negative
Regular weekly earnings for employees (excluding bonuses) increased by 1.7% in the 3 months to April 2017 compared with a year earlier, while total average weekly earnings (including bonuses) grew by 2.1% compared with a year earlier.
Adjusted for inflation, average weekly earnings decreased by 0.4% including bonuses and by 0.6% excluding bonuses in the 3 months to April 2017, compared with the same period a year earlier (Figure 14). This is the first annual decline in real total average weekly earnings since 2014. Real average weekly earnings fell by 0.5% in the private sector and by 1.2% in the public sector.