Table of contents
- Main points
- Statistician’s comment
- Summary
- The preliminary estimate of GDP shows that the UK economy grew by 0.1% in Quarter 1 2018
- Growth in services output slows to 0.3% in Quarter 1 2018
- Production output increases by 0.7% in Quarter 1 2018, despite slowing growth in manufacturing
- Construction output declines by 3.3% in Quarter 1 2018, the sharpest fall since Quarter 2 2012
- Real time analysis of the effects of heavy snow in Quarter 4 2010
- Growth in CPIH fell to 2.3% in March 2018
- The unemployment rate fell to 4.2% in the three months to February 2018
1. Main points
The preliminary estimate of gross domestic product (GDP) shows that the UK economy grew by 0.1% in Quarter 1 (Jan to Mar) 2018, the weakest quarterly growth since Quarter 4 (Oct to Dec) 2012.
The weak growth in Quarter 1 2018 was driven by a sharp fall in construction output and a sluggish manufacturing sector, while growth in services also slowed.
Today’s figures suggest that the overall impact from the recent snow and adverse weather conditions across the UK was relatively small.
Growth in the Consumer Prices Index including owner occupiers’ housing costs (CPIH) fell to 2.3% in March 2018, while growth in output Producer Price Index (PPI) fell to 2.4% and growth in input PPI rose to 4.2%.
The unemployment rate was at its lowest since 1975, at 4.2% in the three months to February 2018.
2. Statistician’s comment
Commenting on today’s gross domestic product figures, Rob Kent-Smith of the Office for National Statistics said:
“Our initial estimate shows the UK economy growing at its slowest pace in more than five years, with weaker manufacturing growth, subdued consumer-facing industries and construction output falling significantly.
“While the snow had some impact on the economy, particularly in construction and some areas of retail, its overall effect was limited with the bad weather actually boosting energy supply and online sales.”
Back to table of contents3. Summary
The UK economy grew by 0.1% in Quarter 1 (Jan to Mar) 2018, marking the weakest quarterly growth since Quarter 4 (Oct to Dec) 2012. The weakness in Quarter 1 2018 was driven by a sharp decline in construction output and a sluggish manufacturing sector, while growth in the services industry also slowed.
While today’s figures suggest that recent heavy snow had a negative impact on some areas of the economy, such as construction and parts of retail trade, the overall impact of adverse weather conditions on output in Quarter 1 2018 was relatively small.
The 12-month growth rate for the Consumer Prices Index including owner occupiers’ housing costs (CPIH) fell to 2.3% in March 2018; the change was driven mainly by the clothing and footwear, and alcoholic beverages and tobacco categories. In February 2018, the latest month for which data are available, the 12-month growth rate for house prices in London fell to negative 1.0%, its first month of annual contraction since September 2009, continuing a recent broad trend of slowdown that started in 2014.
The unemployment rate was at 4.2% in the three months to February 2018, a record low since 1975. The employment rate was at a record high in December 2017 to February 2018, at 75.4%. There has been an increase since the economic downturn in the responsiveness of employment to economic growth. Industries with high employment intensity of growth help contribute to the growing employment and low unemployment.
More detailed theme day economic commentary is available for:
Back to table of contents4. The preliminary estimate of GDP shows that the UK economy grew by 0.1% in Quarter 1 2018
Today’s gross domestic product (GDP) release contains new information regarding UK economic growth in Quarter 1 (Jan to Mar) 2018. Within this release is an early indication of output growth in production, construction and services in March 2018. In addition, data on services output in February 2018 have been published.
The preliminary estimate of GDP shows that the UK economy grew by 0.1% in Quarter 1 2018, the weakest quarterly growth since Quarter 4 (Oct to Dec) 2012. The weak outcome in Quarter 4 2012 largely reflected an unwinding of the Olympic effect, which had boosted growth in Quarter 3 (July to Sept) 2012 (Figure 1).
The preliminary estimate of GDP for Quarter 1 2018 was also below the latest published external GDP forecasts, with estimates from the Bank of England and the National Institute of Economic and Social Research (NIESR) ranging between 0.2% and 0.3%. These external estimates for Quarter 1 2018 incorporate judgements on the effect of the severe weather in March and are also in line with the latest market expectation for GDP growth of 0.3%. Compared with the same quarter a year ago, the economy has grown by 1.2% – well below its five-year average of 2.2% and the slowest rate since Quarter 2 (Apr to June) 2012 (Figure 1).
Figure 1: Gross domestic product growth, quarter-on-quarter and quarter on same quarter a year ago growth rate
UK, Quarter 1 (Jan to Mar) 2008 to Quarter 1 2018
Source: Office for National Statistics
Notes:
- Q1 refers to Quarter 1 (Jan to Mar), Q2 refers to Quarter 2 (Apr to June), Q3 refers to Quarter 3 (July to Sept), and Q4 refers to Quarter 4 (Oct to Dec).
Download this chart Figure 1: Gross domestic product growth, quarter-on-quarter and quarter on same quarter a year ago growth rate
Image .csv .xlsThe weak growth in Quarter 1 2018 primarily reflects a sharp 3.3% decline in construction output and softer services growth of 0.3% (Figure 2). Growth in manufacturing output also slowed in the quarter, with the 0.7% growth in total production buoyed by temporary factors, such as the rebound in mining and quarrying following the Forties shutdown in December 2017 and the cold weather boost to energy supply.
Today’s figures are subject to increased uncertainty, with measurement of economic activity in Quarter 1 2018 affected by factors such as recent adverse weather conditions and the timing of the Easter weekend – which, unusually, fell across both March and April in 2018. This complicates how seasonal adjustment is applied as it has only occurred four times in the past three decades.
Additionally, the preliminary estimate of GDP is based on information that only relates to the output measure and is constructed on data content of around 45% for that quarter. Information for the final month of the reference quarter is largely forecasted or imputed and, as some of the snow fell in this third month, this contributes to the increased uncertainty.
Our returns from businesses showed evidence that the snow had an adverse impact on some sectors, such as construction and retail sales of fuel, in part offset by a boost to online retailing and energy supply. As the snow fell before the end of the quarter, it is possible that some lost output during the period of the bad weather was displaced to a later period. Therefore, the overall snow impact on output in Quarter 1 2018 is estimated to be relatively small, making it difficult to quantify – the soft GDP outcome reflects pockets of weakness more broadly across the economy.
More information has been published today (27 April 2018) on the changes to how GDP will be published in the UK from July 2018, which includes details on how the new first estimate of GDP will improve the trade-off between timeliness and accuracy. There will be a higher data content for the third month of the quarter, increasing the scope to pick up the effects of a sharp change in activity that takes place in that month and reducing the scope for further revision than under the current model.
Figure 2: Contributions to growth in output gross value added by sector
UK, Quarter 1 (Jan to Mar) 2016 to Quarter 1 2018
Source: Office for National Statistics
Notes:
Q1 refers to Quarter 1 (Jan to Mar) Q2 refers to Quarter 2 (Apr to Jun) Q3 refers to Quarter 3 (Jul to Sep) Q4 refers to Quarter 4 (Oct to Dec).
Components may not sum due to rounding.
Download this chart Figure 2: Contributions to growth in output gross value added by sector
Image .csv .xls5. Growth in services output slows to 0.3% in Quarter 1 2018
Services growth slowed in Quarter 1 (Jan to Mar) 2018, with output increasing by 0.3% following growth of 0.4% in Quarter 4 (Oct to Dec) 2017 (Figure 3). Services growth has been relatively subdued since Quarter 1 2017, with the latest growth outcome in line with average quarterly growth seen in the sector throughout 2017. While some recent surveys, such as the IHS Markit Services Purchasing Managers’ Index (PMI), indicate that the sector had been significantly affected by snow-related disruptions in March 2018, today’s figures suggest that the adverse weather conditions had little overall impact on services output in Quarter 1 2018.
Figure 3: Growth in total services output and industry contributions
UK, Quarter 1 (Jan to Mar) 2015 to Quarter 1 2018
Source: Office for National Statistics
Notes:
- Q1 refers to Quarter 1 (Jan to Mar), Q2 refers to Quarter 2 (Apr to June), Q3 refers to Quarter 3 (July to Sept), and Q4 refers to Quarter 4 (Oct to Dec).
Download this chart Figure 3: Growth in total services output and industry contributions
Image .csv .xlsOne exception appears to be in retail trade, which fell by 0.5% in Quarter 1 2018 following three consecutive quarters of growth. The latest Retail sales bulletin indicated that retail sales volumes fell in Quarter 1 2018, due largely to a sharp decline in petrol sales during March 2018, with the adverse weather conditions keeping shoppers indoors. However, the snow also helped boost online retail spending, with department stores in particular seeing growth in their internet sales in March.
Output in the distribution, hotels and catering sector fell by 0.1% in Quarter 1 2018 and was the only main component of services that saw a decline in the quarter. There has been a longer-term weakening in consumer-focused industries, such as retail sales, with quarter-on-year growth remaining subdued in the latest quarter despite a slight uptick – due largely to a sharp drop in Quarter 1 2017. Quarterly growth in consumer-focused industries fell sharply in Quarter 1 2018 and was weaker than growth in overall services (Figure 4).
Growth in transportation, storage and communication slowed to 0.4% in Quarter 1 2018. The largest subtraction from growth within this sector came from postal and courier activities, with output falling by its weakest quarterly rate since Quarter 1 2014 (down by 2.9%). However, this is most likely to reflect an unwinding of growth following a strong rise of 3.9% in Quarter 4 2017.
Business services and finance continued to be the main driver of quarterly growth in total services in Quarter 1 2018, contributing 0.2 percentage points (Figure 3). Although growth eased slightly compared with Quarter 4 2017, this is the third consecutive quarter in which business services and finance has been the largest positive contributor to total services growth. Within this sector, professional scientific and technical services was the main driver of growth in Quarter 1 2018, with an increase of 1.2%. This is in line with the latest Bank of England’s Agents’ summary of business conditions (PDF, 875.8KB) for Quarter 1 2018, which noted that business services turnover growth had been modest but had strengthened, reflecting growth in demand for legal, accounting and advisory services.
Figure 4: Growth rate of consumer-focused services output and total services output, quarter-on-quarter
UK, Quarter 1 (Jan to Mar) 2014 to Quarter 1 2018
Source: Office for National Statistics
Notes:
Q1 refers to Quarter 1 (Jan to Mar), Q2 refers to Quarter 2 (Apr to June), Q3 refers to Quarter 3 (July to Sept), and Q4 refers to Quarter 4 (Oct to Dec).
Consumer-focused services defined here include retail trade (Standard Industrial Classification (SIC) 2007 codes 45 and 47), food and beverage (SIC code 56), publishing, audiovisual and broadcasting activities (SIC codes 58 to 60; including motion pictures), and arts, entertainment and recreation (SIC codes 90 to 93).
Download this chart Figure 4: Growth rate of consumer-focused services output and total services output, quarter-on-quarter
Image .csv .xls6. Production output increases by 0.7% in Quarter 1 2018, despite slowing growth in manufacturing
Output in the production sector rose by 0.7% in Quarter 1 (Jan to Mar) 2018, contributing 0.1 percentage points to overall gross domestic product (GDP) growth in the quarter. However, this primarily reflects two temporary erratic factors – the rebound in mining and quarrying with the reopening of the Forties pipeline system after its shutdown in December 2017 and the cold weather boost to electricity and gas production in Quarter 1 2018. The latest published monthly production figures show that mining and quarrying output rose by 23.0% in January 2018 following a sharp 19.5% drop in December 2017, while energy supply increased by 3.7% in February 2018 – its strongest rate since April 2017. There was no evidence to suggest that the recent snow and adverse weather conditions had any negative impact on production in Quarter 1 2018.
These two temporary factors masked a weaker performance in manufacturing, with output slowing to 0.2% in Quarter 1 2018 following a strong run of expansion in 2017. Manufacturing ended 2017 on eight consecutive months of growth, with the sector holding up overall production growth in Quarter 4 (Oct to Dec) 2017– more than offsetting the sharp drop seen in mining and quarrying (Figure 5). In contrast, manufacturing contributed just 0.2 percentage points to production growth in Quarter 1 2018 and did not contribute to overall GDP growth (to one decimal place).
Figure 5: Contributions to growth in production output by sector
UK, Quarter 1 (Jan to Mar) 2017 to Quarter 1 2018
Source: Office for National Statistics
Notes:
- Q1 refers to Quarter 1 (Jan to Mar), Q2 refers to Quarter 2 (Apr to June), Q3 refers to Quarter 3 (July to Sept), and Q4 refers to Quarter 4 (Oct to Dec).
Download this chart Figure 5: Contributions to growth in production output by sector
Image .csv .xlsOn a sub-sector level, the slowing manufacturing growth in Quarter 1 2018 was in part due to a weaker performance in basic metals and metal products (Figure 6). Manufactures of basic metals and metal products fell by 0.8% in Quarter 1 2018 following growth of 5.5% in Quarter 4 2017 – which was the strongest quarterly growth since Quarter 4 1998. Meanwhile, the largest positive contributions to overall manufacturing growth in Quarter 1 2018 came from transport equipment, and machinery and equipment (both 0.3 percentage points).
Figure 6: Contributions to growth in manufacturing output by sub-sector
UK, Quarter 1 (Jan to Mar) 2016 to Quarter 1 2018
Source: Office for National Statistics
Notes:
Q1 refers to Quarter 1 (Jan to Mar), Q2 refers to Quarter 2 (Apr to June), Q3 refers to Quarter 3 (July to Sept), and Q4 refers to Quarter 4 (Oct to Dec).
Components may not sum to total manufacturing output due to rounding.
Download this chart Figure 6: Contributions to growth in manufacturing output by sub-sector
Image .csv .xls7. Construction output declines by 3.3% in Quarter 1 2018, the sharpest fall since Quarter 2 2012
The preliminary estimate of construction shows that output fell by 3.3% in Quarter 1 (Jan to Mar) 2018, subtracting 0.2 percentage points from gross domestic product (GDP) growth. This marked the second consecutive quarterly decline in construction output and the sharpest decline since Quarter 2 (Apr to June) 2012.
While there was some evidence that the recent adverse weather conditions had a dampening impact on construction activity in both February and March 2018, the weakness in Quarter 1 2018 is due largely to a sharp fall in output in January 2018 – prior to the snow. The latest published monthly path for construction shows that output fell by 3.1% in January 2018, the largest monthly fall since April 2012. This was due mainly to an 8.3% fall in private new housing, following a historically high level of output in December 2017. Despite this monthly fall in January 2018, private new housing recorded its eighth consecutive month of three-monthly growth in February 2018 and remains the bright spot in the construction sector.
Back to table of contents8. Real time analysis of the effects of heavy snow in Quarter 4 2010
Some insights can be inferred from previous quarters in which adverse weather is known to have impacted upon the UK economy. The last such episode was in the fourth quarter of 2010 and earlier analysis highlighted how output was adversely impacted in distribution, hotels and restaurants. This was explained by a fall in such discretionary spending as individuals stayed indoors, while distribution was affected by disruptions to transport.
The first estimate of gross domestic product (GDP) showed that output fell by 0.5% in Quarter 4 (Oct to Dec) 2010, with some activity appearing to have been displaced into the first three months of 2011. These figures have been revised significantly over time, such that the latest estimate shows that output slowed to 0.1% in Quarter 4 2010. Figure 7 shows how this estimate has been revised over time, as well as in the preceding and following quarters, which helps inform the extent to which the narrative of the effect of the heavy snow has changed. This effect is less marked in the latest vintage, as GDP growth in Quarter 3 (July to Sept) 2010 has been revised down over time.
The estimates published in April 2011 show that GDP growth fell from 0.7% in Quarter 3 2010 to negative 0.5% in Quarter 4 2010, much of which was attributed to the effects of the adverse weather. In contrast, the latest estimates show that this slowing was less marked, with GDP growth slowing from 0.5% to 0.1%. However, Figure 7 shows that the narrative of activity being displaced into Quarter 1 (Jan to Mar) 2011 is still reflected in the latest estimates, as the revisions to the first quarter of 2011 have followed a similar profile to that of Quarter 4 2010.
Figure 7: Real-time vintages, UK, Quarter 4 (Oct to Dec) 2010 compared with Quarter 1 (Jan to Mar) 2011
UK, Time period in months after original publication
Source: Office for National Statistics
Download this chart Figure 7: Real-time vintages, UK, Quarter 4 (Oct to Dec) 2010 compared with Quarter 1 (Jan to Mar) 2011
Image .csv .xls9. Growth in CPIH fell to 2.3% in March 2018
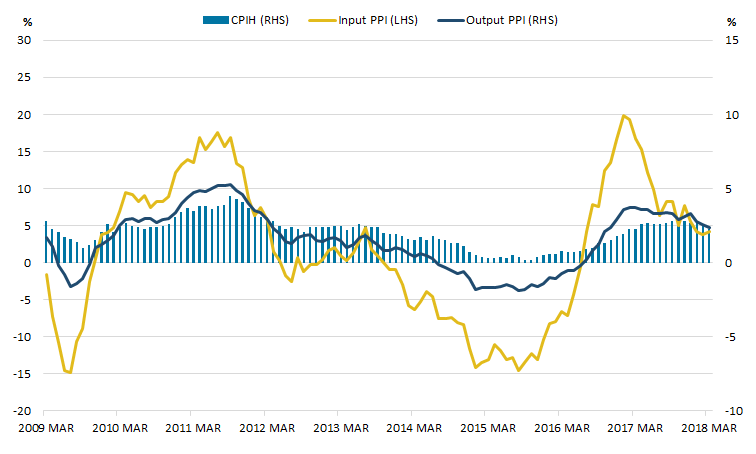
Figure 8 shows that the 12-month growth rate of the Consumer Prices Index including owner occupiers’ housing costs (CPIH) fell to 2.3% in March 2018; the change was driven mainly by the clothing and footwear, and alcoholic beverages and tobacco categories. The input Producer Price Index (input PPI) grew by 4.2% in the 12 months to March 2018, up from 3.8% in the 12 months to February 2018; driven mainly by increases in the 12-month growth rates for crude oil and fuels. The output Producer Price Index (output PPI) grew by 2.4% in the 12 months to March 2018, down from 2.6% in the 12 months to February 2018, with the biggest falls seen in the 12-month growth rates for food products and transport equipment.
Figure 8: Annual growth rate for input Producer Price Index (PPI) (left-hand side), output PPI and Consumer Prices Index including owner occupiers' housing costs (CPIH) (right-hand side)
UK, March 2009 to March 2018
Source: Office for National Statistics
Download this image Figure 8: Annual growth rate for input Producer Price Index (PPI) (left-hand side), output PPI and Consumer Prices Index including owner occupiers' housing costs (CPIH) (right-hand side)
.png (25.1 kB) .xls (44.5 kB)
In February 2018, the latest month for which data are available, the 12-month growth rate for house prices in London fell to negative 1.0%, its first month of negative annual growth since September 2009, continuing a recent broad trend of slowdown that started in 2014. By contrast, the 12-month growth rate for house prices in Great Britain excluding London was 4.7% and the average rate for Great Britain as a whole was 4.3%.
Figures 9 and 10 show the House Price Index (left-hand side, indexed to January 2010) and 12-month growth rates for house prices (right-hand side) for London and Great Britain excluding London respectively.
Figure 9: London House Price Index (HPI) (left-hand side) and 12-month growth rate in house prices (right-hand side)
January 2010 to February 2018
Source: HM Land Registry, Office for National Statistics
Download this chart Figure 9: London House Price Index (HPI) (left-hand side) and 12-month growth rate in house prices (right-hand side)
Image .csv .xls
Figure 10: Great Britain excluding London House Price Index (HPI) (left-hand side) and 12-month growth rate in house prices (right-hand side)
January 2010 to February 2018
Source: HM Land Registry, Office for National Statistics
Download this chart Figure 10: Great Britain excluding London House Price Index (HPI) (left-hand side) and 12-month growth rate in house prices (right-hand side)
Image .csv .xlsSince March 2016, the 12-month growth rate in house prices in London has been decreasing from positive 14.8% in March 2016 to a low point of negative 1.0% in February 2018. Over the same period, the 12-month growth rate in Great Britain excluding London has been relatively more stable, falling only from 8.7% in March 2016 to 4.7% in February 2018.
The decrease in house price growth in London since March 2016 probably reflects changing demand for properties in the capital, following the introduction of a higher rate of Stamp Duty on additional properties in April 2016, and affordability due to historic high prices in the capital.
Back to table of contents10. The unemployment rate fell to 4.2% in the three months to February 2018
Latest estimates from the Labour Force Survey show that the number of unemployed people fell by 16,000, leading to a fall of the unemployment rate by 0.1 percentage points to 4.2% in the three months to February 2018, when compared with the previous quarter.
The unemployment level for men fell by 17,000, when compared with September to November 2017, and the rate fell to 4.2%. For women, unemployment increased by 1,000; although this rise was not large enough to have a material impact on their unemployment rate. When rounded, the unemployment rate for women was 4.2% in the three months to February 2018, compared with 4.3% in the three months to November 2017.
Figure 11: Unemployment and employment rate
UK, seasonally adjusted, January to March 2004, to December 2017 to February 2018
Source: Office for National Statistics, Labour Force Survey
Download this chart Figure 11: Unemployment and employment rate
Image .csv .xlsEmployment
As the level of unemployment fell, the level of employment continued to rise, leading to a record high employment rate of 75.4% in the three months to February 2018. The growth in the number of people in employment was driven by employees (with an increase of 103,000), with the number of self-employed contracting by 18,000 compared with the previous quarter. In the March 2018 commentary, we looked at the longer-term trends in self-employment and noted that the recent slight decline comes after a prolonged period of growth, where the growth for part-time self-employed people exceeded that of their full-time counterparts.
Employment for both sexes increased, by 8,000 for men and by 47,000 for women when compared with the previous quarter. This increase brought employment among women to an unprecedented high of 15.17 million.
Changes in employment levels by age group were fairly consistent across the board, with every age group except those aged 18 to 24 years experiencing an increase in employment. Of some interest is the highest recorded employment for 50-to-64-year-olds, which increased by 28,000 on the quarter to 8.9 million.
Figure 12: Full-time and part-time employment
UK, seasonally adjusted, January to March 2004, to December 2017 to February 2018
Source: Office for National Statistics, Labour Force Survey
Download this chart Figure 12: Full-time and part-time employment
Image .csv .xlsBroken down by working pattern, full-time employment increased by 25,000 compared with September to November 2017. This is less than the increase in part-time employment (29,000) that brought part-time employment to 8.58 million, a level that has not been seen before. Persistent employment growth in recent periods is a major factor contributing to the low rates of unemployment. However, the increased headcount may conceal the compositional changes in the labour force. We touched upon the changes in the working patterns in the February 2018 commentary and showed that part-time working is gaining more prominence particularly among those in self-employment in the March 2018 commentary. In this commentary, we will consider the responsiveness of employment to economic growth and its industry composition.
Employment intensity of growth
Figure 13 looks at the developments in real gross domestic product (GDP), employment and total hours worked in the economy since the start of 2008. Following a contraction in output during the economic downturn, the total number of hours worked fell further than employment. One reason for that is “labour hoarding”, a situation where companies continue to employ more workers than they need to produce the diminished amount of output. This phenomenon occurs for reasons such as fixed costs associated with redundancies (typically because of employment protection legislation) as well as expectations that skilled labour will be required in the recovery phase.
The longer time series suggests that compared with the earlier recessions, employment appeared less responsive to the fall in GDP and exhibited a relatively moderate contraction in the wake of what turned out to be a major economic downturn. Generally, hours worked tend to grow faster than employment headcount in the initial phase of the recovery, whereby the existing “hoarded” workers can meet the demand for extra output. It is therefore interesting that in 2010, employment started growing as soon as hours worked started recovering. Since 2013, both the hours worked and employment have followed a very close trend.
Figure 13: Real gross domestic product, employment and total hours worked
UK, seasonally adjusted, January to March 2008 to October to December 2017
Source: Office for National Statistics
Download this chart Figure 13: Real gross domestic product, employment and total hours worked
Image .csv .xlsIn the Labour market economic commentary: March 2018, we briefly looked at the quarter-on-quarter growth of the real GDP and employment. We explained that employment growth in percentage terms is normally slower than the growth of GDP, consistent with a flatter than GDP line slope of the employment and hours work lines. The stronger-than-before growth dynamics of employment in comparison with GDP raises the question of the sources of this expansion. The responsiveness of employment to GDP growth is often expressed in terms of employment elasticity. Since the last economic downturn, for any percentage point growth in GDP, there is now a higher growth in employment than prior to the downturn. In other words, employment elasticity has increased.
A decomposition of economic growth also provides a useful insight into employment growth. An increase in employment elasticity would be indicative of the economic growth shifting to more employment-intensive activities.1
Industry decomposition of growth
Employment intensity of growth is closely related to the notion of labour productivity – any given amount of output produced requires a certain level of employment (or, more generally, units of labour), multiplied by labour productivity (the value of output per unit of labour input). Figure 14 compares the cumulative change in gross value added (GVA) and employment by industrial sector (Standard Industrial Classification 2007: SIC 2007) in 2014 to 2017. For illustrative purposes, it also shows the four-year period before the last economic downturn.
Figure 14: Industry contributions to cumulative value added (GVA) and workforce jobs growth
UK, 2004 to 2007 and 2014 to 2017
Source: Office for National Statistics
Notes:
- The chart shows industries that contributed to positive growth in GVA and/or net workforce jobs. As such, agriculture, forestry and fishing (SIC section A) is not shown separately as its share did not exceed 1% of either GVA or net jobs growth. Similarly, production (SIC sections B to E) is not visible on the 2004 to 2007 segment of the chart as it saw contraction in employment (therefore not contributing to job creation) and negligible cumulative contribution to GVA at around 0.01%.
Download this chart Figure 14: Industry contributions to cumulative value added (GVA) and workforce jobs growth
Image .csv .xlsBetween March 2014 and December 2017, of the growth in jobs, just under one-third was in the distribution, transport, accommodation and food sectors (SIC sections G to I)2. Back in 2004 to 2007, only about 1 in 10 jobs and 17% of real gross value added (GVA) were created in the distribution, transport, accommodation and food sectors (SIC sections G to I), the major components of which are categorised as less knowledge-intensive services by Eurostat.
Administrative and support activities (SIC section N) were the second-largest contributor to workforce jobs growth between March 2014 and December 2017, having a far more modest share of real GVA increase and being also considered a less knowledge-intensive services industry. Together with activities such as arts, recreation and household services (SIC sections R to U), these three broad categories of services contributed to over half of cumulative jobs growth but only to one-third of the GVA increase.
This observation should not be interpreted as an indication of slow output growth in these sectors. In fact, taking the example of distribution, transport, accommodation and food sectors (SIC sections G to I), the real GVA growth constituted 12%, compared with 7% of jobs increase between March 2014 and December 20173. Instead, the data suggest that for a given percentage gain in GVA, employment growth was higher than average.
Notes for: The unemployment rate fell to 4.2% in the three months to February 2018
Employment intensity of growth and labour intensity correspond to different concepts. Although both measure the amount of labour input used in production, in the case of labour intensity, the labour share is often expressed as labour compensation. Hence, a higher labour share does not necessarily mean higher headcount. Although the two tend to be correlated, scientific and legal services are the examples of activities where high labour intensity may in fact be associated with relatively few jobs.
These statistics describe the net increase in the number of workforce jobs. For any industry, this corresponds to the number of workforce jobs created over the course of the three-year period less the number of destroyed jobs.
For real GVA, values corresponding to Quarter 1 2014 and Quarter 4 2017 are used.