Table of contents
- Main points
- Statistician’s comment
- Summary
- Impact of changing weight of air fares on the 12-month growth rate in CPIH
- Oil prices were a big driver of change in input PPI in 2017 with base effects having a large impact
- Consumer prices in the UK continue to grow more quickly than in France, Germany or the EU as a whole
- Growth in house prices and rental prices in London was lower than those in the rest of Great Britain in 2017
1. Main points
- Growth in the Consumer Prices Index including owner occupiers’ housing costs (CPIH) fell slightly to 2.7% in the 12 months to December 2017, while the growth rate of the price of goods leaving the factory gate rose to 3.3%.
- Oil prices were the biggest driver of change in input producer price inflation (PPI) over 2017, with the majority of the 12-month growth rate being affected by base effects.
- Consumer prices in the UK are still growing more quickly than those in France, Germany and the EU as a whole in 2017.
- The London housing market continued to weaken in 2017, with growth rates in both house prices and rental prices remaining below those for the rest of Great Britain.
2. Statistician’s comment
Commenting on today’s inflation figures, ONS Senior Statistician James Tucker said:
“Inflation has been running at roughly the same rate since last spring following significant increases, partly due to the weaker pound after the European referendum. It remains too early to say whether today’s slight fall is the start of any longer-term reduction in the rate of inflation.
“Rising air fares having a smaller impact on headline inflation than last year and the falling cost of various toys and games helped nudge down inflation in December. These were partially offset by rising tobacco prices.
“Increasing costs of tobacco and chemicals, partially offset by slowing petroleum price rises, helped push up the price of goods leaving factories. However, there was a slowdown in the increase in raw material costs, mainly due to falling crude oil prices.
“House price growth has been little changed in recent months, with a cooling London property market offset by price rises in the Midlands.”
Back to table of contents3. Summary
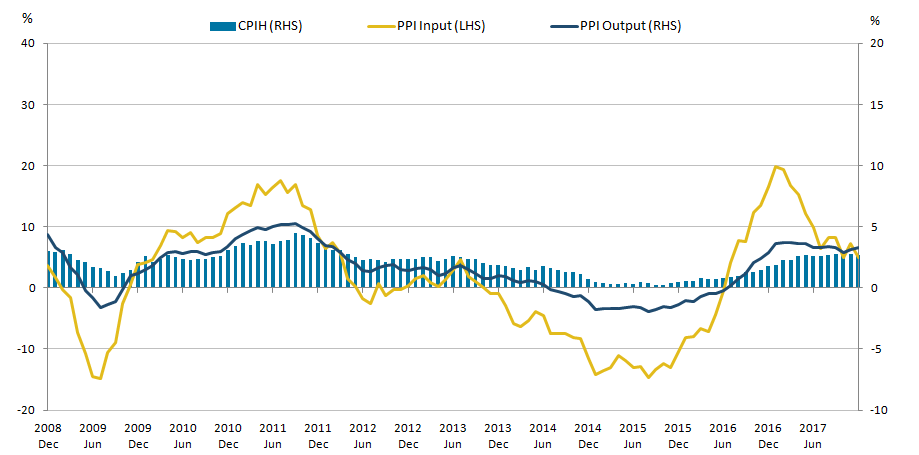
Figure 1 shows that the 12-month growth in the Consumer Prices Index including owner occupiers’ housing costs (CPIH) fell to 2.7% in December 2017. The input Producer Prices Index (input PPI) grew by 4.9% in the 12 months to December 2017, down from 7.3% in the 12 months to November 2017. The output Producer Prices Index (output PPI) grew by 3.3% in the 12 months to December 2017, up from 3.1% in the 12 months to November 2017.
Figure 1: Annual growth rate for Producer Price Index (PPI) input (left-hand side), PPI output and Consumer Prices Index including owner occupiers' housing costs (CPIH) (right-hand side)
UK, December 2008 to December 2017
Source: Office for National Statistics
Notes:
- These data are also available within the Dashboard: Understanding the UK economy.
Download this image Figure 1: Annual growth rate for Producer Price Index (PPI) input (left-hand side), PPI output and Consumer Prices Index including owner occupiers' housing costs (CPIH) (right-hand side)
.png (27.9 kB) .xls (34.3 kB)
Data tables accompanying this commentary include contributions to the 12-month growth rate of output and input PPI, and contributions to the 12-month growth rate of CPIH and CPI by import intensity of goods and services.
Back to table of contents4. Impact of changing weight of air fares on the 12-month growth rate in CPIH
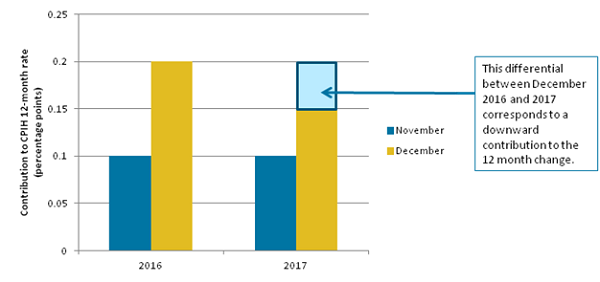
Between November and December 2017, the 12-month growth rate of Consumer Prices Index including owner occupiers’ housing costs (CPIH) fell from 2.8% to 2.7%. The largest downward contribution to this change in growth rate came from transport, which was driven particularly by air fares. As is usually the case in December, air fares rose sharply, with the increase being of a similar magnitude to the previous year. However, because air fares account for a smaller proportion of the inflation basket of goods and services in 2017 compared with 2016, the impact of the rise in price on the contribution of air fares to the headline rate was smaller in 2017 than in 2016. This in turn resulted in air fares making a downward contribution to the change in the rate. An example of this effect is illustrated in Figure 2.
In this example, prices rise by a similar amount between November and December in both 2016 and 2017. For simplicity we also assume that the contribution to the headline rate in November was the same in both years (0.1 percentage points as represented by the darker (blue) bars). As a result of the weight change, the impact of the rise in price on the contribution to the headline rate (the lighter (yellow) bars) was smaller in 2017 than in 2016, which in turn results in a downward contribution to the change in rate between November and December 2017.
Figure 2: Illustrative example of a downward contribution from the airfares component
Source: Office for National Statistics
Download this image Figure 2: Illustrative example of a downward contribution from the airfares component
.png (27.5 kB)
5. Oil prices were a big driver of change in input PPI in 2017 with base effects having a large impact
Figure 3 shows the contribution that components of the input Producer Price Index (PPI) have made to the headline 12-month growth rate for each month in 2017. The figure also shows 12-month growth rates in the inverted sterling effective exchange rate (ERI) and the US dollar price of Brent crude oil over the same period.
Since its 2017 peak of 19.9% in January, the 12-month growth rate of input PPI has generally been weakening, to a low of 4.9% in December 2017. These recent changes are driven mainly by the contributions of crude oil, which fell over much of the first half of 2017 – reflecting a gradual strengthening of sterling and gradually falling world prices for Brent crude oil – but started to increase again in the second half of 2017.
Much of the change seen in both headline input PPI and the specific crude oil component over the course of 2017 is attributable to base effects. As 12-month growth rates compare prices each month to the same month a year before, the rate is usually driven by a combination of recent price changes and the comparison month a year previously. Previous analysis has shown that base effects have a relatively large effect on input PPI. In turn, this likely reflects the significant contribution of crude oil, which follows a relatively volatile path.
Imported components have also made a significant contribution to the 12-month growth rate of input PPI in 2017. For example, at its peak in January 2017, imported metals contributed 2.6 percentage points to input PPI while the contribution from imported chemicals peaked at 1.4 percentage points in March and June.
Figure 3: Contributions to input Producer Price Index (PPI) (left-hand side), the 12-month growth rate of sterling effective exchange rate (ERI) (left-hand side) and Brent crude oil (US dollars) (right-hand side)
UK, January 2017 to December 2017

Source: Office for National Statistics, Bank of England, Financial Times
Download this image Figure 3: Contributions to input Producer Price Index (PPI) (left-hand side), the 12-month growth rate of sterling effective exchange rate (ERI) (left-hand side) and Brent crude oil (US dollars) (right-hand side)
.png (25.5 kB) .xls (30.2 kB)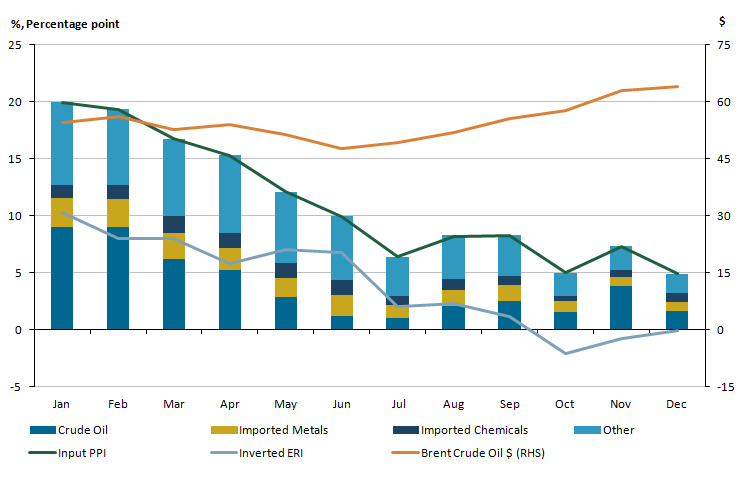
Figure 4 shows the prices that manufacturing firms pay for crude oil as represented by the crude oil component of the input Producer Prices Index (input PPI), consumer prices for fuels and lubricants from the Consumer Prices Index including owner occupiers’ housing costs (CPIH) and factory gate prices for refined petroleum products from the output Producer Prices Index (output PPI), indexed to January 2015 equals 100.
Figure 4: Crude oil (input PPI), refined petroleum products (output PPI) and fuel and lubricants (CPIH)
UK, January 2015 to December 2017
Source: Office for National Statistics
Download this chart Figure 4: Crude oil (input PPI), refined petroleum products (output PPI) and fuel and lubricants (CPIH)
Image .csv .xlsPrevious analysis has shown that the crude oil component of input PPI is closely related to world prices of Brent crude oil, which are relatively volatile. It can be seen from Figure 4 that prices for the equivalent components of output PPI and CPIH follow a similar trend but are flatter suggesting that changes in producers’ input prices – both positive and negative – are not fed through directly to consumers.
Fuels and lubricants (CPIH) and refined petroleum products (output PPI) have followed each other closely over the period since 2015 with both series trending upwards since mid-2017. In December 2017, the crude oil component of input PPI and the fuels and lubricants component of CPIH both decreased slightly while the refined petroleum component of output PPI increased very slightly.
Back to table of contents6. Consumer prices in the UK continue to grow more quickly than in France, Germany or the EU as a whole
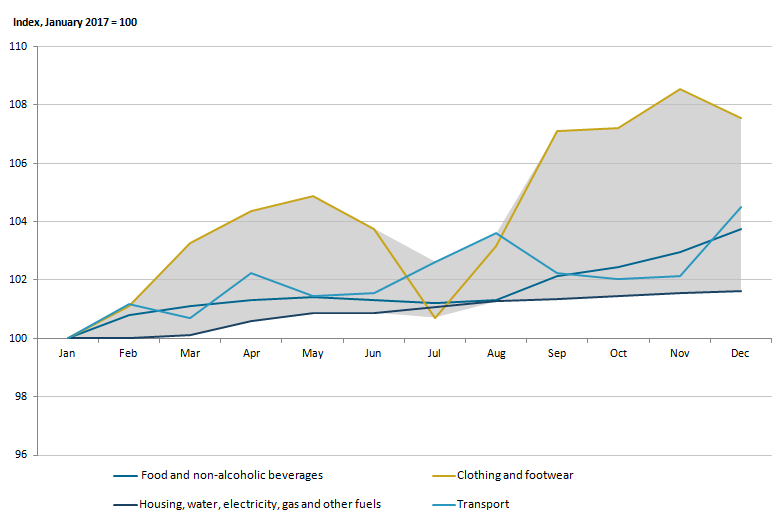
Figure 5 shows selected components of Consumer Prices Index including owner occupiers’ housing costs (CPIH) indexed to January 2017 equals 100 with the shaded area representing the difference between the highest and lowest component index for each month. All components have been trending upwards relative to January 2017 with some seasonal variation seen in transport, clothing and footwear.
Figure 5: Components of Consumer Prices Index including owner occupiers’ housings costs (CPIH)
UK, January 2017 to December 2017
Source: Office for National Statistics
Notes:
- The shaded area represents the difference between the highest and lowest component index for each month.
Download this image Figure 5: Components of Consumer Prices Index including owner occupiers’ housings costs (CPIH)
.png (24.0 kB) .xls (23.6 kB)
One of the biggest drivers of CPIH in the UK over the course of 2017 has been transport, which made the highest contribution to the change in the 12-month growth rate for 10 months of 2017. The price changes for transport seen over 2017 are driven largely by seasonal variation in air fares, with prices for most other components of transport remaining fairly flat over the period. Although air fares have risen over the course of 2017 – in keeping with seasonal trends – they have been recently contributing negatively to the 12-month growth rate in both transport and overall CPIH due to a change in the CPIH weights, which has been explored more in section 4.
The housing, water, electricity, gas and other fuels component has seen the lowest overall growth in prices in 2017. This is due to price changes in owner occupiers’ housing costs (OOH) moving in the opposite direction to price changes for electricity, gas and other fuels. OOH has seen a gradual decline throughout 2017 whilst both gas and electricity have seen price increases, with electricity prices increasing more sharply, especially towards the end of 2017. These offsetting effects have resulted in a relatively flat index for housing, water, electricity, gas and other fuels over 2017.
Figure 6a: Harmonised Index of Consumer Prices (HICP)
UK, France, Germany and the EU as a whole, January 2017 to December 2017
Source: Eurostat, Office for National Statistics calculations
Notes:
- Data for France, Germany and the EU are unavailable for December 2017.
Download this chart Figure 6a: Harmonised Index of Consumer Prices (HICP)
Image .csv .xlsFigure 6a shows the Harmonised Index of Consumer Prices (HICP) for the UK, Germany, France and the EU as a whole. The HICP is equivalent to the Consumer Prices Index (CPI) in the UK and allows for international comparisons of consumer price inflation to be made on a consistent basis.
In 2017, prices in the UK have followed a broadly similar trend to those in France and the EU as a whole but have been increasing at a faster rate, with UK prices increasing by 3.5% over the course of the year. Equivalent data for the other countries are only available until November 2017, over which period UK prices increased by 3.2% compared with an increase of only 2% in the EU as a whole, 1.2% in France and 1.6% in Germany.
Figure 6b shows that this trend has been sustained over the longer-term, with prices for each country and the EU as a whole being compared with their 2007 average. Between January 2009 and December 2017, the UK CPI grew by 23.6% whereas between January 2009 and November 2017 – the latest month for which data are available – prices in the EU as a whole grew by only 14.6% and those in Germany and France grew by 11.1% and 12% respectively.
Figure 6b: Harmonised Index of Consumer Prices (HICP)
UK, France, Germany and the EU as a whole, January 2007 to December 2017
Source: Eurostat, Office for National Statistics calculations
Notes:
- Data for France, Germany and the EU are unavailable for December 2017.
Download this chart Figure 6b: Harmonised Index of Consumer Prices (HICP)
Image .csv .xlsOne of the biggest drivers of change in UK CPI is food and non-alcoholic beverages, which comprises 9.1% of the overall CPI inflation basket in 2017. Figure 7a compares the food and non-alcoholic beverages component of HICP for the UK, Germany, France and the EU as a whole. As with HICP as a whole, the UK has seen the highest price growth in food and non-alcoholic beverages over 2017, with prices increasing by 3.1% between January and November, compared with only 1.4% in the EU as a whole and ending the year 3.7% higher than in January.
Figure 7a: Harmonised Index of Consumer Prices for food and non-alcoholic beverages
UK, Germany, France and the EU as a whole, January 2017 to December 2017
Source: Eurostat, Office for National Statistics calculations
Notes:
- Data for France, Germany and the EU are unavailable for December 2017.
Download this chart Figure 7a: Harmonised Index of Consumer Prices for food and non-alcoholic beverages
Image .csv .xlsThe faster growth in food prices seen in the UK in 2017 may be partly attributable to a further sterling depreciation between May and August 2017 feeding through gradually into consumer prices later in 2017.
Looking at longer-term trends, in Figure 7b, when compared with 2007 price levels, the UK index for food and non-alcoholic beverages has also been consistently higher than the equivalent index for France, Germany and the EU as a whole since August 2008. It is notable, however, that between February 2014 and September 2016, food prices in the UK were falling, a trend which was not mirrored in France, Germany or the EU as a whole. This has been linked to supermarket price wars, which resulted in downward pressure on food prices in the UK.
Figure 7b: Harmonised Index of Consumer Prices for food and non-alcoholic beverages
UK, Germany, France and the EU as a whole, January 2007 to December 2017
Source: Eurostat, Office for National Statistics calculations
Notes:
- Data for France, Germany and the EU are unavailable for December 2017.
Download this chart Figure 7b: Harmonised Index of Consumer Prices for food and non-alcoholic beverages
Image .csv .xls7. Growth in house prices and rental prices in London was lower than those in the rest of Great Britain in 2017
Figure 8a shows the 12-month growth rates for house prices and rental prices for London and Great Britain excluding London. For both areas, house prices have been growing faster than rental prices throughout 2017, in line with long-term trends. House price growth in London fell over the period, from 4.0% in January 2017 to 2.3% in November 2017, while in the rest of Great Britain it grew only slightly from 4.9% to 5.4%.
Figure 8a: 12-month growth rates for house prices and rental prices
London and Great Britain excluding London, January 2017 to December 2017
Source: Office for National Statistics, HM Land Registry
Notes:
- HPI data for December 2017 are not yet available.
Download this chart Figure 8a: 12-month growth rates for house prices and rental prices
Image .csv .xlsThe Royal Institution of Chartered Surveyors (RICS) November Residential Market Survey (PDF, 598KB) points to subdued momentum in the housing market and notes that new instructions to sell continued to deteriorate at the headline level. This extends a run of 22 months in which this series has not seen a positive reading. New landlord instructions similarly continued to decline while, on the demand side, interest from prospective tenants fell back (on a non-seasonally adjusted basis) for the first time since 2015.
Figure 8b shows that London house price growth has been broadly following the movements of house prices in the rest of Great Britain between January 2013 and December 2016. However, from January 2017 onwards, London house price growth was below that of the rest of Great Britain. Both saw a fall in house price growth in March 2017, which is attributable to a base effect as both regions had relatively high growth rates in March 2016 compared with March 2017. As noted in previous analysis, this is likely due to Stamp Duty changes that came into effect in March 2016 and caused a spike in house prices prior to the change.
Figure 8b: 12-month growth rates for house prices and rental prices
London and Great Britain excluding London, January 2013 to December 2017
Source: Office for National Statistics, HM Land Registry
Notes:
- HPI data for December 2017 are not yet available.
Download this chart Figure 8b: 12-month growth rates for house prices and rental prices
Image .csv .xlsLooking at the longer-term, both London and the rest of Great Britain have broadly followed similar trends between January 2013 and December 2016, with Great Britain excluding London being more muted. A different pattern can be seen in rental price growth, with London showing more volatility, varying by 4.2 percentage points; whilst the rest of Great Britain has varied by only 1.3 percentage points across the period. London has had consistently higher growth rates in both house prices and rental prices until December 2016, where both London house and rental price growth fell below that of the rest of Great Britain for the first time in the period.
Back to table of contentsContact details for this Article
Related publications
- Index of Private Housing Rental Prices, Great Britain: December 2017
- UK House Price Index: November 2017
- Consumer price inflation, UK: December 2017
- Producer price inflation, UK: December 2017
- Index of Private Housing Rental Prices, Great Britain: December 2017
- Private rental growth measures, a UK comparison: October to December 2017