1. Main points
The number of people in work reached a new record, with 32.21 million people in work in the three months to November 2017.
While employment was at a record high level, driven by an increase in full-time employment, the total number of self-employed workers decreased by 82,000 in the three months to November 2017.
At 810,000, the number of vacancies in October to December 2017 was the highest since comparable records began in 2001; the vacancy rate was also at its highest, as was the vacancy-to-unemployment ratio.
The growth in the number of vacancies in 2017 comes from a broad range of industries but the tightening in the labour market is not felt in the same way across the entire economy, reflecting potential skills mismatches.
2. Employment
Latest estimates from the Labour Force Survey show that there were 32.21 million people in work in the three months to November 2017, which is 415,000 more than for the same period a year earlier and 102,000 more than the previous quarter.
The increase in the number of people in work was driven by a rise in full-time employees, whose number increased by 173,000 in the three months to November 2017, when compared with the previous quarter, to a record high of 20.25 million people. In contrast with the overall growth, the number of employees working part time fell by 7,000 during the same period.
Figure 1: Percentage contribution change in employment level by working pattern
UK, seasonally adjusted, September to November 2001 to September to November 2017
Source: Office for National Statistics, Labour Force Survey
Notes:
- Full-time is defined as employees working more than 30 paid hours per week.
Download this chart Figure 1: Percentage contribution change in employment level by working pattern
Image .csv .xlsWhile employment was at a record high level, the total number of self-employed workers decreased by 82,000 in the three months to November 2017. As a result, the number of people in self-employment was 4,000 lower compared with the same period a year earlier. Overall, 2017 has seen a change in the longer-term trend of increasing self-employment.
Figure 2: Quarterly percentage change in employment rate and self-employment level
UK, seasonally adjusted, September to November 2001 to September to November 2017
Source: Office for National Statistics, Labour Force Survey
Download this chart Figure 2: Quarterly percentage change in employment rate and self-employment level
Image .csv .xls3. Number of vacancies
In the October to December 2017 period, the number of vacancies reached 810,000, an all-time high since comparable records began in 2001. Vacancies are the positions for which employers are actively seeking to recruit outside their business or organisation. This commentary looks at the vacancy data in some detail and explains some of the basic facts that these data can tell us about the UK labour market.
The data on vacancies are usually mentioned in the context of labour market tightness, or a situation where the demand for labour exceeds the supply – or indeed in the opposite scenario of labour market slack. As the number of vacancies changes in line with the number of jobs, and so, to some extent, population growth, a helpful way of looking at the vacancy data is the vacancy rate, or the number of vacancies per 100 employee jobs. On the one hand, the higher rate reflects the demand for labour that is not satisfied; while on the other hand, it can indicate skills mismatch. In simple terms, skills mismatch relates to situations whereby employers are less able to fill vacancies owing to the characteristics of the candidates.1
Figure 3: Vacancies per 100 employee jobs in the UK
Seasonally adjusted, September to November 2001 to September to November 2017
Source: Office for National Statistics, Vacancy Survey
Download this chart Figure 3: Vacancies per 100 employee jobs in the UK
Image .csv .xlsNotes for: Number of vacancies
- For more information, see the article How useful is the concept of skills mismatch?
4. Beveridge curve
The vacancy rate is often considered in conjunction with the rate of unemployment. The negative relationship between the two is shown in Figure 4. This chart, known as the Beveridge curve, shows that when demand for goods and services, and subsequently labour falls, as was the case in 2008 to 2009, the vacancy rate decreases and the unemployment rate increases. This generates a downward movement along the curve. During the recovery period, a movement in the opposite direction along the curve is generally expected, as is manifested by the 2010 to 2014 segment of the curve.
In addition, structural changes in the economy, such as those affecting the efficiency of labour market matching or the separation rate, can cause the curve to shift. In reality, both the cyclical movements and the structural shifts can be happening simultaneously and with varying magnitude. Isolating these effects can be very difficult in practice.
Figure 4: Beveridge curve: vacancy and unemployment rate
UK, seasonally adjusted, January to March 2003 to September to November 2017

Source: Office for National Statistics, Labour Force Survey, Vacancy Survey
Download this image Figure 4: Beveridge curve: vacancy and unemployment rate
.png (36.8 kB) .xls (51.7 kB)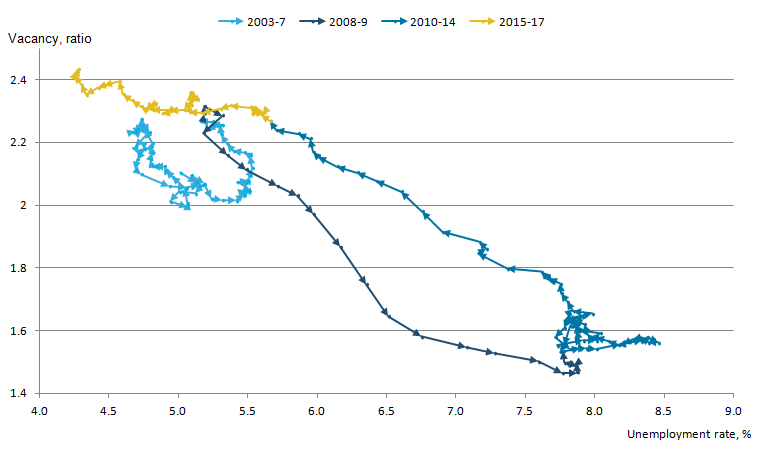
In addition to the cyclical movement along the curve during the economic downturn and a move in the opposite direction thereafter, there is another important observation to be made here. The post-downturn years have been associated with an outward shift of the Beveridge curve, in other words, a shift towards a higher vacancy rate for a given unemployment rate. Among the possible reasons, the skills mismatch is often considered an important factor2. This shift appears to have been reversed in recent years, as can be seen from the 2015 to 2017 segment of the curve (Figure 4).
Furthermore, the latest position on the chart is unprecedented even for the pre-downturn period. It is hard to measure skill mismatch and the precise impact it has on the Beveridge curve shifts. Compared with the years immediately after the downturn, the observable data, such as the educational attainment, may suggest an improved but nonetheless persistently high mismatch level.3
Notes for: Beveridge curve
- A general discussion of the post-economic downturn situation in Europe (PDF, 793.1KB) is available.
- For more information on certain dimensions of the skill mismatch in the UK, see Analysis of the UK labour market - estimates of skills mismatch using measures of over and under education: 2015.
5. Vacancy-to-unemployment ratio
Along with the Beveridge curve, the ratio of the total number of vacancies to the unemployment level is normally considered a measure of labour market tightness. Figure 5 shows that in 2016, the ratio had also surpassed the pre-downturn levels and was as high as 0.56, compared with the peak of 0.43 immediately before the economic downturn.
Figure 5: Unemployment level, vacancy level and unemployment-to-vacancy ratio
UK, seasonally adjusted, ratio, September to November 2002 to September to November 2017
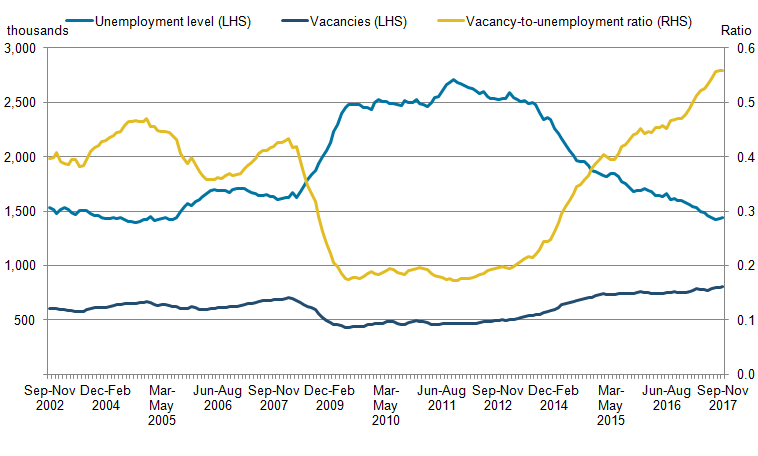
Source: Office for National Statistics, Labour Force Survey, Vacancy Survey
Download this image Figure 5: Unemployment level, vacancy level and unemployment-to-vacancy ratio
.png (21.9 kB) .xls (37.4 kB)
This measure also suggests an increasing tightness in the labour market, which continued into the latest time period despite some rise in the unemployment levels in the three months to November 2017. It should be noted that while this measure is a useful and widely-used indicator, any long-term comparisons of the vacancy-to-unemployment ratio should be made with caution because the relationship between these two may not be stable over a long period of time.
One further limitation of this approach is that its reliance on the level of unemployment does not reveal any information about the proportion of people supplying less labour than they would be willing to, such as working part-time involuntary. While the proportion tends to increase when the demand for labour falls, it is also subject to structural changes in the economy, which accumulate over time even in the absence of obvious shocks.
Despite these limitations, it can be seen from Figure 5 that the number of vacancies has been rising steadily throughout 2017, including the September to November period, where it was sufficient to outweigh the rise in unemployed in the vacancy-to-unemployment ratio. One possible explanation is that as low unemployment persists, employers find it harder to meet their demand for labour and fill the vacancies because there are fewer people looking for jobs. Alternatively, the demand cannot be met because the skills, or the location of those looking for jobs, does not match the employers’ needs. Indeed, it is likely that both effects exist in some proportion. In that regard, it may be useful to look at some of the industry specific data (see section 6).
Back to table of contents6. Vacancy level by industry
Figure 6 shows vacancy levels in a selection of industries associated with a variety of skill levels. The chart demonstrates that the longer-term trends have been varied. In most private sector industries, an initial steep fall in vacancies in 2008 to 2009 was followed by a broadly upward move but with considerably varying trajectories, with the vacancy levels in some industries remaining consistently below or close to the pre-downturn levels. However, as we turn to the recent periods, the upward trend becomes a common feature for the vast majority of industries.
Figure 6: Vacancy level by industry
UK, seasonally adjusted, September to November 2002 to October to December 2017
Source: Office for National Statistics, Vacancy Survey
Download this chart Figure 6: Vacancy level by industry
Image .csv .xlsHealth and social care sector exhibited the most profound growth in vacancy levels, even though public sector policies softened the initial decline in vacancies during the crisis. Here, the growth in vacancies outpaced the increase in the number of jobs. From the previous peak rate of 2.1 in 2008, the vacancy rate rose to 3.2 in October to December 2017 which represents an all time high since comparable records began in 2001. By way of context, the health sector and social work sector has a high concentration of high-skill workforce and the jobs in this sector are more likely to be occupied by women. The growing rate may reflect the constraints faced by the employers in meeting the demand for labour.
To take an opposite example, the number of vacancies in professional, scientific and technical services has also exhibited strong growth, with a rise in the vacancy level of 13.9% on the previous year in the October to December 2017 period. Since the end of 2014, the average quarterly number of vacancies in these industries has consistently exceeded that before the downturn. However, as evidenced by Figure 7, this increase was closely matched by the overall growth in the number of jobs in the sector. The vacancy rate, on the other hand, has not yet exceeded its 2008 value.
Back to table of contents7. Vacancy rate by industry
Various industries have persistently different average vacancy rates, making their direct comparison inappropriate. Rather than plotting the actual rates per industry, Figure 7 takes the pre-economic downturn rate in each selected industry as 100%.
Figure 7: Vacancy rate by industry
UK, seasonally adjusted, index, January to March 2008 to October to December 2017
Source: Office for National Statistics, Vacancy Survey, Labour Force Survey
Download this chart Figure 7: Vacancy rate by industry
Image .csv .xlsAlthough the lower unemployment means that there are fewer people looking for jobs in the economy, the tightening in the labour market is not felt in the same way across the entire economy. Rather, employers are finding it more difficult to fill specific, niche vacancies.
It should be remembered that the data on vacancies provide only some of the number of indicators of the labour market tightness, or indeed skill mismatches. In the December 2017 Labour market economic commentary, we published a brief overview of job-to-job moves and separations, which are equally useful in assessing the health of the labour market.
Back to table of contents