1. Main points
The slight increase in the number of unemployed people was insufficient to have a material impact on the unemployment rate, which stayed at 4.3% in the three months to January 2018.
The employment rate rose by 0.3 percentage points on the previous quarter to 75.3% in the three months to January 2018.
The last several years saw increases in the full-time-to-part-time and temporary-to-permanent employment ratios – a factor that may be affecting wage growth now.
Public sector workers also contributed to slower overall wage growth.
2. Unemployment
Latest estimates from the Labour Force Survey show that the number of unemployed people increased by 24,000 to 1.45 million in the three months to January 2018 when compared with August to October 2017. The slight increase in the number of unemployed people was insufficient to have a material impact on the unemployment rate, which stayed at 4.3% in the three months to January 2018, unchanged on the previous quarter.
Broken down by gender, the unemployment rate for women increased by 0.3 percentage points. The age breakdown does not reveal any obvious generational pattern, however, it is worth mentioning that unemployment is at a record low level for 25- to 34-year-old men.
Figure 1: Unemployment and employment rate
UK, seasonally adjusted, November to January 2006 to November to January 2018
Source: Office for National Statistics, Labour Force Survey
Download this chart Figure 1: Unemployment and employment rate
Image .csv .xls3. Employment
Employment continued to rise. In the three months to January 2018, there were 32.25 million people in work, which was 402,000 more than for the same period a year earlier and 168,000 more than the previous quarter. This change was driven by full-time employees, whose number rose by 182,000 to 20.29 million in the three months to January 2018, when compared with the previous quarter.
By way of context, Figure 2 plots quarter-on-quarter growth rates of real gross domestic product (GDP) and employment. Output depends on the amount of labour used in production; but the link between the two variables is less trivial than that relationship alone. Economic growth leads to job creation and therefore higher employment. However, growth can take place in less labour-intensive sectors, or sectors with limited ability to employ additional labour (for example, in a situation of skills mismatches).
Similarly, the job destruction rate tends to be lower than the fall in GDP at the time of recessions – regulatory framework and labour hoarding can considerably soften the impact of output contraction on the labour market.
Figure 2: Quarter-on-quarter growth rates of real gross domestic product and employment
UK, seasonally adjusted, March 1999 to December 2017
Source: Office for National Statistics
Download this chart Figure 2: Quarter-on-quarter growth rates of real gross domestic product and employment
Image .csv .xlsFor the aforementioned reasons, the growth in employment is positively correlated but lower than economic growth. This can be clearly seen in the years before the downturn where the quarter-on-quarter GDP growth is, on average, consistently above the changes in employment. Following the recession, however, the rates have converged.
As evidenced by the European Central Bank in 2016, similar but more moderate convergence was taking place in the Euro zone (PDF, 176.7KB). The correlation between output and employment growth was higher than previously, which could be partly explained by concentrated output growth in sectors with high labour intensity but weakly performing wages, such as services, trade and transport. The higher than average proportion of part-time workers in some of those growing sectors was also found to have contributed to slower overall wage growth in the Euro zone.
The following sections look at some of the changes in employment patterns that took place in the UK since the end of the last economic downturn.
Back to table of contents4. Trends in self-employment
Compared with the previous quarter, the total number of self-employed workers continued to fall, this time driven by a 28,000 decrease in the number of part-time self-employed out of the overall net fall of 27,000 (in other words, the number of full-time self-employed rose). The number of people in self-employment fell by 22,000 in November 2017 to January 2018, compared with the same period a year earlier.
However, the recent decline in the number of self-employed came after a prolonged period of rapid growth, particularly among those working part-time. Over the last decade – since November to January 2008 to the same period in 2018 – the number of part-time self-employed increased by 50%. The number of full-time self-employed was rising at a much slower pace (but still fast compared with the number of employees) leading to an increase of 16% over the same time period.
Such disproportionate growth in part-time workers remained a feature of self-employment. By way of context, the number of employees working full-time grew by 6.21% and part-time by 8.43% between November to January 2008 and November to January 2018. In other words, the overall change in the number of employees did not show signs of similarly substantial rebalancing between the working patterns.
Figure 3: Self-employed by working pattern
UK, seasonally adjusted, November to January 2006 to November to January 2018
Source: Office for National Statistics, Labour Force Survey
Download this chart Figure 3: Self-employed by working pattern
Image .csv .xls5. Wage growth, working pattern and contract type
While the UK economy expands, real wages continue to fall and continue to perform poorly compared with our European counterparts. The headline measure of unemployment, historically, has been used to interpret labour supply and is therefore heavily relied upon in explaining wage growth.
Simplistically, you could expect nominal wage growth to be relatively high, following the recent UK record low unemployment since 1975. The real wage growth may be harder to predict because inflation can be induced by various external pressures, such as the sterling depreciation, however, in the medium term, you could expect it to be positive in the existing economic climate. This has not been the case, with real wage growth staying between negative 0.6% and positive 0.6% excluding bonuses (or negative 0.6% percent and positive 0.5% including bonuses) during 2017, with little sign of acceleration towards the end of the year.
The puzzling coexistence of low unemployment and low wage growth is not a unique feature of the UK economy. To take one example, Australia also witnessed the tightening of its labour market in 2017. As in the UK, the wage growth remained very moderate. Evidently, the labour market is not responding to employment pressure in the same way as it had done before.
One obvious feature of the headline measure of unemployment is its failure to capture the full extent of underutilisation of labour. As we discussed in the October 2017 Economic Review, gradual changes in the labour force composition or labour contracts (among other factors) may have led to a shift towards more implicit forms of underutilisation of labour such as underemployment.
The data discussed in the September 2017 labour market economic commentary suggested a broadly downward trend in underemployment. The data published in February 2018 suggest a far more modest fall in the second half of 2017, compared with the same period in years between 2013 and 2016.
Perhaps more importantly, it remains the case that for any 100 people who work full time, the number of people who want to work more hours is higher now than it was prior to the economic downturn (11.9% in November to January 2018 and 9.1% on average in the decade between November to January 1998 and November to January 2008). What this suggests is that the underutilisation of labour may be to a lesser extent captured by unemployment, with a higher degree of underutilisation among people in employment.
Figure 4: Share of workers unable to find a full-time or permanent job among those working part-time or on a temporary contract
UK, seasonally adjusted, January to March 2006 to November to January 2018
Source: Office for National Statistics, Labour Force Survey
Download this chart Figure 4: Share of workers unable to find a full-time or permanent job among those working part-time or on a temporary contract
Image .csv .xlsTemporary workers represent another category that is worth considering in the context of wage growth. Using data from the Annual Survey of Hours and Earnings, we previously found that workers on fixed-term contracts were earning less than their counterparts on permanent contracts, taking into account their characteristics (such as age, tenure, industry they were employed in and so on). The research conducted by the European Commission also suggested a noticeable negative wage premium associated with being on a fixed-term contract (PDF, 564.4KB), a conclusion that held not only for the UK but also for most other European nations1.
Since the size of the workforce grew over time, Figure 4 looks at the number of workers on temporary contracts in relation to those on permanent contracts. Furthermore, we focus on one specific sub-group; those who could not find a permanent job. As you would expect, the period between March to May 2008 and June to August 2013 was characterised by an increase in the number of workers falling under this category.
Similar to the case of part-time workers who could not find a full-time job, the number of temporary workers who could not find a permanent job started decreasing thereafter but remained relatively high and is growing again – perhaps a sign of economic uncertainty. As indicated previously, on average, such workers would be earning less than their permanent counterparts, adjusted for job and personal characteristics.
Notes: Wage growth, working pattern and contract type
- The likelihood of being on a fixed-term contract is correlated with industry, skill and many other characteristics, meaning that the precise value of the negative premium is dependent on the assumptions used in the model. This makes it hard to estimate the value of the negative premium adjusted for relevant factors with statistical precision.
6. Public and private sector wage growth
In the previous commentaries, we looked at some of the other compositional factors that could affect wage growth. For example, a growing number of low-paid workers relative to the number of those with higher pay would exert a downward pressure on the median wage. The data in the February 2018 labour market economic commentary indicated that, on the contrary, the growth in employment was in fact centered on higher skilled and higher median wage occupations. At the same time, the most pronounced wage growth took place amongst low-skilled occupations, partly because of the increases in the National Minimum Wage and the National Living Wage.
The data on vacancies in the January 2018 labour market economic commentary showed that despite the falling number of people looking for jobs, employers in many industries did not appear to be finding it considerably more difficult to fill the vacancies, and therefore felt less pressure to raise wages. Consistent with that, in November 2017, the analysis of Annual Survey of Hours and Earnings (ASHE) data showed that accommodation and food, and transport and storage industries had the highest job creation, whilst having relatively poor-performing median wages.
Figure 5 : Public and private sector real wage growth
UK, regular pay growth, 3 month on 3 month, a year ago, seasonally adjusted, January to March 2006 to November to January 2018
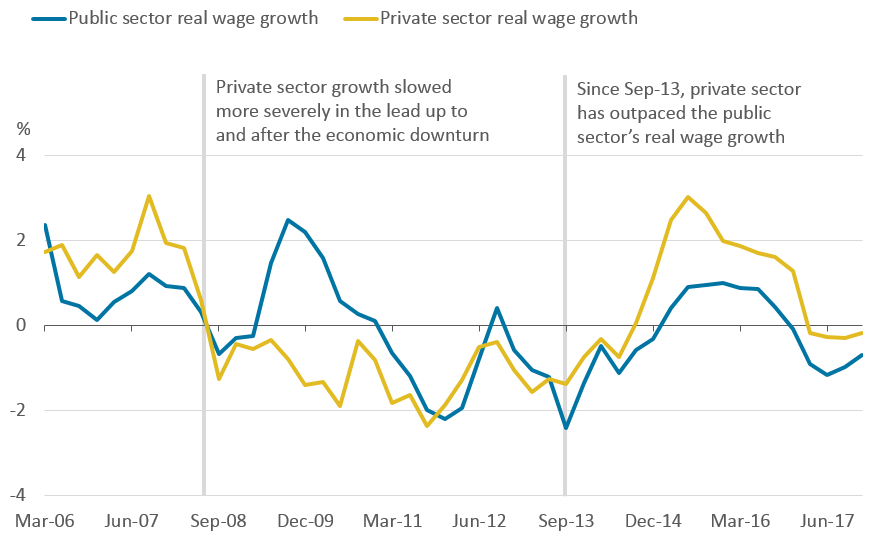
Source: Office for National Statistics, Labour Force Survey
Download this image Figure 5 : Public and private sector real wage growth
.png (56.2 kB) .xls (33.3 kB)
One particular category of employees whose wages are less responsive to the situation in the labour market are public sector employees. Figure 5 shows that since April 2014, the private sector has outpaced the public sector’s real wage growth. Public sector real wages have been negative since November 2016. In the private sector, they remained positive until February 2017.
A large proportion of public sector employees were subject to the public sector pay cap, preceded by temporary freezes. These restraints, which limited the pay rises to an average of 1% per year for most categories of public sector employees, have been in place since 2010. The rise in inflation therefore pushed the real wage growth in the public sector quicker and further into the negative zone.
Figure 6: Public and private sector employment
UK, Seasonally adjusted, March 2006 to December 20171
Source: Office for National Statistics, Labour Force Survey and returns from public sector organisations
Download this chart Figure 6: Public and private sector employment
Image .csv .xlsPublic sector employment represented only 16.6% of all in employment in December 2017. Furthermore, Figure 6 shows that employment in the public sector has been almost continuously falling, from 22.2% of all in employment in March 2010 to 16.6% in the latest period, a decrease of around 1.09 million workers2. Having said this, public sector workers, per capita, contributed more highly to the negative real wage growth than private sector workers.
Notes: Public and private sector wage growth
During this time period, there were a number of revisions to the classifications of companies which, in turn, had a considerable impact on employment figures. Such revisions may have been caused by change to the statistical and regulatory frameworks or legislation.
Note that the changes in stock, that is, a number of workers at a point in time, should not be interpreted as flows. For example, a nominal decrease in public sector employment does not necessarily lead to an increase in private sector employment, because this individual could leave the workforce or work in a non-profit industry.