Table of contents
- Main points
- Things you need to know about this release
- The deficit on trade in goods and services excluding erratic commodities widened by £0.8 billion in the three months to October 2017
- The trade in goods deficit with non-EU countries narrowed by £2.9 billion, while the deficit with EU countries widened in the three months to October 2017
- Increases in goods export and import volumes had a larger impact on goods values in comparison with prices when excluding oil and erratics, over the three months to October 2017
- Deficit on trade in goods and services excluding erratic commodities narrowed by £0.1 billion between September 2017 to October 2017
- What are the revisions to trade values since the last release?
- Links to related statistics
- Quality and methodology
1. Main points
Erratic commodities (including non-monetary gold) had a large impact on headline movements in the three months to October 2017; the total UK trade (goods and services) deficit excluding erratic commodities widened by £0.8 billion to £6.9 billion.
The trade in goods deficit with non-EU countries narrowed by £2.9 billion, while the deficit with EU countries widened by £1.2 billion in the three months to October 2017; excluding erratics, the deficit with EU countries widened by £1.9 billion due to a larger increase in imports.
Excluding oil and erratic commodities, imports and exports of goods increased by £2.8 billion and £1.7 billion respectively in the three months to October, which was due mainly to increases in import and export volumes, which grew at a faster rate than prices over the period.
The UK’s total trade deficit (goods and services) excluding erratic commodities narrowed by £0.1 billion between September 2017 and October 2017, due primarily to a decrease in goods imports of crude oil from non-EU countries.
Including erratic commodities, the total UK trade (goods and services) deficit narrowed by £2.7 billion to £5.0 billion in the three months to October 2017, due mainly to a narrowing of the trade in goods deficit with non-EU countries.
Data in this release have been revised from January 2016 to September 2017 for both trade in goods and services; most of the revisions to the total trade balance are relatively small and mainly upward, although July to September 2017 saw larger revisions.
2. Things you need to know about this release
Unless otherwise stated, all trade values discussed in this release are in current prices. The time series dataset also includes chained volume measures (series for which the effects of inflation have been removed) and these are indexed to form the volume series presented in the publication tables.
Data are supplied by over 30 sources, including several administrative sources; HM Revenue and Customs (HMRC) covering trade in goods is the largest. For trade in services, data are less timely than trade in goods estimates and sourced mainly from survey data and a variety of administrative sources. The services data are processed quarterly, so monthly forecasts are made to provide a complete trade total. The most recent monthly data can therefore be considered more uncertain.
Trade statistics for any one month can be erratic. For that reason, we recommend comparing the latest three months against the preceding three months and the same three months of the previous year.
Oil and other “erratic” commodities can make a large contribution to trade in goods, but often mask the underlying trend in the export or import values due to their volatility. The “erratics” series includes ships, aircraft, precious stones, silver and non-monetary gold. Non-monetary gold can have a particularly large impact on growth rates, due to the large volumes of gold traded on the London markets. Therefore, we also publish data exclusive of these commodities, which may provide a better guide to the emerging trade picture.
In accordance with the National Accounts Revisions Policy, data in this release have been revised from January 2016 for both goods and services.
The UK Statistics Authority suspended the National Statistics designation of UK trade on 14 November 2014. We have now responded to all of the specific requirements of the reassessment of UK trade and are in the final stages of providing evidence to the Authority. We are undertaking a programme of improvements to UK trade statistics in line with the UK trade development plan that will also address anticipated future demands. While delivering against this plan, we will continue to work with the Office for Statistics Regulation team to regain National Statistics status for UK trade statistics. We welcome feedback on this development plan.
Back to table of contents3. The deficit on trade in goods and services excluding erratic commodities widened by £0.8 billion in the three months to October 2017
The total trade deficit narrowed by £2.7 billion to £5.0 billion in the three months to October 2017 (Figure 1). This was due mainly to goods exports, which increased 3.8% (£3.2 billion) to £88.6 billion. Unspecified goods (particularly non-monetary gold) was the main contributor to the increase.
When erratic commodities are excluded, the value of the total UK trade deficit widened by £0.8 billion to £6.9 billion in the three months to October 2017. The widening excluding erratic commodities was due primarily to trade in goods imports increasing 2.9% (£3.3 billion) to £116.5 billion, which was offset slightly by a 0.5% (£0.2 billion) decrease in trade in services imports. Although trade in goods exports increased 1.7% (£1.4 billion) to £81.7 billion, the increase in imports was larger, therefore the total trade deficit excluding erratic commodities widened.
The main commodity contributors to the increase in imports excluding erratic commodities were oil, mechanical machinery and electrical machinery, which increased 7.1% (£0.6 billion), 3.1% (£0.4 billion) and 2.9% (£0.5 billion) respectively.
Figure 1: Three-month on three-month UK trade balances, April 2013 to October 2017
Source: Office for National Statistics
Download this chart Figure 1: Three-month on three-month UK trade balances, April 2013 to October 2017
Image .csv .xls4. The trade in goods deficit with non-EU countries narrowed by £2.9 billion, while the deficit with EU countries widened in the three months to October 2017
Exports of goods to non-EU countries increased while imports decreased, contributing to a narrowing of the deficit with non-EU countries by £2.9 billion to £9.0 billion, between the three months to July 2017 and the three months to October 2017. This follows a £4.0 billion widening of the deficit in the three months to July 2017, when exports decreased as imports increased.
In contrast, the trade in goods deficit with EU countries widened by £1.2 billion to £23.9 billion, due to imports increasing at a faster rate than exports. The widening of the EU trade in goods deficit follows two consecutive three-month periods when the deficit narrowed.
Exports of goods to non-EU countries increased 5.0% (£2.2 billion) to £45.2 billion in the three months to October 2017. Figure 2 shows this was due to increases in exports of unspecified goods (£1.4 billion), including non-monetary gold, and machinery and transport equipment (£0.9 billion), which also includes some erratic commodities.
The main contributors to non-EU machinery and transport equipment exports were aircraft, mechanical machinery and cars, which increased by 13.7% (£0.3 billion), 3.6% (£0.3 billion) and 5.0% (£0.2 billion) respectively.
Exports of goods to EU countries increased 2.5% (£1.1 billion) to £43.4 billion between the three months to July 2017 and the three months to October 2017. Exports of machinery and transport equipment, and unspecified goods were also the main contributors for EU exports: contributing £0.7 billion and £0.4 billion respectively.
The main contributors to EU machinery and transport equipment exports, were mechanical machinery and cars, which increased by 10.2% (£0.4 billion) and 10.3% (£0.3 billion) respectively.
Figure 2: Contribution of the value of goods exports to EU and non-EU countries to UK total goods exports, three-months to October 2017 on previous three-months to July 2017
Source: Office for National Statistics
Download this chart Figure 2: Contribution of the value of goods exports to EU and non-EU countries to UK total goods exports, three-months to October 2017 on previous three-months to July 2017
Image .csv .xlsImports of goods from EU countries increased by £2.3 billion (3.5%) to £67.3 billion, which was partially offset by a decrease in imports from non-EU countries of £0.7 billion (1.3%) to £54.2 billion in the three months to October 2017 (Figure 3).
The decrease in imports of unspecified goods (including non-monetary gold) from non-EU countries more than offset increases in other commodity imports from non-EU countries, which were mainly fuels, and machinery and transport equipment (particularly imports of ships and electrical machinery).
Increases in EU imports were due mainly to machinery and transport equipment, and chemical commodities, particularly medicinal and pharmaceutical products, which increased by 11.4%. Of machinery and transport equipment imports, mechanical machinery and electrical machinery were the largest contributors: increasing 9.0% (£0.5 billion) and 4.4% (£0.3 billion) respectively.
Figure 3: Contribution of the value of goods imports to EU and non-EU countries to UK total goods imports, three-months to October 2017 on previous three-months to July 2017
Source: Office for National Statistics
Download this chart Figure 3: Contribution of the value of goods imports to EU and non-EU countries to UK total goods imports, three-months to October 2017 on previous three-months to July 2017
Image .csv .xlsExcluding erratic commodities, the EU deficit widened further by £1.9 billion to £25.6 billion between the three months to July 2017 and the three months to October 2017, due primarily to EU imports increasing by 4.3% (£2.7 billion) to £66.1 billion, while exports increased by 2.0% (£0.8 billion) to £40.6 billion.
The non-EU deficit widened slightly by £0.06 billion to £9.2 billion, when excluding erratic commodities: due to similar increases in imports and exports. Overall, erratic commodities (including ships, aircraft, precious stones, silver and non-monetary gold), which are included in unspecified goods, and machinery and transport equipment, tend to have a larger impact on non-EU exports and imports in comparison with trade with EU countries. This is because erratic commodities traded with non-EU countries tend to be larger in value than erratic commodities traded with other EU countries.
Back to table of contents5. Increases in goods export and import volumes had a larger impact on goods values in comparison with prices when excluding oil and erratics, over the three months to October 2017
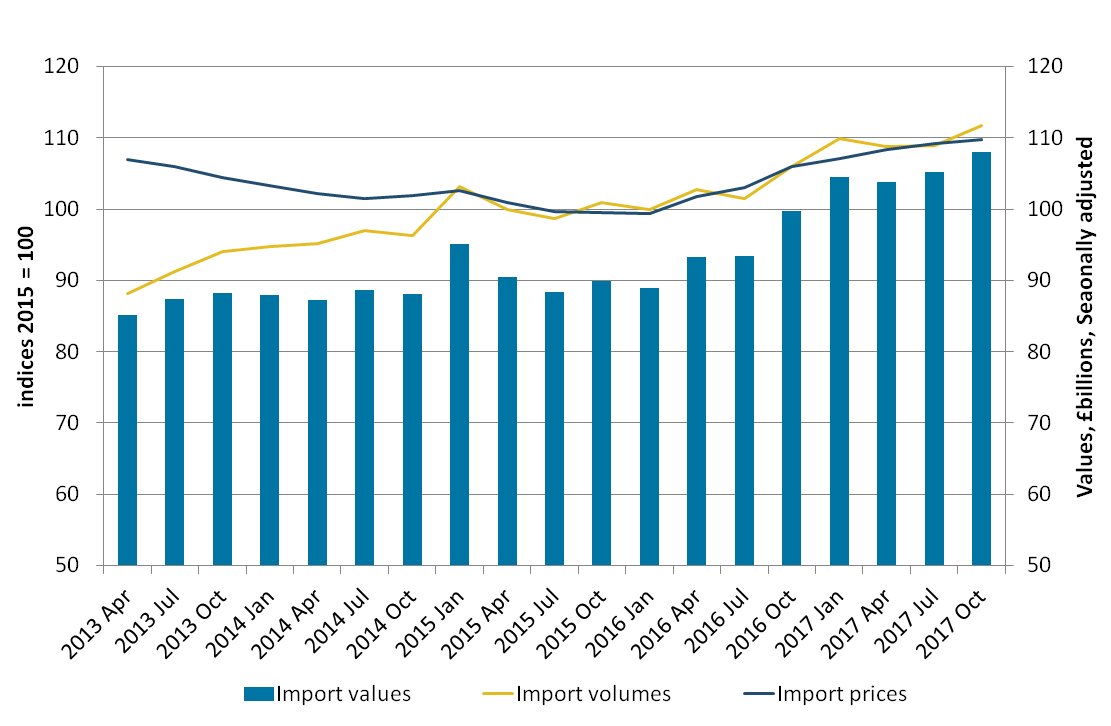
Total goods export volumes increased 3.2% in the three months to October 2017, which was the fourth consecutive and largest increase since January 2017. Import volumes increased 0.5% over the same period. Export and import prices increased 1.5% and 1.3% respectively, following a decrease in both prices in the three months to July 2017. The £3.2 billion (3.8%) increase in the value of total goods exports was therefore due primarily to volume movements, while the increase in total goods imports value of £1.6 billion (1.3%) was due mainly to price movements.
Figures 4 and 5 show the three-month on three-month time series excluding oil and erratics. This provides a more comprehensive picture of the underlying trade trend and impact on the trade balance, given the volatility of oil (due to the net import of oil in the UK economy) and erratic commodities.
Between the three months to July 2017 and the three months to October 2017, export volumes excluding oil and erratics increased by 2.3%, which was the fifth consecutive increase on a three-month on three-month basis. Import volumes excluding oil and erratics increased 2.6%, which was the second consecutive increase on a three-month on three-month basis. Export and import prices excluding oil and erratics increased 0.7% and 0.5% respectively.
The increase in trade in goods export and import values excluding oil and erratics, by 2.3% (£1.7 billion) to £73.9 billion and 2.6% (£2.8 billion) to £108.0 billion respectively, was therefore due largelyto increases in respective goods volumes excluding oil and erratics.
As a result of import volumes increasing by a larger proportion than export volumes, while prices remained relatively flat over the period, the goods excluding oil and erratics deficit widened by £1.1 billion to £34.1 billion. This coincides with a decrease in the value of sterling in the three months to October 2017.
While simple economic theory suggests a decrease in the value of sterling should result in a decrease in export prices (export prices increasing in competitiveness) and an increase in import prices, in practice the impact of a sterling change is likely to be much more complex. Our Economic review has detailed the economic theory of the expected impact of the sterling depreciation on export and import volumes and prices.
Although the increase in export prices may appear contrary to economic theory, it is important to note that export prices are based in sterling for the UK rather than foreign currency terms. As detailed in the Economic review, the increase in export prices (on a sterling basis) is likely to be largely attributable to the substantial amount of trade conducted on a foreign currency basis as price changes are lagged in the short-term – therefore it is possible there may be no change in the price in foreign currency terms.
Figure 4: three-month on three-month UK goods exports excluding oil and erratics values, volumes and prices, April 2013 to October 2017

Source: Office for National Statistics
Download this image Figure 4: three-month on three-month UK goods exports excluding oil and erratics values, volumes and prices, April 2013 to October 2017
.png (61.6 kB) .xls (18.9 kB)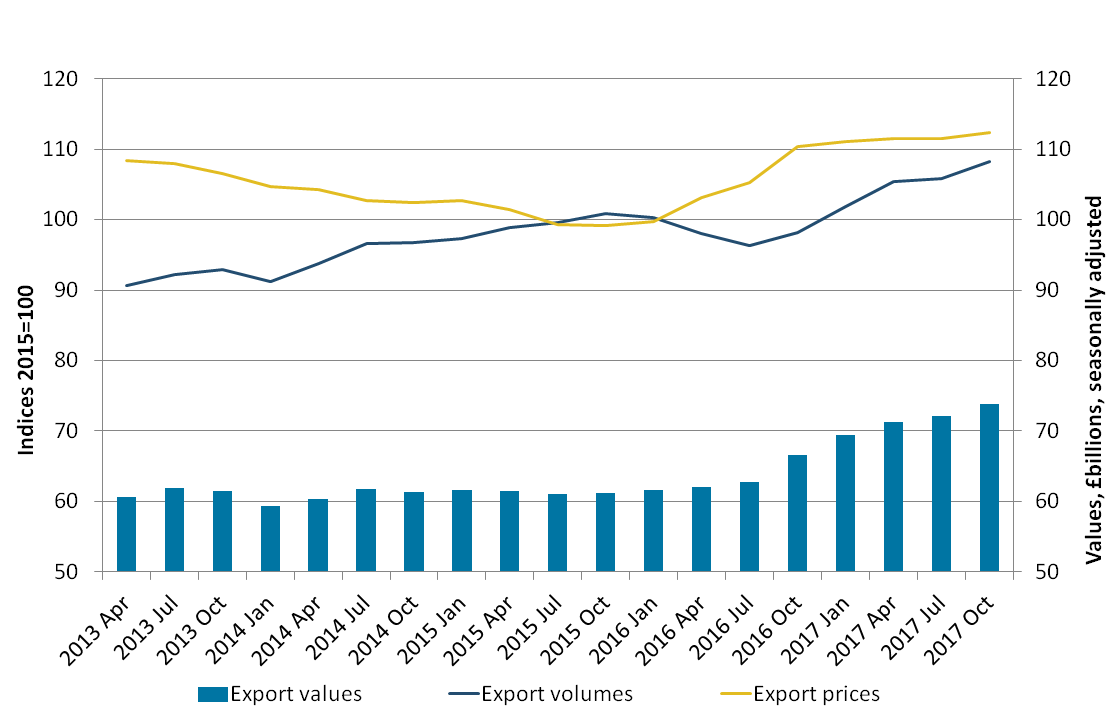
Figure 5: three-month on three-month UK goods imports excluding oil and erratics values, volumes and prices, April 2013 to October 2017
Source: Office for National Statistics
Download this image Figure 5: three-month on three-month UK goods imports excluding oil and erratics values, volumes and prices, April 2013 to October 2017
.png (68.5 kB) .xls (18.9 kB)
The volume of goods excluding oil and erratics exports to and imports from other EU countries increased 1.9% and 3.4% respectively in the three months to October 2017, while EU export and import prices increased 2.0% and 1.0% respectively.
Over the same period, the volume of goods excluding oil and erratics exports to and imports from non-EU countries increased 2.6% and 1.4% respectively, while non-EU export and import prices decreased 0.5% and 0.1% respectively. This coincides with fuels (mainly oil) export and import sterling prices increasing 11.7% and 9.6% respectively in the three months to October 2017. Oil and erratics generally have a larger impact on non-EU trade in comparison with trade with EU countries.
The 2.3% (£1.7 billion) increase to £73.9 billion in trade in goods export values excluding oil and erratics, was therefore due largely to increases in export volumes to non-EU countries as well as EU export prices. Evidence from the Economic review highlights that exports to the EU are weighted towards foreign currencies (61%) – especially the euro – while exports to non-EU countries are weighted towards sterling (51%). The stronger growth in EU exports prices therefore reflects movements in sterling trade prices driven by the larger amount of trade conducted in a foreign currency.
In addition, the 2.6% (£2.8 billion) increase in trade in goods import values excluding oil and erratics to £108.0 billion, was due largely to increases in import volumes from EU countries. As a result of EU import volumes increasing alongside EU import prices, trade with other EU countries had a large contribution to the goods excluding oil and erratics deficit widening (by £1.1 billion to £34.1 billion).
Back to table of contents6. Deficit on trade in goods and services excluding erratic commodities narrowed by £0.1 billion between September 2017 to October 2017
The total trade deficit (goods and services) deficit widened by £0.3 billion to £1.4 billion between September 2017 to October 2017; due primarily to trade in goods imports increasing 1.6% (£0.9 billion) to £55.1 billion. The increase in trade in goods imports was due primarily to unspecified goods (including non-monetary gold) from non-EU countries.
The UK’s total trade deficit (goods and services) excluding erratic commodities narrowed by £0.1 billion to £1.9 billion between September 2017 to October 2017, due mainly to a 0.4% (£0.2 billion) decrease in goods imports to £52.7 billion. The main contributor to the reduction in imports was a 17.5% (£0.3 billion) decrease in imports of crude oil from non-EU countries.
Back to table of contents7. What are the revisions to trade values since the last release?
In accordance with the National Accounts Revisions Policy, data in this release have been revised from January 2016 for both trade in goods and services (Figure 6).
Figure 6: Revisions to UK trade balances, January 2016 to September 2017
Source: Office for National Statistics
Download this chart Figure 6: Revisions to UK trade balances, January 2016 to September 2017
Image .csv .xlsMost of the revisions to the total trade balance are relatively small and mainly upward (narrowing of the deficit) from January 2016 to June 2017, although July to September 2017 saw larger revisions with the largest upward revision occurring in September 2017 (£1.6 billion). This is due primarily to upward revisions to exports of services and goods by £1.3 billion and £0.2 billion respectively, while revisions to imports were down by £0.1 billion in comparison.
Back to table of contents9. Quality and methodology
Trade is measured through both imports and exports of goods and/or services. Data are supplied by over 30 sources including several administrative sources, HM Revenue and Customs (HMRC) being the largest.
This monthly release contains tables showing the total value of trade in goods together with index numbers of volume and price. Figures are analysed by broad commodity group (values and indices) and according to geographical area (values only). In addition, the UK trade statistical bulletin also includes early monthly estimates of the value of trade in services.
Further qualitative data and information can be found in the attached datasets. This includes data on:
Detailed methodological notes are published in the UK Balance of Payments, The Pink Book 2017.
The UK trade methodology web pages have been developed to provide detailed information about the methods used to produce UK trade statistics.
The UK trade Quality and Methodology Information report contains important information on:
- the strengths and limitations of the data and how it compares with related data
- uses and users of the data
- how the output was created
- the quality of the output including the accuracy of the data