1. Overview of UK Trade
UK Trade statistics compiled by ONS has been one of the countries key economic indicators since statistics were first collected in 1697. Monthly Trade statistics, in the UK Trade bulletin are published 40 days after the reference period, with quarterly summaries currently published 3 months after the reference period.
Trade is measured through both imports and exports of goods and/or services. Data is supplied from over 30 feeder sources including a variety of admin sources, the main one being HMRC. Data from surveys such as ITIS (international Trade in Services) and IPS (Internal Passenger Survey) are provided in house both quarterly and annually. Some of the data suppliers provide data on a voluntary basis, whilst for others the provisions are mandatory, with MoUs (Memorandum of Understanding) and SLAs (Service Level Agreements).
This data is produced in two publication outputs:
UK Trade (Monthly)
UK Trade in Goods by Classification of Product by Activity (Quarterly)
The monthly release contains tables showing the total value of trade in goods together with index numbers of volume and price, figures analysed by broad commodity group (values and indices) and according to geographical areas (value only). In addition the UK Trade statistical bulletin also includes early monthly estimates of the value of trade in services.
The bulletin focuses more on trade in goods due to the coverage and comprehensiveness of the admin sources available around goods as well as its ability to be easily quantified and measured. Trade in services is harder to measure, and data is provided only on a quarterly or annual basis principally from ITIS. Monthly estimates are created using these quarterly data on services; therefore the data is less robust on a monthly basis compared with goods.
The quarterly bulletin uses the CPA (classification of product by activity) to map the data provided by HMRC to an applicable activity based on a Eurostat-produced correspondence table. A major revision of the CPA was adopted in April 2008. New concepts, such as originals and intellectual property products, have been introduced, and further detail has been added to reflect new products. This provides data in the format of tables.
All information included in the monthly UK Trade statistical bulletin is on a Balance of Payments (BoP) basis and is seasonally adjusted. Data appearing in the UK Trade statistical bulletins are also used as a direct input into the quarterly Balance of Payments and National Accounts
Questions it can help to answer:
What is the UK trade balance currently?
What is the value of UK trade in services/goods?
Does the UK export more to the EU or rest of the world?
How have UK trade changed over time?
2. UK Trade Comparable Statistics
Every effort is made to ensure that the series are comparable over time and annual time series are available back to at least 1970. Where possible, any changes to methodology are applied to the whole series to ensure comparability is maintained. However, the National Accounts revisions policy may mean that this is not always possible, or that a change is introduced over a shorter time period to minimise the discontinuity.
Back to table of contents3. Finding the data you need
UK Trade contains tables showing the total value of trade in goods together with index number of volume and price. Figures are analysed by broad commodity group (value and indices) and according to geographical areas (values only). It also includes early monthly estimates of the value of trade in services.
Quarterly Balance of Payments data contains total exports, imports and balance for goods and services. Trade in goods data includes good, beverages and tobacco, basic materials, oil, other fuels, semi-manufactured goods, finished manufactured goods and unspecified goods; data are available from 1998. Trade in services includes transport, travel, construction, insurance, financial, computer and information, intellectual property, other business, personal, cultural and recreational, government and manufacturing and maintenance services on a current price basis; data are available from 1997.
The quarterly United Kingdom Economic Accounts (UKEA) release contains exports, imports and balance totals for transactions with the European Union and the European Monetary Union at current prices. It also includes exports, imports and balances for trade with 9 non-EU countries: Brazil, Canada, China, Hong Kong, India, Japan, Russia, Switzerland and USA; data are available from 1999.
Annually, the Balance of Payments ‘Pink Book’ contains the most detailed trade in services data. For example, the ‘other business services’ category constrains estimates for research and development, legal services, businesses management/management consulting and engineering. The ‘Geographical breakdown of the current account’ (chapter 9) focuses on trade by partner country and shows a breakdown by type of service for a subset of 32 countries. The Pink Book also contains total trade in goods data for exports, imports and balances and contains breakdowns by a number of countries, including the top 50 export and import partners.
UK Trade in Goods by Classification of Product by Activity contains tables of exports and imports of goods by individual industry or activity.
Exporters and Importers contains the counts of businesses exporting and importing as well as the proportion of businesses involved in international trade. As part of the exporters and importers release, data is currently available by: type of trade (that is, import, export, goods, services), size of businesses (based on employment or turnover), structural industrial classification (SIC) at section and division level, ownership (foreign or domestic), age of business and by region and country.
International Trade in Services (ITIS) survey contains The UK's imports and exports of services analysed by product, industry and country. ITIS is the main source for Trade in Services imports and exports contributing to the Balance of Payments.
Data are collected at detailed commodity and country level for trade in goods by HM Revenue & Customs (HMRC) and statistics are available on their website. For more information on how trade in goods statistics are collected see data collection section (section 8 of our trade page).
Back to table of contents4. International comparisons
The UK National accounts comply with international standard set out in the European System of Accounts (ESA), Balance of Payments Manuals (BPM) and the Manual on Government Deficit and Debt (MGDD). These standards ensure that economic statistics produced by all EU member states are compiled in a consistent, comparable and reliable way.
Periodically, these manuals are reviewed to ensure that they continue to reflect economic and technological developments in domestic and global economies and meet user needs.
The implementation of ESA10 and BPM6 changed the way in which national accounts and balance of payments across the EU member states are produced and bring them into line with the worldwide System of National Accounts 2008 (SNA2008), already adopted by other parts of the world, including Canada, the United States and Australia.
International standards (BPM6 and ESA10) are used in the production of trade in goods data, therefore figures published by the UK should be comparable with the accounts of other countries, UK representation in working groups and committee meetings at the European Central Bank (ECB) and Eurostat (by ONS and HMRC), help ensure that changes are made in line with European Union member states.
The ONS release, which this report relates to, is the only source of UK Trade data on a BoP basis that comply with international definitions. Concepts and definitions are consistent between BoP, including trade in goods, and the rest of world accounts. The UK is unusual in that the BoP and rest of world accounts are compiled by the National Statistical Institute (ONS), using common data sources. In some countries, including most other EU Member states, responsibility for the compilation of BoP statistics lies with the Central Banks and responsibility for the National and Sector Accounts lies within the National Statistical Institute.
International organisations publish consistent trade data for all countries. More information can be found on Eurostat and International Monetary Fund (IMF) websites.
The Monthly UK trade bulletin provides the latest International Comparisons with the G7.
Back to table of contents5. Trade Asymmetry
In theory international trade information should be comparable across different statistical organisations and consistent between countries. For example the value of exports from the UK to Germany, measured by the ONS, should be equal to the value of imports from the UK recorded by Germany. In reality this is often not the case and the difference is known as a ‘trade asymmetry’. Although the ONS uses international guidelines aimed at minimising these differences in the coverage of trade data, there are still several reasons why differences may exist. For more information please see the HMRC Overview of Asymmetries which groups the differences into four main categories:
Methodological discrepancies, for example movements of specific goods, differences in recording leased goods or repairs and data disclosure control.
Valuation discrepancies, for example national thresholds on measured trade, exchange rate variations and determining statistical value or trade in value added.
Partner country discrepancies, for example transit and triangular trade.
Other factors such as the misclassification of commodity codes, fraud and reporting time lags.
HMRC also collect trade statistics, and so many of the issues presented in the HMRC overview document are also relevant to the ONS when making international comparisons of trade across different statistical organisations. This is an important consideration in the limited amount of analysis done on bilateral trade flows between countries in the UK trade publication.
ONS is working with other National Statistical Institutions and International Organisations on specific causes of asymmetries of bi-lateral trade analysis between particular countries. This is part of ongoing work to improve data on international transactions.
Back to table of contents6. Users and usage
The primary purpose of the UK Trade bulletin is to inform its users of the extent of export and import activity. Ever since statistics on exports and imports of goods were first collected in 1697, UK Trade has been one of the country’s key economic indicators and has a large contribution to the overall economic growth of the UK. The recording of UK Trade has expanded to record the import and export of both goods and services.
The main uses and users of UK Trade statistics
The main UK user of UK trade statistics are the Bank of England, the Department for International Trade (DIT), HM Treasury (HMT), HM Revenue and Customs (HMRC), the Department for Exiting the European Union (DExEU) and the Department for Business, Energy and Industrial Strategy (BEIS). International users include the European Central Bank, Eurostat, The International Monetary Fund (IMF), and the Organisation for Economic Co-operation and Development (OECD). Eurostat use UK figures to compile aggregate EU estimates, and the IMF collate data as a means of ensuring financial stability and sustainability. It is also used within ONS to contribute to other publications, such as the Pink Book, Gross Domestic Product (GDP), Quarterly National Accounts and Balance of Payments. Users also include businesses, academics and journalists who use the figures for economic analysis.
A number of the key figures in the UK Trade bulletin are used nationally to inform the government’s view of the UK economy. Different areas of government use different trade statistics, but trade exports are used to measure against the government’s target to reach £1 trillion of exports a year by 2020, as detailed in the 2012 budget. The most important of the aggregated are;
- Total Trade in Goods (imports, exports and balance)
- Total Trade in Services (imports, exports and balance)
- Oil (imports, exports and balance)
- Total Trade with the EU (imports, exports and balance)
- Total Trade with Non-EU (imports, exports and balance)
HMRC publish Overseas Trade Statistics (OTS) on the same day each month as the ONS UK Trade statistical bulletin. These aggregate estimates will differ slightly from those that are published in the Balance of Payments, as the two sets of data are compiled to different sets of rules. The BoP publication shows a high level picture of UK trade in goods, whereas the OTS publication shows a detailed picture of the UK’s trade in goods by commodity and partner country.
In the run up to the UK referendum on EU membership trade statistics were used extensively. ONS summarised the key information into a visual piece.
User Engagement
Key users of the UK Trade and Transfers statistics, such as the Office for Budget Responsibilities (OBR), HMT, HMRC, the Bank of England, BEIS, DIT, the Department for Exiting the European Union (DExEU) and the Foreign and Commonwealth Office (FCO) are in regular dialogue, including having representation (along with ONs representative) in the Balance of Payments User Group which meets quarterly.
Further engagement is sought through StatsUserNet where members can participate in discussions and critique statistical outputs. Additionally, a user survey of UK Trade and Transfers was recently made publicly available. The survey was available on the online survey forum ‘Survey Monkey’ and ran in March 2015 for approximately two weeks, closing on 29th March. This was publicised through various channels such as Twitter, StatsUserNet, the UK Trade bulletin and direct emails to our known users, and to those who have signed up for news on consultations. This was therefore emailed to around 30,000 directly. The survey results can be found on the Trade section of the ONS website.
The Quarterly Review of Accounts Stakeholder Group provides a forum for ONS and key stakeholders to engage with each other on the official estimates published in the Quarterly National Accounts (QNA) and UK Economic Accounts (UKEA). Please see the terms of reference for more information.
The ONS Economic Forum is a quarterly event aimed at city analysts, business economists, media and academic users. It provides an opportunity to discuss issues relating to the measurement of the economy and the range of ONS economic statistics that reflect this, including trade.
User engagement is a vital part of the work of ONS. We are seeking to improve engagement with users in order to understand their needs and inform where change is needed.
Current assessment of quality in respect of meeting user needs
The key area identified for improvement in the UK Trade release is to increase our coverage of trade in services, to provide a level of detail closer to that of trade in goods. This will be one of our main development aims over the remainder of this year in order to deliver a more balanced publication between goods and services, something we believe will be of great benefit to our users.
In our latest user engagement the majority of respondents stated that they were satisfied with the UK Trade statistical bulletin, but less than a third had used our UK Trade CPA publication.
Respondents were informed that we are considering stopping the quarterly CPA publication, but will continue to provide the data tables of the CPA breakdown each quarter, as supplementary tables to the main UK Trade release, a week after its publication. This would ensure that the data tables are very accessible, with the two datasets being linked together, it is hoped that this would increase the use of the CPA data tables by providing them to a wider audience. The majority of respondents who took part in the consultation indicated that the removal of the CPA bulletin would not impact them in a negative way. The UK Trade team are in discussion to finalise the plans with the CPA publication, and we will be sure to keep our users informed of any decisions.
Our users have informed us that the data tables are the most popular feature of our bulletins. With this in mind we have improved our user experience with our data by introducing an open dataset. This allows users to tailor the data tables based on their needs. This includes being able to select from a number of dimensions and create a bespoke table that allows easy analysis by our users. The open dataset is linked within the UK Trade release. Additionally, we are making improvements to our publication tables, including more descriptive titles to make it clearer to users what data they should expect to find in each publication table. Our users have suggested that they use short stories less than many of our other outputs; it is possible that this is due to being unaware of the output or that they are more focused on high level data tables. We feel short stories can be a very effective way to engage users with our lower level data and more fully utilise the data we have available, therefore we will continue to produce short stories (such as the economic performance of the UK's motor vehicle manufacturing industry), but reassess their uses and find ways of improving them at future user events.
In order to broaden the audience of the UK Trade publication we have created this guidance and methodology web page on the ONS website specifically for UK Trade. This features access to publications and historical releases as well as any methodological and quality information, short stories, glossaries, and future work. We have also started to post a link to our publication each month on StatsUserNet, in order to increase the awareness of such a useful statistical channel.
We are currently reviewing the statistical bulletin in order to make it more accessible to users, in particular to make it easier to see the headline figure for each month by discussing recent anomalies and interesting movements within trade. This will alert our readers to the fluctuations in trade at an industry level, on a month to month basis. We also plan to extend our publications to include international comparisons of UK Trade; this will enable users to compare the UK Trade position to that of other countries, both EU and non EU. We will also relate this data to the GDP figures for that month, and explain the impact and contributions that trade has made to it. This will allow users to see how influential UK trade is to our GDP.
Monitoring of user needs
An ONS Structural and International Statistics user insight group has been set up to assess how data releases (including the Trade publications) are being received by users, identifying where the greatest interest is. Templates to capture user feedback are being worked on along with analysis of social media engagement rates in order to focus our efforts in engaging with a wider community and tailoring our outputs to best meet user needs. As part of this assessment users are grouped into one of three categories; expert analyst, information forager and inquiring citizen. For example, an expert analyst may desire detailed information regarding exports to countries of the EU to inform analysis regarding the impact if the UK were to leave the EU. An information forager may have an interest in the type of goods or services imported or exported to different countries as supplementary data to an article they are writing. An inquiring citizen may enquire about revisions to data in the Trade bulletins, or unusual increases or decreases to a data series. The ultimate aim of the group is to analyse how we can improve the data we collect and the outputs we provide in order to better meet user needs. This is an ongoing project that will continue into 2016.
How to comment, question or offer feedback on the UK Trade release
We would welcome any feedback you might have and would be particularly interested in knowing how you make use of these data to inform your work. To provide feedback on the bulletin or to request further information, please contact us via email to trade@ons.gov.uk.
Back to table of contents7. Quality
The quality of the source data for trade in goods provided by admin sources is high in terms of the timeliness, comprehensiveness (level of detail) and the coverage. This level of quality compares with internationally.
By facilitating and attending user groups, as well as the use of a trade wide email box, the trade team is able to keep in constant contact with the users of the data, in order for them to relay the level of quality of the statistics that they require. As well as this, institutions that require our data, such as Eurostat, are heavily involved in influencing quality of our data through task forces meetings, and general communications through emails. Eurostat in particular have quality guidelines that the data provided to them need to comply to.
Each supplier of data has their own quality guidelines that the data must comply to. ONS work with the suppliers to ensure the quality but the majority of quality assurance is done prior to the data being sent. HMRC conduct their own quality assurance of the OTS data and produce Government Statistical Service quality report to inform their users of the quality of the data. The high level of quality of the data that we require is highlighted in the SLA’s that we have set up with our mandatory data suppliers. Once data has been sent through, Trade conducts their own analysis on the quality of the data and work in alignment with the supplier to discuss any issues or outliers they come across in the data. The trade branch liaises closely with their data suppliers to gain a better understanding of the data collection of quality assurance undertaken by them.
The quality of the data supplied by external companies is also documented in detail, and is often stipulated in the service level agreement between the ONS and the institutions. Any changes that take place in the collection of Administrative data must be discussed with the ONS before they take place. This is mandatory for those who supply data due to legal agreement, however, this is more difficult to monitor when data is supplied on a voluntary basis.
For more information, see the Quality and Methodology Information paper
Strengths and weaknesses of the UK Trade releases can be found in the UK Trade publication.
Risks
Work has identified three broad areas of risk for the UK Trade processing system, encompassing both Trade in Goods (TiG) and Trade in Services (TiS). These are:
- TiG CORD system reliability and flexibility
- Complexity of data sources and processing for TiS
- Staff turnover and ability to build knowledge and expertise
The first identified risk, involving the TiG systems can be categorised into 3 sections, a lack of ability to interrogate issues, making quality assurance (QA) more challenging; a number of workaround and manual fixes which add to the monthly processing time and the complexity with the system means it is more difficult to build knowledge and understanding. Specific improvements to functions and tasks have been identified and prioritised to manage the system risks.
The second risk is a result of the volume of data sources needed to compile TiS statistics. Data is sourced from both internal and external suppliers using a variety of formats. This makes quality assurance of the raw data and the initial processing more challenging. Again this risk is being managed with greater communication between suppliers and TiS staff and improvements to initial processing methods are being developed.
The third risk is not necessarily isolated to the Trade branch, but one that is present in any area where specialist technical knowledge is required. The risk is however heightened by the fact that the majority of staff working in the Trade branch have been in post for less than two years. Knowledge sharing plans have been developed which include shadowing and trade training workshops.
Accuracy of the Quarterly and Annual International Trade in Services (ITIS) survey
The sample for the quarterly ITIS survey is a reference list which is updated to try and ensure that the largest known units in each product group for both imports and exports of services are selected. This method is not ideal but it is the most appropriate method given the small size of the quarterly sample, whose size is around one thousand. This compares with over thirty thousand per month for the Monthly Business Survey (MBS). Also note that the ITIS data are rarer and harder to measure than turnover.
The annual ITIS survey uses the quarterly data as a fully enumerated stratum. It also has other sources such as the Annual Business Survey which is used for some industries with a small total ITIS. Essentially the ITIS data are stratified simple random sample using an expansion estimator so in principle estimating the standard errors should be straightforward.
Potential sources of error
As is any survey, there are numerous sources of error. Clearly, some sources of error are easier to estimate than others. For example, it is possible in principle to estimate standard errors from the ITIS data. However, response error is very difficult to measure.
Response or measurement error
Some measurement errors can be detected by editing and validation rules, one would expect that the most influential errors will be detected this way.
As noted above response error is hard to quantify, especially for surveys with complicated and detailed questionnaire such as the ITIS survey.
There are two main types of response error, namely point in time errors and timing errors. Point in time errors occur when the reporting unit returns an incorrect figure. Timing errors occurs when the correct value is reported, but at the incorrect time. Clearly the latter is more important for the quarterly survey due to its greater frequency. The Balance of Payments and International Investment Position Manual Sixth edition (BPM6) states:
“Broadly, the time of recording could be determined on four bases: the accrual basis, the due-for payment basis, the commitment basis, and the cash basis. Other timing basis, such as physical movement or administrative process may be used in some data sources. The accrual basis is used in the international accounts…”
Thus the ITIS data are required accrual basis, and the ITIS survey questionnaire states that figures are required on an accrual basis. However, it is clearly possible that the respondent misses the note or even does not understand what is meant by this. As notes previously, this is more likely to be a problem for the quarterly ITIS survey.
Processing error
Data for the survey paper questionnaires are taken on to the computer manually. Therefore there is scope for processing error when typing in the data. The data are validated so we expect the most important processing errors will be picked up. The survey questionnaires are scanned so that they may be viewed at a later date and the data may be checked against the original questionnaire if required.
Sampling error
The standard errors of the Annual ITIS survey are estimated using a stratified expansion estimator. The equation for the variance is as follows:
Equation for calculating the variance for the Annual ITIS survey

Download this image Equation for calculating the variance for the Annual ITIS survey
.png (29.6 kB)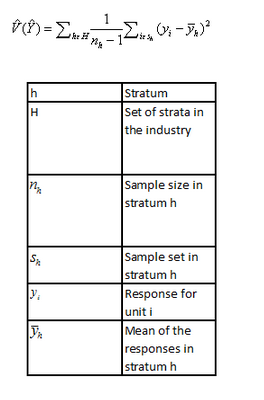
Note that the data above are winsorised prior to estimation, and some data are imputed.
Non response error
From the quarterly survey, we use imputation for non-responders. This implies that there are differences between the true value and the imputed values. This is a common source of error in business surveys. We use previous data in the imputations for each unit when such information is available.
One component of the total ITIS is the Annual Business Survey. Data from this survey are used to provide estimates for industries with small ITIS. The method used to compensate for non response in this data is to use group mean imputation.
The Annual ITIS survey uses a mixture of methods for treating non response, due to the different sources. Both weighting and imputation are used.
Estimation and Selection Error
For the quarterly data, a non-probability sample is used as notes previously. Because units are selected in some cases using previous survey returns, there is an element of informative sampling. That is, the survey membership cannot be determined by information on the frame (i.e. the IDBR).
This means that the model based approach may be biased because the model that holds for the sample data may be not representative of the non-sampled data. Additionally, the estimator assumes that he ratio model holds for the whole population of interest, which may not be the case.
For many product groups, the achieved sample size can be quite small, so there is a lot of scope for estimation error if the model does not hold.
Regarding the Annual ITIS survey, the information sampling still occurs, so there will be a bias despite the use of the expansion estimator. Sample membership still is determined on the basis of returned information. Consider the case of a unit which has high ITIS which has never been selected for ITIS surveys. Assume for simplicity that the industry and size-band (stratum) has been unchanged. Whether the unit is selected depends on the inclusion probability associated with it, and also how long it has existed. A unit with a small probability of selection may be selected for a long time. Thus the selected sample is not necessarily representative of the population. Also, in the first year of selection the unit may have a design weight, which will fall to one when it is forced into the sample in the following year.
Apportionment error
The data from the Annual Business Survey are not collected with the same detail as the ITIS survey. Therefore, these data are apportioned out across products and countries using proportions obtained from related in the ITIS surveys. This is not ideal since the proportions may not be appropriate for all the estimates. However, since the ABS data used are relatively small, this should not be a major source of error overall.
Keeping respondents’ data confidential
Confidentiality protection requirement by law and Government Statistical Service (GSS) policy
The need to keep records of individuals, businesses or events used to produce official statistics confidential is enshrined in law. However, this does not prevent release of anonymised or aggregated data.
The code of Practice for Official Statistics and the National Statistician’s guidance: Confidentiality of Official Statistics provide the Government Statistical Service (GSS) policy framework for official statistics in this regard. The Code of Practice guarantees confidentiality to those who provide private information for the production of Official Statistics. Principle 5 of the Code states:
Private information about individual person (including bodies corporate) compiled in the production of official statistics is confidential, and should be used for statistical purposes only.
Furthermore, ONS surveys are conducted on behalf of the UK Statistics Authority, and all outputs are subject to Section 39 of the Statistics and Registration Service Act (2007).
Business surveys operating within the United Kingdom are governed under the Statistics of Trade Act (1947). This states that tables should not be published that would disclose any information relating to an individual business, unless there is expressed consent in writing from that business.
ONS Confidentiality pledge
The confidentiality pledge is an assurance of confidentiality given to survey respondents
All the information you provide is kept strictly confidential. It is illegal for us to reveal your data or identify your businesses to unauthorised persons.
Statistical disclosure control and ONS
The statistical Disclosure Control Policy sets out the standards for safeguarding the information provided in confidence to ONS. ‘Disclosure control’ refers to the methods that reduce the risk that confidential information is published in any official statistics. These methods are applied if ethical, practical or legal considerations require the data to be protected. Disclosure control involves modifying data so that the risk of identifying individuals is reduced, but at the same time attempts to find a balance between improving confidentially protection and maintaining and acceptable level of quality in the published data.
Identifying disclosive data for UK Trade
Statistical disclosure control is applied to the UK Trade data before publication. All data used to compile the trade statistics are used in-line with statutory obligations. We follow the rules of the feeder source. For example:
- HMRC Suppressions Policy states that the disclosive nature of their data requires them to aggregate potential disclosive data to a higher level of detail so that inference on individual businesses cannot be made
- International Trade in Services explains to their respondents that data is treated with confidentiality under legal requirements (The Statistics of Trade Act) and disclosure rules are applied to the data
- IPS explains to their respondent that the information provided is treated as strictly confidential as directed by the Code of Practice
The trade team has also offered their expertise with using a range of administrative sources to inform the Admin Data Program in regards to engaging with the data suppliers.
Back to table of contents8. Data collection and publication
UK Trade Data Collection, Sources, Revision and UK Trade publication
UK Trade is compiled using feeder data sources that are supplied for the UK Trade publication. Data is supplied from over 30 feeder sources, including a variety of administrative data sources, the main one being HM Revenue and Customs (HMRC).
Data sources
Trade in Goods
The source for data on trade in goods with EU member states is Intrastat. (Intrastat is the system for collecting statistics on trade in goods between European Union member states). The Intrastat system has applied since 1993, with minor variations, in all EU member states. In the UK all VAT registered businesses are required to complete two additional boxes on their VAT returns; which are normally submitted quarterly. These show the total value of exports of goods to customers in other member states (dispatches) and the total value of imports of goods from suppliers in other member states (arrivals).
In addition, those who trade in the EU above the Intrastat exemption threshold in force during the year must also complete a monthly Supplementary Declaration (SD). The thresholds are currently £1.5 million for arrivals and £250,000 for dispatches. These thresholds are reviewed annually.
The source for data on trade in goods with non-EU countries is Extrastat. In general, the figures for trade with non-EU countries show the trade as declared by importers and exporters or their agents and for which documentation had been received and processed by HMRC during the month. Under the procedures for control of exports, the principle is the same – namely that goods cannot be cleared for export until a Customs declaration has been made. Traders can, if they wish, submit a simplified declaration so that the goods can be exported, which has to be followed within 14 days after date of shipment with a complete export declaration. The processing of these complete export documents begin three working days before the end of the calendar month (two days for December). Thus, the export statistics compiled for a month (which are based on the date of receipt of the complete export documents) do not correspond with goods actually shipped in the calendar month.
In general, the figures for trade with non-EU countries show the trade as declared by importers and exporters or their agents and for which documentation has been received and processed by HMRC during the month.
Merchanting estimates are supplied by ONS’ ITIS (International Trade in Services) survey. More information on the ITIS survey can be found under the Trade in Services section below.
For nonmonetary gold, the Bank of England provides data from the six gold clearers in the London Bullion Market. These data show net exports of nonmonetary gold that is held as a store of wealth in allocated accounts. To avoid disclosing the activity of individual gold clearers, the raw data cannot be presented. Therefore a smoothing method is applied. More information on nonmonetary gold can be found in the article published on the ONS website.
Trade in Services
The exports and imports of service cover different sector categories. These categories are:
- Manufacturing on physical inputs owned by others
- Maintenance and repair services
- Transport (Sea, Air, Postal and Other) – Passenger, freight and other,
- Travel (Business and Personal)
- Construction services
- Insurance and pension services
- Financial services
- Telecommunication, computer and information services
- Intellectual property
- Other business services (other trade-related services; operational leasing services; miscellaneous business, professional and technical services)
- Personal, cultural and recreational services (Audio-visual & related services; other personal, cultural and recreational services), and
- Government services
The major survey source for many of the services categories is the International Trade in Services (ITIS) survey. The ITIS survey of businesses covers total exports and imports of services broken down by 52 products and the country of destination/origin. Sample size is 14,000 businesses annually. The sampling methodology comprises a large component comes from businesses sampled from the IDBR. These businesses belong to industries known to have a higher likelihood of trading overseas and include activities such as computer services, the performing arts, wholesaling and sport. This is supplemented with information from the Annual Business Survey. The question asks the contributor to indicate if international trade in services is undertaken and the total value. The more consistent element of the survey comes from those contributors known to have International trade in services the Known Traders. These can remain in annual ITIS or if they grow large enough can be transferred to quarterly ITIS.
The ITIS survey is used in conjunction with sources such as the International Passenger Survey (IPS), which is a border survey based on face to face interviews with a sample of passengers travelling via the principal airports, sea routes and the Channel Tunnel. Chamber of Shipping (CoS) conducts surveys into its members’ participation in foreign trade and data from the CoS are uplifted to account for UK sea transport companies who are not members using estimates for the gross tonnage of the UK fleet for different types of ship. Information on the financial services sector is supplied by the Bank of England, the Baltic Exchange, ITIS and other UK National Statistics (NS) surveys. Financial Services Authority, Lloyds of London and NS surveys supply insurance data.
Estimates of exports and imports of services are based on large number of administrative sources including the Civil Aviation Authority (CAA), Ministry of Defence, Commercial Bar Association, Baltic Exchange, British Airways Authority (BAA), the National Air Transport Service (NATS), Gatwick Airport, Manchester Airport, Texaco, BP, ExxonMobil, Trinity Lighthouse Service, HM Immigration, Gambling Commission, Financial Services Authority and Royal Mail. These are annual and quarterly and accessed on a regular basis.
UK Trade Publication
UK Trade is published on a monthly basis 40 days after the reference period. This release contains tables showing the total value of trade in goods together with index numbers of volume and price. Figures are analysed by broad commodity group (values and indices) and according to geographical areas (values only). In addition the UK Trade statistical bulletin also includes early monthly estimates of the value of trade in services.
As more information becomes available on trade in services this bulletin will focus on the values, volumes and geographic breakdown in a 3 monthly cycle described below:
| Month | Trade in Service detail |
|---|---|
| March, June, September and December | Focus on the estimated Quarterly change in exports and imports of services by the main type of service. |
| April, July, October, January | Focus on trade in services in volume terms. |
| May, August, November, February | Focus on trade in services with EU and selected Non-EU countries. |
Every monthly release features data from the reference period in question as well as a rolling 3 month average for the three previous months. The reference period at the end of every quarter (March, June, September and December) features quarterly analysis as well as the standard monthly. The December publication, which is released in February, has annual analysis.
We also publish the UK Trade in Goods by Classification of Product by Activity (CPA) on a quarterly basis. Due to feedback from our users during a consultation, we will no longer provide commentary alongside the data tables.
One way in which we have improved our users experience with our data has been the introduction of an ‘Open Dataset’ that allows users to tailor the data tables based on their needs. This includes being able to select from a number of dimensions and create a bespoke table that allows for easy analysis for our users.
Publications of the UK Trade results, and a link to the Open Dataset, are available on the UK Trade release page.
Ad-hoc requests
The UK Trade team also deal with a variety of ad hoc queries and data requests with accuracy in a timely manner. These requests include requests for details of agricultural imports and exports as a proportion of total imports and exports for the UK’s trade with EU and Non-EU, breakdowns of Insurance and Financial Services data, including breakdowns by Country; EU and World totals and by “Type of Service”. Ad-hoc requests are received frequently, with the UK Trade team providing bespoke data tables and information to further help and inform users. Statistical data and analysis for UK Trade statistics that have not been included in our standard publication are available under the Economy section of these published ad-hoc data and analysis pages on the ONS website.
Please be aware that your request may fall under new charge rates that have been implemented for ad-hoc requests:
Revisions Policy
The Office for National Statistics (ONS) ensures that published estimates are as accurate as possible. However if significant changes are made to source data after publication, then estimates will be revised. The ONS has a clear policy on how revisions are handled across the organisation.
Revisions
Revisions usually arise from either the receipt of additional data from our administrative sources or the correction of errors to existing data.
A table showing the size of revisions is published alongside the Statistical Bulletins and revised estimates of significant magnitude will be highlighted and explain in the statistical release.
Back to table of contentsYou might also be interested in:
- UK Trade releases
- UK Balance of Payments releases
- UK Economic Accounts releases
- Quarterly National Accounts releases
- UK Trade in Goods by Classification of Product by Activity releases
- UK Trade Charge Rates
- Published ad hoc data: Economy
- Balance of Payments Overview
- Who does the UK trade with? - Explorable Maps
- Pink Book releases