Table of contents
- Main points
- Things you need to know about this release
- UK current account deficit widens
- Narrowing trade deficit due to increase in exports of goods
- Increased investment income payments widens deficit on primary income account
- Financial account shows a net inflow to the UK
- International investment position
- Quality and methodology
1. Main points
The UK’s current account deficit was £23.2 billion (4.6% of gross domestic product) in Quarter 2 (Apr to June) 2017, a widening of £0.9 billion from a revised deficit of £22.3 billion (4.4% of gross domestic product) in Quarter 1 (Jan to Mar) 2017.
The widening in the current account deficit was driven by a widening to the deficit on primary and secondary incomes, which widened £1.4 billion and £1.9 billion respectively; these were mostly offset by a narrowing of the deficit on trade in goods which narrowed £2.3 billion in Quarter 2 2017.
The primary income deficit widened to £10.2 billion in Quarter 2 2017 due to foreign earnings on direct investment and portfolio investment in the UK increasing more than UK earnings on direct investment and portfolio investment abroad between Quarter 1 2017 and Quarter 2 2017.
The total trade deficit narrowed to £6.5 billion in Quarter 2 2017, primarily due to increased exports of trade in goods of which; exports of chemicals increased by £1.1 billion and exports of oil increased by £0.8 billion.
The international investment position shows UK net liabilities of £101.2 billion at the end of Quarter 2 2017.
2. Things you need to know about this release
In accordance with the National Accounts Revisions Policy, data in this release have been revised from Quarter 1 (Jan to Mar) 1997. In addition, the current account has been revised back to Quarter 1 (Jan to Mar) 1974. This is to incorporate the reclassification of the UK abatement in secondary income and to ensure that the trade account is consistent with gross domestic product (GDP).
A detailed assessment of indicative changes to the Balance of Payments and International Investment Position annually for 1997 to 2017 can be found in an article published on 29 September 2017.
A brief introduction to the UK Balance of Payments provides an overview of the concepts and coverage of the UK Balance of Payments using the Balance of Payments Manual sixth edition.
The Balance of payments (BoP) QMI Quality and Methodology Information document is available.
Also available is an overview of how movements in foreign exchange rates can impact the balance of payments and international investment position.
Back to table of contents3. UK current account deficit widens
In Quarter 2 (Apr to June) 2017, the UK current account deficit was £23.2 billion and equates to 4.6% of gross domestic product (GDP) at current market prices. This was a widening from a revised deficit of £22.3 billion (4.4% of GDP) in Quarter 1 (Jan to Mar) 2017 (Figure 1).
Figure 1: UK balances as a percentage of gross domestic product
Quarter 3 (Jul to Sept) 2014 to Quarter 2 (Apr to June) 2017
Source: Office for National Statistics
Notes:
- Q1 refers to Quarter 1 (Jan to Mar), Q2 refers to Quarter 2 (Apr to June), Q3 refers to Quarter 3 (July to Sept) and Q4 refers to Quarter 4 (Oct to Dec).
Download this chart Figure 1: UK balances as a percentage of gross domestic product
Image .csv .xlsThe widening in the current account deficit was driven by an increase to the deficit on primary income to £10.2 billion (or 2.0% of GDP) in Quarter 2 2017, compared with a revised deficit of £8.8 billion (or 1.7% of GDP) in Quarter 1 2017 (see section 5 for more information). Additionally there was a widening in the deficit on secondary income to £6.5 billion in Quarter 2 2017 compared to a deficit of £4.6 billion in Quarter 1 2017 due to increased payments by general government. This was offset by a narrowing to the deficit on trade in goods which narrowed £2.3 billion to £31.7 billion or 6.3% of GDP. This was due to an increase in the exports of goods which increased £2.9 billion in Quarter 2 2017 (see section 4 for more information).
Notes for: UK current account deficit widens
- Throughout this release Quarter 1 refers to January to March, Quarter 2 refers to April to June, Quarter 3 refers to July to September, and Quarter 4 refers to October to December.
4. Narrowing trade deficit due to increase in exports of goods
Figure 2: UK trade in goods and services balances (seasonally adjusted)
Quarter 3 (Jul to Sept) 2014 to Quarter 2 (Apr to June) 2017
Source: Office for National Statistics
Notes:
- Q1 refers to Quarter 1 (Jan to Mar), Q2 refers to Quarter 2 (Apr to June), Q3 refers to Quarter 3 (July to Sept) and Q4 refers to Quarter 4 (Oct to Dec).
Download this chart Figure 2: UK trade in goods and services balances (seasonally adjusted)
Image .csv .xlsThe total trade deficit narrowed by £2.4 billion to £6.5 billion in Quarter 2 (Apr to June) 2017, predominantly due to the narrowing of the deficit on trade in goods which narrowed by £2.3 billion in Quarter 2 2017 to a deficit of £31.7 billion.
The narrowing in the trade in goods deficit was due to exports increasing more than imports. Exports of goods increased by £2.9 billion to £86.4 billion in Quarter 2 2017; of which, exports of semi-manufactured goods increased by £1.3 billion which was mainly due to exports of chemicals increasing by £1.1 billion. Exports of oil increased by £0.8 billion to £8.3 billion which is the largest level since Quarter 2 2014. Exports of unspecified goods and exports of other fuels both increased by £0.3 billion along with smaller increases elsewhere.
Imports of goods increased £0.6 billion in Quarter 2 2017 with imports of semi-manufactured goods increasing £1.3 billion and imports of finished manufactured goods increasing £0.7 billion which were offset by decreases elsewhere.
The trade in services surplus increased by £0.1 billion to £25.2 billion in Quarter 2 2017 (Figure 2), this was due to imports increasing £0.3 billion and exports increasing £0.4 billion.
Notes for: Narrowing trade deficit due to increase in exports of goods
- Throughout this release Quarter 1 refers to January to March, Quarter 2 refers to April to June, Quarter 3 refers to July to September, and Quarter 4 refers to October to December.
5. Increased investment income payments widens deficit on primary income account
Figure 3: UK primary income account balances (seasonally adjusted)
Quarter 3 (Jul to Sept) 2014 to Quarter 2 (Apr to June) 2017
Source: Office for National Statistics
Notes:
- Q1 refers to Quarter 1 (Jan to Mar), Q2 refers to Quarter 2 (Apr to June), Q3 refers to Quarter 3 (July to Sept) and Q4 refers to Quarter 4 (Oct to Dec).
Download this chart Figure 3: UK primary income account balances (seasonally adjusted)
Image .csv .xlsThe primary income deficit widened £1.4 billion in Quarter 2 (Apr to June) 2017 to £10.2 billion (Figure 3), with payments rising by £3.0 billion and receipts increasing by £1.6 billion. The widening of the deficit in Quarter 2 2017 was primarily due to increased payments on portfolio investment which increased £1.3 billion which widened the balance on portfolio investment to a deficit of £11.4 billion. This was due to earnings paid to foreigners on UK debt securities increasing by £1.0 billion along with earnings paid to foreigners on UK equity securities increasing by £0.4 billion in Quarter 2 2017.
In addition, UK net foreign direct investment (FDI) earnings decreased over Quarter 2 2017 owing to the value of debits increasing by more than that of credits over the quarter.
The value of FDI earnings generated by UK investors abroad (credits) in Quarter 2 2017 saw a slight increase from the value reported in Quarter 1 (Jan to Mar) 2017. This continues the upward trend seen since Quarter 4 (Oct to Dec) 2015, which has been supported by both an improvement in rates of return and the depreciation of sterling over 2016. More detail on the impact of sterling’s depreciation on Balance of Payments can be found in the UK economic review July 2017. The value of FDI credits during the first half of 2017 is comparable to the levels seen in 2014 (around £18.6 billion per quarter).
The value of earnings generated by overseas investors on UK FDI (debits) has increased during the first two quarters of 2017, although remains in line with values recorded since Quarter 4 2015 fluctuating between £13.5 and £16.7 billion.
The comparatively smaller increase in FDI credits (£0.6 billion) between Quarter 1 and Quarter 2 2017 relative to FDI debits (£1.1 billion) has resulted in net FDI earnings (credits minus debits) decreasing by £0.5 billion to £3.0 billion. Despite the fall in the value of net FDI earnings between the first two quarters of 2017, the balance remains above the levels recorded in the final two quarters of 2016.
Figure 4: Quarterly foreign direct investment earnings (seasonally adjusted)
Quarter 2 (Apr to June) 2011 to Quarter 2 (Apr to June) 2017
Source: Office for National Statistics
Notes:
Q1 refers to Quarter 1 (Jan to Mar), Q2 refers to Quarter 2 (Apr to June), Q3 refers to Quarter 3 (July to Sept) and Q4 refers to Quarter 4 (Oct to Dec).
Download this chart Figure 4: Quarterly foreign direct investment earnings (seasonally adjusted)
Image .csv .xlsWe have published more detailed analysis of FDI statistics in a review of UK FDI statistics, which explores some of the factors behind the trends in implied rates of return and the impact of exchange rate changes on UK FDI.
Notes for:Increased investment income payments widens deficit on primary income account
- Throughout this release Quarter 1 refers to January to March, Quarter 2 refers to April to June, Quarter 3 refers to July to September, and Quarter 4 refers to October to December.
6. Financial account shows a net inflow to the UK
Figure 5: UK financial account balances (not seasonally adjusted)
Quarter 3 (Jul to Sept) 2014 to Quarter 2 (Apr to June) 2017
Source: Office for National Statistic
Notes:
- Q1 refers to Quarter 1 (Jan to Mar), Q2 refers to Quarter 2 (Apr to June), Q3 refers to Quarter 3 (July to Sept) and Q4 refers to Quarter 4 (Oct to Dec).
Download this chart Figure 5: UK financial account balances (not seasonally adjusted)
Image .csv .xlsThe total financial account showed a net inflow (that is, more money flowing into the UK) of £11.7 billion in Quarter 2 (Apr to June) 2017 compared with a revised net inflow of £16.5 billion in Quarter 1 (Jan to Mar) 2017 (Figure 5), primarily due to a large net inflow of other investment.
In Quarter 2 2017, direct investment recorded a net outflow (that is, more money flowing out of the UK) of £14.7 billion. Within direct investment the UK was a net investor abroad in equity capital of £16.1 billion, the highest since Quarter 1 2011 when it was £19.4 billion. There was also disinvestment by foreign investors in UK equity capital of £1.5 billion, the largest disinvestment since records began in 1987.
Portfolio investment recorded a net outflow (that is, more money flowing out of the UK) of £11.0 billion in Quarter 2 2017 compared with a net outflow of £19.5 billion in Quarter 1 2017.
Financial derivatives and employee stock options showed net settlement receipts of £1.7 billion in Quarter 2 2017 following net settlement receipts of £8.9 billion in Quarter 1 2017.
Other investment in Quarter 2 2017 recorded a net inflow (that is, more money flowing into the UK) of £40.9 billion compared with a net inflow of £60.4 billion in Quarter 1 2017.
Reserve assets showed net investment of £1.8 billion in Quarter 2 2017.
Notes for: Financial account shows a net inflow to the UK
1 . Throughout this release Quarter 1 refers to January to March, Quarter 2 refers to April to June, Quarter 3 refers to July to September, and Quarter 4 refers to October to December.
Back to table of contents7. International investment position
Figure 6: UK international investment position (not seasonally adjusted)
Quarter 3 (Jul to Sept) 2014 to Quarter 2 (Apr to June) 2017
Source: Office for National Statistics
Notes:
- Q1 refers to Quarter 1 (Jan to Mar), Q2 refers to Quarter 2 (Apr to June), Q3 refers to Quarter 3 (July to Sept) and Q4 refers to Quarter 4 (Oct to Dec).
Download this chart Figure 6: UK international investment position (not seasonally adjusted)
Image .csv .xlsThe international investment position showed net external liabilities (that is, liabilities exceeds assets) of £101.2 billion at the end of Quarter 2 (Apr to June) 2017, compared with net external liabilities of £69.9 billion at the end of Quarter 1 (Jan to Mar) 2017 (Figure 6).
UK assets fell by £60.9 billion to £10,642.6 billion in Quarter 2 2017. UK external liabilities dropped £29.6 billion in Quarter 2 2017 to £10,743.8 billion; the lowest level since Quarter 1 2016.
The total net direct investment position fell £21.5 billion in Quarter 2 2017 to a record low net asset position of £3.4 billion; while reserve assets increased £0.1 billion in Quarter 2 2017 to £114.3 billion; the largest net asset position on record.
Figure 7: Sterling exchange rates with major trading partners
Quarter 4 (Oct to Dec) 2012 to Quarter 2 (Apr to June) 2017

Source: Office for National Statistics
Download this image Figure 7: Sterling exchange rates with major trading partners
.png (27.6 kB) .xls (29.2 kB)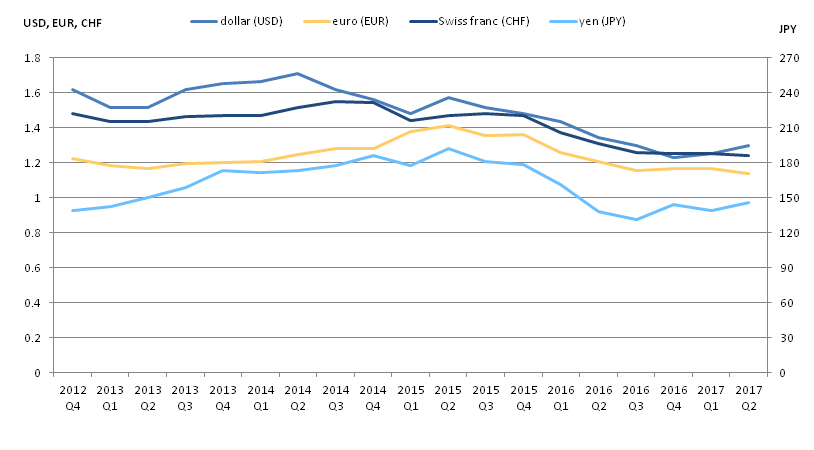
Figure 7 presents sterling exchange rates against the currencies of major trading partner countries at the close of markets at each quarter end. During Quarter 2 2017, sterling’s depreciation against a basket of foreign currencies continued to steady and appreciated against several currencies including the United States dollar and the Japanese yen. Sterling showed a slight depreciation against the Euro in Quarter 2 2017 and now stands at the lowest rate since Quarter 2 2011.
The stock of UK assets and liabilities with the rest of the world can be influenced by movements in exchange rates and price revaluations. On balance, exchange rate movements in Quarter 2 2017 have had less of an impact than the previous year. Table 1 summarises which type of investment is impacted by these changes.
Table 1: Revaluation impacts on investments
| Assets | Liabilities | ||||||||||||
| Exchange rate movements | Price revaluations | Exchange rate movements | Price revaluations | ||||||||||
| Direct Investment | Impact | Impact | No impact | Impact | |||||||||
| Portfolio Investment | |||||||||||||
| Equities | Impact | Impact | No impact | Impact | |||||||||
| Debt Securities | Impact | Impact | No impact | Impact | |||||||||
| Other Investment | |||||||||||||
| Deposits | Impact | No impact | Impact | No impact | |||||||||
| Loans | Impact | No impact | Impact | No impact | |||||||||
| Source: Office for National Statistics | |||||||||||||
| Note: | |||||||||||||
| 1. Q1 refers to Quarter 1 (Jan to Mar), Q2 refers to Quarter 2 (Apr to June), Q3 refers to Quarter 3 (July to Sept)and Q4 refers to Quarter 4 (Oct to Dec). | |||||||||||||
Download this table Table 1: Revaluation impacts on investments
.xls (27.1 kB)Notes for:International investment position
1 . Throughout this release Quarter 1 refers to January to March, Quarter 2 refers to April to June, Quarter 3 refers to July to September, and Quarter 4 refers to October to December.
Back to table of contents8. Quality and methodology
The Balance of payments (BoP) Quality and Methodology Information document contains important information on:
the strengths and limitations of the data and how it compares with related data
uses and users of the data
how the output was created
the quality of the output including the accuracy of the data