Table of contents
- Main points
- Statistician’s comment
- Summary
- UK economy grew by an unrevised 0.3% in Quarter 2 2017
- Services output drives growth in Quarter 2 2017 as construction and production fall
- Household consumption remains subdued, while growth in business investment recovers from recent lows
- Compensation of employees drives nominal GDP growth in Quarter 2 2017, while profits remain broadly stable
- Households saving ratio recovers from previous low to reach 5.4% in Quarter 2 2017
- Current account deficit widens to 4.6% of GDP in Quarter 2 2017
- Core inflation increases in the UK but remains relatively subdued in the EU as a whole
- UK unemployment rate continues to fall
1. Main points
The UK economy grew by an unrevised 0.3% in Quarter 2 (Apr to June) 2017 and growth for 2016 was also unrevised at 1.8%.
Service activity has driven growth in Quarter 2 2017 but is growing at a slower quarterly rate than in the second half of 2016.
Private consumption, government consumption and net trade contributed positively to growth in Quarter 2 2017, while gross capital formation detracted from growth.
New estimates of the households saving ratio, which include methodological improvements, show that it has been on a declining trend since Quarter 3 (July to Sept) 2015, before recovering to 5.4% in Quarter 2 2017.
Revised estimates show the UK’s current account deficit increased in Quarter 2 (Apr to June) 2017 to 4.6% of GDP from a newly revised figure of 4.4% in Quarter 1 (Jan to Mar) 2017.
Core inflation is increasing in the UK but remains relatively subdued in the EU as a whole.
The unemployment rate fell to 4.3% in the three months to July 2017, but annual wage growth in real terms has been negative since the three months to March 2017.
2. Statistician’s comment
Commenting on today’s national accounts figures, Head of Gross Domestic Product, Darren Morgan said:
“There was a notable slowdown in growth in the first half of 2017. The often buoyant services sector was the only area to grow in the second quarter, mainly due to increases in computer programming and retail.
"Household spending growth continued to slow in the second quarter. However, revised figures show business investment grew more strongly than previously estimated. Meanwhile, the UK’s deficit with the rest of the world was little changed in the second quarter.
“Today’s figures include several improvements to the way we measure the UK economy, including better estimates of self-employed income and interest received from corporate bonds. These improvements have the impact of increasing the saving ratio and current account deficit over a number of years.”
Back to table of contents3. Summary
The UK economy grew at 0.3% in Quarter 1 (Jan to Mar) 2017 and 0.3% in Quarter 2 (Apr to June) 2017 – a slower rate of quarterly growth than seen in the second half of 2016. Compared with Quarter 2 a year ago, the economy has grown 1.5% – the slowest rate since Quarter 1 2013. Service sector output continues to drive growth, but activity has slowed in the first half of 2017, particularly in consumer-focused industries. Construction and production fell in Quarter 2, but net trade contributed positively to GDP growth.
The headline and under-lying rate of inflation, measured by excluding energy and food from the Consumer Prices Index including owner occupiers’ housing costs (core CPIH), continued to rise in August 2017. Average wages are not keeping pace with inflation, with real wages falling in each consecutive three-month period since January to March 2017. Other indicators in the labour market remain strong with the unemployment rate and measures of under-employment continuing to fall.
More detailed theme day economic commentary is available for:
Back to table of contents4. UK economy grew by an unrevised 0.3% in Quarter 2 2017
The Quarterly National Accounts (QNA) show that the UK economy grew by an unrevised 0.3% in Quarter 2 (Apr to June) 2017. This is the same rate as in Quarter 1 (Jan to Mar) 2017, which has been revised up from the 0.2% published in the second estimate of gross domestic product (GDP). GDP growth has slowed in the first two quarters of 2017, while the economy has grown 1.5% compared with the same quarter a year ago – the slowest rate since Quarter 1 2013 (Figure 1).
Figure 1: Gross domestic product growth, quarter-on-quarter and quarter on same quarter a year ago growth rate
UK, Quarter 1 (Jan to Mar) 2008 to Quarter 2 (Apr to June) 2017
Source: Office for National Statistics
Notes:
- Q1 refers to Quarter 1 (Jan to Mar), Q2 refers to Quarter 2 (Apr to Jun), Q3 refers to Quarter 3 (Jul to Sep) and Q4 refers to Quarter 4 (Oct to Dec).
Download this chart Figure 1: Gross domestic product growth, quarter-on-quarter and quarter on same quarter a year ago growth rate
Image .csv .xlsAll time periods are open for revision in today’s Quarterly National Accounts and a detailed article is published today explaining how methods changes have affected the national and sector accounts.
On a calendar year basis, today’s new data show that GDP grew by an unrevised 1.8% in 2016. However, there have been slight revisions to the quarterly GDP path in 2016, with a 0.1 percentage point downward revision to quarterly growth in Quarter 2, Quarter 3 (July to Sept) and Quarter 4 (Oct to Dec) 2016, with the latest estimates showing a weaker profile of household consumption in the second half of 2016.
These new estimates of GDP indicate that the economy has tracked similarly to the previous published growth path since the 2008 to 2009 economic downturn (Figure 2). While the economy’s peak-to-trough fall is slightly less marked (6.1% compared with a previously published 6.3%), it has grown by an unrevised 16.4% since the trough of the economic downturn in 2009. A more detailed explanation of these revisions in the national accounts can be found in new analysis published today.
Figure 2: Impact of gross domestic product revisions to quarterly growth path
UK, Quarter 1 (Jan to Mar) 2008 to Quarter 2 (Apr to June) 2017
Source: Office for National Statistics
Notes:
- Index 100 equals Quarter 1 2008 refers to the pre-downturn peak in 2008.
Download this chart Figure 2: Impact of gross domestic product revisions to quarterly growth path
Image .csv .xls5. Services output drives growth in Quarter 2 2017 as construction and production fall
The output measure of gross domestic product (GDP) increased by 0.3% in Quarter 2 (Apr to June) 2017, driven by a 0.4% rise in services output. Quarterly growth in services has been revised down by 0.1 percentage points from the 0.5% published in the second estimate of GDP. Today’s new estimates also show weaker services growth for 2016, with a 0.2 percentage point downward revision to quarterly growth in Quarter 2, Quarter 3 (July to Sept) and Quarter 4 (Oct to Dec) 2016.
Transport, storage and communications, and distribution, hotels and restaurants each contributed 0.2 percentage points towards total services growth in Quarter 2 2017, while business services and finance, and government and other services contributions remained broadly flat. Despite the downward revisions to 2016 growth, output in the services sector has been the main driver of recent growth in the UK economy – increasing by 2.5% in 2016. However, activity in the sector has slowed in the first two quarters of 2017, with output recording its lowest growth in the first half1 of the year since 2011. Part of this slowdown can be attributed to a decline in the output of “consumer-focused” industries, such as retail trade, with output remaining broadly flat in the first half of 2017 following several years of strong growth (Figure 3).
Figure 3: Output in consumer-focused service industries and total Index of Services
UK, Quarter 1 (Jan to Mar) 2009 to Quarter 2 (Apr to June) 2017
Source: Office for National Statistics
Notes:
- “Consumer-focused services” defined here include retail trade (Standard Industrial Classification (SIC) codes 45 and 47), food and beverage (SIC 56), publishing, audiovisual and broadcasting activities (SIC 58 to 60; including motion pictures), and arts, entertainment and recreation (SIC 90 to 93).
Download this chart Figure 3: Output in consumer-focused service industries and total Index of Services
Image .csv .xlsNew data on service output in July 2017 have been published today. Looking at the monthly path, total services output fell by 0.2% in July 2017. The monthly fall in July was entirely driven by a 1.6% decrease in transport, storage and communications, while distribution, hotels and restaurants, business services and finance, and government and other services all remained flat in the month. However, the underlying trend suggests a stronger picture for services activity with the fall in July following two months of relatively strong growth in both May and June (0.3%). Total services output grew by 0.5% on a three-month on three-month basis in July 2017, the strongest three-month on three-month growth rate seen in 2017. This was driven by increases in all four main components of services, with business services and finance making the largest growth contribution.
Construction and production fell by 0.5% and 0.3% respectively in Quarter 2 2017. While production is unrevised from the second estimate of GDP, the quarterly fall of 0.5% for total construction output has been revised up by 0.8 percentage points from a fall of 1.3%. Despite this fall in construction in the latest quarter, it follows several years of growth and a strong start to 2017, with output remaining at relatively high levels. Total construction output rose by 3.8% in 2016, a 1.4 percentage point upwards revision to the previously published estimate of 2.4%. Further detail of these revisions can be found in an article published today: Impact of improvements to construction statistics.
Activity in the production sector also continues to be weaker compared with high levels of output in December 2016, with production output and manufacturing output both falling in Quarter 2 2017. The 0.3% quarterly fall in production activity reflected decreases in waste management (down by 1.0%), manufacturing and energy supply (both down by 0.3%), while mining and quarrying production increased by 0.6% as the usual summer maintenance in the North Sea oil rigs failed to materialise.
Notes for: Services output drives growth in Quarter 2 2017 as construction and production fall
- Comparing the level of output in Quarter 2 2017 to the level of output in Quarter 4 2016.
6. Household consumption remains subdued, while growth in business investment recovers from recent lows
The expenditure measure of gross domestic product (GDP) increased by 0.3% in Quarter 2 (Apr to June) 2017, with private consumption, government consumption and net trade contributing positively to growth, while gross capital formation detracted from growth.
The largest quarterly growth contribution came from net trade (0.4 percentage points), reflecting a 1.7% increase in exports, while imports only increased by 0.2%. On a quarter on same quarter a year ago basis, the contribution from net trade has gradually increased over the past three quarters, from zero contribution in Quarter 4 (Oct to Dec) 2016 to 0.4 percentage points in Quarter 2 2017, following four consecutive negative contributions (Figure 4). These contribution figures reflect revised estimates, which show a stronger net trade profile over the past three quarters, with upwards revisions ranging between 0.4 and 0.8 percentage points.
Figure 4: Contributions to gross domestic product growth, expenditure components, quarter on same quarter of previous year, chained volume measure
UK, Quarter 1 (Jan to Mar) 2015 to Quarter 2 (Apr to June) 2017
Source: Office for National Statistics
Notes:
- Components may not sum to total gross domestic product due to rounding and loss of additivity in data prior to open period. The statistical discrepancy is also not displayed.
Download this chart Figure 4: Contributions to gross domestic product growth, expenditure components, quarter on same quarter of previous year, chained volume measure
Image .csv .xlsGrowth in household final consumption expenditure (HHFCE) slowed to 0.2% in Quarter 2 2017, the slowest quarterly growth rate since Quarter 4 2014. Private consumption (expenditure of households and non-profit institutions serving households) has been relatively subdued in recent periods, with its contribution to quarter-on-year GDP growth declining from 2.0 percentage points in Quarter 2 2016 to 1.0 percentage points in Quarter 2 2017 (Figure 4). These latest figures reflect a revised quarterly growth profile for HHFCE in 2016, with a stronger first half of the year (upwards revision of 0.1 percentage points to quarterly growth in Quarter 1 (Jan to Mar) and Quarter 2) and a weaker second half of the year (downwards revision of 0.2 and 0.3 percentage points in Quarter 3 (July to Sept) and Quarter 4 respectively).
Previous analysis indicates that this slowdown in household consumption may in part be driven by households choosing to delay their purchase of discretionary items, as the inflationary squeeze on real wages and weaker value of sterling weigh on household expenditure decisions.
Gross fixed capital formation (GFCF) also contributed positively to quarterly GDP growth in Quarter 2 2017, increasing by 0.6% in the quarter. These figures reflect revised estimates for GFCF, with today’s new data showing upward revisions in each quarter of 2016 (between 0.2 and 1.7 percentage points) and downward revisions in Quarters 1 and 2 2017 (0.5 and 0.1 percentage points respectively). The main drivers of the quarterly growth in Quarter 2 2017 were investment by general government and business investment, contributing 0.9 and 0.3 percentage points respectively, while private sector dwellings detracted 0.4 percentage points – the weakest contribution since Quarter 3 2015.
While GFCF increased in Quarter 2 2017, gross capital formation (GCF) – which takes into account changes in inventories and acquisitions less disposals of assets – detracted 0.3 percentage points from quarterly GDP growth and made zero contribution to quarter-on-year GDP growth (Figure 4).
Business investment, the largest component of GFCF, grew by 0.5% in Quarter 2 2017 on a quarterly basis. Today’s new data show a stronger growth profile for business investment across 2016 and the first half of 2017, with upward revisions of between 0.1 and 1.0 percentage points in each of the last six quarters. Despite these revisions, business investment remains relatively weak overall, declining by 0.4% in 2016 compared with growth of 3.7% in 2015. For more information on these revisions, see Business investment in the UK, revised: April to June 2017, which was also published today.
Back to table of contents7. Compensation of employees drives nominal GDP growth in Quarter 2 2017, while profits remain broadly stable
Nominal gross domestic product (GDP) grew by 0.7% in Quarter 2 (Apr to June) 2017, a downward revision of 0.1 percentage points from the previously published second estimate of GDP. With real GDP growth of 0.3%, the GDP implied deflator at market prices rose by 0.4% in Quarter 2 2017 and by 2.1% compared with the same quarter a year ago. This is 0.5 percentage points weaker than the 2.6% 12-month growth rate as measured by the Consumer Prices Index including owner occupiers’ housing costs (CPIH) for Quarter 2 2017. The GDP deflator is a broader measure of inflation of goods and services produced domestically, while the CPIH captures price changes experienced by households.
Nominal income growth in Quarter 2 2017 was predominantly driven by a 1.0% increase in compensation of employees (CoE), which has been revised down by 0.2 percentage points from the previous estimate. CoE contributed 2.0 percentage points to the 3.8% calendar-year growth for nominal GDP in 2016.
The strength in CoE in Quarter 2 2017 was partly offset by a fall in gross operating surplus (GOS), which made zero contribution to nominal GDP growth in the latest quarter, compared with 0.5 percentage points in Quarter 1 (Jan to Mar) 2017. The 0.2% quarterly fall in GOS was driven by a 1.7% decrease in private non-financial corporations’ (PNFC) profits, which more than offset growth in profits for both financial and public corporations (up 7.2% and 15.1% respectively).
Back to table of contents8. Households saving ratio recovers from previous low to reach 5.4% in Quarter 2 2017
The Quarterly sector and financial accounts published today provide further information about the UK economy, including a new households only saving ratio. We have previously only published a combined households and non-profit institutions serving households (NPISH) saving ratio, but these accounts will be published separately as of Blue Book 2017.
Today’s new data show that the households saving ratio rose from 3.8% in Quarter 1 (Jan to Mar) 2017 to 5.4% in Quarter 2 (Apr to June) 2017 – the largest quarterly increase in the saving ratio since Quarter 2 2013. This increase reflected relatively strong growth in real household disposable income (RHDI), driven primarily by a fall in taxes, coupled with slowing growth in household consumption. RHDI increased by 1.6% in Quarter 2 2017 following six quarters of relatively flat or negative growth. However, it should be noted that the sharp fall in Quarter 1 2017 may in part be due to the timing of tax payments.
Today’s release – which will be consistent with Blue Book 2017 – also incorporates a suite of methodological improvements, including significant revisions to the households saving ratio due to improvements in the measurement of dividend income. These changes have led to an upwards revision of the households and NPISH saving ratio by an average of 0.9 percentage points from 1997 to 2016, with a revised 2016 estimate of 7.1% (revised up from 5.2%).
Figure 5 shows that the households and NPISH saving ratio has been on a declining trend since Quarter 3 (July to Sept) 2015, falling sharply from 9.7% to 4.0% in Quarter 1 2017. This is a slightly more marked decline compared with previously published estimates of the households and NPISH saving ratio, which saw the ratio fall from 6.6% to 1.7% over the same period. For further details of the impact of these revisions, see the article on the impact of method changes to the national accounts and sector accounts published today.
Figure 5: Impact of revisions to households and NPISH saving ratio
UK, Quarter 2 (Apr to June) 2007 to Quarter 2 (Apr to June) 2017
Source: Office for National Statistics
Download this chart Figure 5: Impact of revisions to households and NPISH saving ratio
Image .csv .xls9. Current account deficit widens to 4.6% of GDP in Quarter 2 2017
As a percentage of gross domestic product (GDP), the UK’s current account deficit increased in Quarter 2 (Apr to June) 2017 to 4.6% from a newly revised figure of 4.4% in Quarter 1 (Jan to Mar) 2017. Previously, the current account deficit was estimated to have been 3.4% in Quarter 1 2017. There have been significant revisions to the current account deficit, which mainly reflect methodological changes to the payments of corporate bonds interest.
The current account deficit in 2016 has been revised from 4.4% to 5.9%, which has almost entirely been driven by revisions to investment income. However, Figure 6 shows that recent trends remain broadly similar to previously published estimates with the deficit widening from 2.4% of GDP in 2011 to 5.9% in 2016. Previous estimates showed a widening of the deficit from 1.8% of GDP to 4.4% over the same period. The article, Impact of method changes to the national accounts and sector accounts, covers the revisions to the current account balance in more detail.
Figure 6: Impact of revisions to the current account deficit
UK, Quarter 2 (Apr to June) 2010 to Quarter 2 2017
Source: Office for National Statistics
Download this chart Figure 6: Impact of revisions to the current account deficit
Image .csv .xlsThe widening in the current account deficit in Quarter 2 2017 was driven by a widening in the deficits in primary and secondary income. The £1.4 billion widening in primary income in the quarter was driven by movements in earnings on portfolio investment, while there was a £1.9 billion widening in the secondary income deficit. This was partially offset by a £2.4 billion narrowing of the total trade deficit.
The current account deficit was primarily financed by other investment in Quarter 2 2017. There was an increase of £26.2 billion of other investment in the UK, while the UK reduced its holdings of assets of other investment abroad by £14.6 billion.
Back to table of contents10. Core inflation increases in the UK but remains relatively subdued in the EU as a whole
The Harmonised Index of Consumer Prices (HICP) is equivalent to the Consumer Prices Index (CPI) in the UK and allows for international comparisons to be made. Figure 7 shows the annual rate of change for the HICP of the EU and the UK from January 2015 to August 2017, as well as the core HICP that excludes the more volatile components of the index – food and non-alcoholic beverages, alcohol and tobacco and energy. Energy includes data on motor fuels, electricity, gas and other fuels.
Figure 7: 12-month growth rate in Harmonised Index of Consumer Prices in the EU and the UK, all items and core
January 2015 to August 2017
Source: Eurostat
Download this chart Figure 7: 12-month growth rate in Harmonised Index of Consumer Prices in the EU and the UK, all items and core
Image .csv .xlsOver the period January to November 2015, the all items HICP growth rate for both the EU and UK remained close to zero, and core HICP growth remained at around 1% for both series. From November 2015, the UK all items HICP growth rate started to gradually increase, reaching 2.9% by August 2017. The equivalent series for the EU as a whole also increased during 2016 and the first few months of 2017, with growth reaching 2% in February and again in April 2017. Growth has since fallen back a little to 1.7% in August 2017 and is now 1.2 percentage points below the UK’s HICP growth rate.
The growth rates of HICP and core HICP are often quite different as non-core components of HICP are typically more volatile than core components and sometimes counteract each other. Figure 7 shows that both the EU and UK have seen a convergence in core and all items HICP. Previous analysis has linked the convergence between core and the all item HICP in the UK to partially off-setting price effects in food and energy. In the EU, core HICP remained relatively stable at around 1% until March 2017, but then started to increase to reach 1.4% in August 2017. Core HICP in the UK started to increase from an earlier time, from October 2016 and has moved in a similar upward trend to all items HICP.
This increase in core and all items HICP inflation in the UK can be attributed to a range of goods and services experiencing price gains. In recent months, for example, clothing and footwear, and household goods have made large contributions to the 12-month growth rate. These categories of goods are in the 30% to 40% and 40% plus import intensity groups and may be reflecting the effects of sterling depreciation and higher import costs. In contrast the core rate of HICP in the EU as a whole has not shown as marked an increase as in the UK, and may reflect the relative strength of the euro against sterling, with consumers experiencing less import price-related inflationary pressure.
Back to table of contents11. UK unemployment rate continues to fall
Latest estimates from the Labour Force Survey show that the UK unemployment rate declined by 0.2 percentage points to 4.3% in the three months to July 2017 compared with three months ago. Figure 8 shows that the level of unemployment has been falling at an increasing rate over the three months to July 2017 compared with the previous quarter. The total unemployment level decreased by 175,000 compared with a year earlier and by 75,000 compared with three months ago. By age category, there was a fall in unemployment for four age groups: 16 to 17, 18 to 24, 25 to 34 and 35 to 49, whereas unemployment increased for two age groups: 50 to 64 and 65 and over.
Figure 8: Quarterly changes in unemployment level and unemployment rate
UK, seasonally adjusted, May to July 1995 to May to July 2017
Source: Office for National Statistics
Download this chart Figure 8: Quarterly changes in unemployment level and unemployment rate
Image .csv .xlsReal and nominal wages
Figure 9 shows rates of nominal and real wage growth since July 2006. Average weekly earnings increased by 2.1% (excluding and including bonuses) in the three months to July 2017 compared with a year earlier. Figure 9 shows that once adjusted for inflation (measured using the Consumer Prices Index including owner occupiers’ housing costs (CPIH)), average weekly earnings fell by 0.4% (both excluding and including bonuses) on the previous year. Annual wage growth in real terms has been negative since the three months to March 2017. This is because consumer price inflation continues to outpace growth in wages.
Figure 9: Regular average weekly earnings growth: real and nominal
Great Britain, seasonally adjusted, 3 month on 3 month a year ago, July 2006 to July 2017
Source: Office for National Statistics
Download this chart Figure 9: Regular average weekly earnings growth: real and nominal
Image .csv .xlsUK employment level reached a new record high
The employment rate reached a new record high of 75.3% (up 0.5 percentage points) in the quarter. The number of people in work in the UK increased by 181,000 in the three months to July 2017 to a new record high of 32.1 million, following three consecutive quarters (including the current quarter) of growth.
The number of employees and self-employed both increased in the three months to July 2017 and are also at record levels (27.1 million and 4.8 million respectively). In addition, full-time employment increased by 96,000 in the quarter to a record high of 23.6 million, and part-time employment increased by 86,000 in the quarter to 8.5 million.
The increase in employment coincides with a fall in inactivity. Total inactivity level decreased by 107,000 since the three months to April 2017, while the inactivity rate declined by 0.3 percentage points to a record low of 21.2%. These latest figures highlight some strengths in the UK labour market.
Under-employment in the UK labour market
Recent analysis examined the different types of employment and the extent of underemployment in the UK labour market. This analysis presented figures for part-time workers who could not find a full-time job as well as those who were classified as underemployed.
In the three months to July 2017, 13% of all part-time workers were involuntary part-time workers (part-time workers who could not find a full-time job). The number of involuntary part-time workers decreased by 21,000 in the three months to July 2017 compared with the previous quarter. In the three months to July 2013 there were 1.5 million involuntary unemployed part-time workers, whereas this number is down to 1.0 million in the three months to July 2017.
The estimates of underemployment based on part-time workers who could not find a full-time job do not quantify the extent to which full- or part-time workers are underemployed. To be classified as underemployed a person must satisfy all three of the underemployment criteria (willing to work more hours, available to do so and worked less than the specified hours of work threshold). In addition to responding positively to these three criteria, employed people were classified as underemployed when they were: available to start working longer hours within two weeks and their actual weekly hours worked were 40 or less (for people aged under 18) or 48 or less (for people aged 18 or over).
It should be noted that underemployment level and rates are generally higher than the number and rates of involuntary part-time workers. This is because a person may be willing and available to work longer hours even if their job is full-time.
According to the latest estimates from the Labour Force Survey, there were 2.5 million underemployed people in the UK in the three months to June 2017 (the latest available period). The underemployment rate1 (underemployed as a proportion of all in employment) was 7.7%. The level of underemployment2 decreased by 205,000 in the three months to June 2017 compared with the previous quarter, while the underemployment rate declined by 0.7 percentage points on the previous quarter, to its lowest since the three months to September 2008.
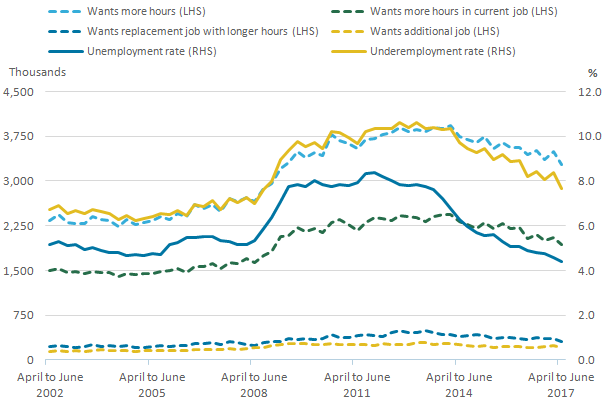
Figure 10 shows that between 2012 and 2014, the underemployment rate (right-hand scale) fell more slowly than the unemployment rate (also right-hand scale); however, during the past 15 years a decrease in underemployment generally corresponded to a decrease in unemployment.
Figure 10: Underemployment rate, unemployment rate and numbers of employees wanting more hours
UK, April to June 2002 to April to June 2017
Source: Office for National Statistics
Notes:
- The "Wants more hours" series includes those who meet all of the underemployment criteria (that is, willing to work more hours, available to do so and worked less than the specified hours of work threshold) as well as those who do not meet these criteria.
Download this image Figure 10: Underemployment rate, unemployment rate and numbers of employees wanting more hours
.png (24.2 kB) .xls (26.6 kB)
Figure 10 also shows that the number of people who wanted more hours (left-hand scale) in the three months to June 2017 fell by 4.9% to 3.3 million compared with the same period a year earlier. The number of people who wanted more hours in their current job fell by 5.4% to 1.9 million in the three months to June 2017 compared with a year earlier. Furthermore, the number of people who wanted a replacement job with longer hours decreased by 9.6% to 312,000, whereas the number of those who wanted an additional job increased by 1.5% to 217,000 in the three months to June 2017 compared with a year earlier.
Notes for: UK unemployment rate continues to fall
Rate is the proportion of total employment, with no adjustment for unknowns.
The total excludes those workers with unknown underemployment status.