
Table of contents
- Main points
- Review of how economic statistics are published
- Summary
- Movements in foreign exchange rates
- Current account balances as percentage of GDP
- Current account with EU and non-EU countries (Table C)
- Trade in goods (Table E) and services (Table F)
- Primary income account (Table G)
- Secondary income account (Table H)
- Capital account (Table I)
- Financial account (Table J)
- International investment position (Table K)
- Summary of revisions
- Background notes
1. Main points
The UK’s current account deficit was £25.5 billion in Quarter 3 (July to September) 2016, up from a revised deficit of £22.1 billion in Quarter 2 (April to June) 2016. The deficit in Quarter 3 2016 equated to 5.2% of gross domestic product (GDP) at current market prices, up from 4.6% in Quarter 2 2016.
The widening in the current account deficit was mainly due to a widening in the deficits on total trade and secondary income, partially offset by a narrowing in the primary income deficit.
The total trade deficit widened to £13.6 billion in Quarter 3 2016, from £7.3 billion in Quarter 2 2016. This was due to the trade in goods deficit widening by £8.5 billion, partially offset by a £2.2 billion widening in the trade in services surplus.
The primary income deficit narrowed to £5.0 billion in Quarter 3 2016, from £8.7 billion in Quarter 2 2016. The narrowing was mainly due to the balance on direct investment switching from a deficit of £0.8 billion in Quarter 2 2016 to a surplus of £3.6 billion in Quarter 3 2016.
The deficit on secondary income widened by £0.8 billion, from £6.1 billion in Quarter 2 2016 to £6.9 billion in Quarter 3 2016. This was due to payments increasing more than receipts.
The financial account recorded a net inflow of £22.6 billion during Quarter 3 2016.
The international investment position recorded UK net assets of £238.2 billion at the end of Quarter 3 2016.
Back to table of contents2. Review of how economic statistics are published
From January 2017 we are improving the way we publish economic statistics, with related data grouped together under new "theme" days. This will increase the coherence of our data releases and involve minor changes to the timing of certain publications. For more information see Changes to publication schedule for economic statistics.
Back to table of contents3. Summary
The balance of payments summarises the economic transactions of the UK with the rest of the world. These transactions can be broken down into 3 main accounts: the current account, the capital account and the financial account.
The current account comprises the trade in goods and services account, the primary income account and secondary income account. The difference in the monetary value of these accounts is known as the current account balance. A current account balance is in surplus if overall credits exceed debits, and in deficit if overall debits exceed credits.
The sum of the current and capital account balances are equal to the balance of the financial account. As the capital account is relatively small in comparison, the current account and financial account can be said to be counterparts.
The current account balance plus the capital account balance measures the extent to which the UK is a net lender (that is, in surplus) or net borrower (that is, in deficit). The UK has run a combined current and capital account deficit in every year since 1983, and every quarter since Quarter 3 1998.
Figure 1: UK current account balances (seasonally adjusted)
Quarter 4 (Oct to Dec) 2013 to Quarter 3 (July to Sept) 2016
Source: Office for National Statistics
Notes:
- Q1 refers to Quarter 1 (Jan to Mar), Q2 refers to Quarter 2 (Apr to June), Q3 refers to (July to Sept) and Q4 refers to Quarter 4 (Oct to Dec).
Download this chart Figure 1: UK current account balances (seasonally adjusted)
Image .csv .xlsQuarter 3 2016 overview
In Quarter 3 2016, the UK was a net borrower of £25.7 billion, up from £22.4 billion in Quarter 2 2016. This was due to the widening in the current account deficit of £3.4 billion.
The £6.2 billion widening in the total trade deficit was mainly due to a widening of £8.5 billion in the trade in goods deficit, as imports increased by £7.4 billion while exports decreased by £1.1 billion from Quarter 2 2016. Additionally there was a £2.2 billion widening in the trade in services surplus. The widening in the trade in services surplus was due to exports increasing by £1.2 billion and imports decreasing by £1.0 billion.
The £3.7 billion narrowing in the total primary income deficit from Quarter 2 2016 was mainly due to the balance on direct investment switching from a deficit of £0.8 billion in Quarter 2 2016 to a surplus of £3.6 billion in Quarter 3 2016. Partially offsetting the improvement in the direct investment balance in Quarter 3 2016 was a slight widening in the deficit on portfolio investment income of £0.8 billion. The other investment deficit narrowed £0.1 billion and stands at £2.3 billion.
The £0.8 billion widening in the secondary income deficit in Quarter 3 2016 to £6.9 billion was due to payments increasing more than receipts.
Notes for: Summary
Throughout this release Quarter 1 refers to January to March, Quarter 2 refers to April to June, Quarter 3 refers to July to September, and Quarter 4 refers to October to December.
Back to table of contents4. Movements in foreign exchange rates
How a sterling devaluation can impact the balance of payments and international investment position
Over the last year there has been a substantial depreciation in the sterling exchange rate, falling 15.2% between Quarter 3 2015 and Quarter 3 2016, and by 7.8% on the quarter. Currency fluctuations can affect the relative prices of traded goods, and may influence changes in the trade balance. For example, by assuming that UK firms import a good with a fixed foreign currency price, and keep the quantity of imports fixed, the price of imported goods would rise in sterling terms following the currency depreciation, leading to a rise in the nominal value of imports in sterling terms.
However, in practice the impact of a sterling change is likely to be much more complex. Some companies may hedge against currency movements in the short- to medium-term. In addition, evidence suggests that a high proportion of UK imports are traded in foreign currency, while some UK exports are traded in sterling, so there will not necessarily be a straightforward pass through from the changes in the value of sterling to the value of trade. Furthermore, there has been anecdotal evidence from some ONS respondents that the quantity of UK export orders were brought forward due to the lower sterling level.
In the longer run, a sustained depreciation in sterling may lead to a behavioural change, where a company reacts to the change in prices and either sells or purchases differently as a result. For example, if the prices of imported goods become persistently more expensive then a UK company may purchase from a domestic source instead and reduce reliance on imports. Similarly if a sterling devaluation leads to improved price competitiveness of UK exports, they may become more attractive to the rest of the world. This effect is likely to be more subtle and could take longer to feed through, as companies may find it difficult to make major changes to supply chains. Again in practice this effect is further complicated by other factors, such as the absolute level of UK export competitiveness, and non-price considerations such as consumer preferences and quality.
The devaluation of sterling can also have an impact on earnings from investment income. A direct arithmetic impact will be expected on earnings from investment abroad. For example, all else being equal, a $100 million profit from a US subsidiary will be worth more in sterling terms after a devaluation of sterling (since the investment income is paid in $US but UK's Balance of Payments is presented in sterling). Longer run behavioural impacts may also apply if different investments become cheaper or more expensive as a result of currency movements, particularly investment within portfolio and direct investment. Similar to trade, the behavioural impacts are mostly expected in the medium- to long-term, although there may also be some short-term behavioural impacts depending on the extent to which investors take short-term decisions.
The devaluation of sterling will have a direct arithmetical impact on the level of investment presented within the international investment position (IIP). UK assets and liabilities are presented at market value where possible, and so revaluation impacts are continuous. All else being equal, a devaluation of sterling will increase the value of UK assets presented in the IIP, since the vast majority of UK assets are held in foreign currency and hence converted to sterling for presentation in the IIP. There also may be an impact on UK liabilities within the IIP, because some liabilities are also held in foreign currency. However, the proportion of liabilities held as foreign currency tends to be smaller.
The “International investment position” section within this release provides some more information on the revaluation impacts within the IIP. In the coming months, we will also explore the arithmetic and behavioural impact on the balance of payments and IIP and present findings when they become available.
Back to table of contents5. Current account balances as percentage of GDP
Figure 2: UK balances as percentage of GDP
Quarter 4 (Oct to Dec) 2013 to Quarter 3 (July to Sept) 2016
Source: Office for National Statistics
Notes:
- Q1 refers to Quarter 1 (Jan to Mar), Q2 refers to Quarter 2 (Apr to June), Q3 refers to (July to Sept) and Q4 refers to Quarter 4 (Oct to Dec).
Download this chart Figure 2: UK balances as percentage of GDP
Image .csv .xlsThe current account deficit equated to 5.2% of gross domestic product (GDP) at current market prices in Quarter 3 2016, compared with 4.6% in Quarter 2 2016. The deficit on trade in goods and services was equivalent to 2.8% of GDP in Quarter 3 2016, compared with 1.5% in Quarter 2 2016. The deficit on primary income equated to 1.0% of GDP in Quarter 3 2016, compared with a deficit equivalent to 1.8% in Quarter 2 2016. The deficit on secondary income equated to 1.4% of GDP in Quarter 3 2016, compared with a deficit equivalent to 1.3% in Quarter 2 2016.
Notes for: Current account balances as percentage of GDP
Throughout this release Quarter 1 refers to January to March, Quarter 2 refers to April to June, Quarter 3 refers to July to September, and Quarter 4 refers to October to December.
Back to table of contents6. Current account with EU and non-EU countries (Table C)
Figure 3: UK current account balances with EU and non-EU countries (seasonally adjusted)
Quarter 4 (Oct to Dec) 2013 to Quarter 3 (July to Sept) 2016
Source: Office for National Statistics
Notes:
- Q1 refers to Quarter 1 (Jan to Mar), Q2 refers to Quarter 2 (Apr to June), Q3 refers to (July to Sept) and Q4 refers to Quarter 4 (Oct to Dec).
Download this chart Figure 3: UK current account balances with EU and non-EU countries (seasonally adjusted)
Image .csv .xlsA current account deficit of £20.9 billion was recorded with the EU in Quarter 3 2016, compared with a deficit of £22.3 billion in Quarter 2 2016. This was mainly due to the deficit on total trade narrowing from £14.6 billion in Quarter 2 2016 to £13.7 billion in Quarter 3 2016. Additionally, the deficit on primary income narrowed from £5.0 billion in Quarter 2 2016 to £3.6 billion in Quarter 3 2016. This was partially offset by a £0.9 billion widening in the deficit on secondary income.
The current account balance with non-EU countries switched from a surplus of £0.3 billion in Quarter 2 2016 to a deficit of £4.6 billion in Quarter 3 2016. This was mainly due to the total trade surplus narrowing from £7.3 billion in Quarter 2 2016 to a surplus of £0.1 billion in Quarter 3 2016. The deficit on secondary income narrowed slightly from £3.4 billion in Quarter 2 2016 to £3.3 billion in Quarter 3 2016. The deficit on primary income narrowed from £3.6 billion in Quarter 2 2016 to £1.4 billion in Quarter 3 2016.
Notes for: Current account with EU and non-EU countries (Table C)
Throughout this release Quarter 1 refers to January to March, Quarter 2 refers to April to June, Quarter 3 refers to July to September, and Quarter 4 refers to October to December.
Back to table of contents7. Trade in goods (Table E) and services (Table F)
Figure 4: UK trade in goods and services balances (seasonally adjusted)
Quarter 4 (Oct to Dec) 2013 to Quarter 3 (July to Sept) 2016
Source: Office for National Statistics
Notes:
- Q1 refers to Quarter 1 (Jan to Mar), Q2 refers to Quarter 2 (Apr to June), Q3 refers to (July to Sept) and Q4 refers to Quarter 4 (Oct to Dec).
Download this chart Figure 4: UK trade in goods and services balances (seasonally adjusted)
Image .csv .xlsTrade in goods covers transactions in general merchandise for which changes of ownership occur between UK residents and the rest of the world. General merchandise (with some exceptions) refers to moveable goods.
The trade in goods deficit in Quarter 3 2016 was £38.7 billion, compared with a deficit of £30.2 billion recorded in Quarter 2 2016. The widening in the deficit in Quarter 3 2016 was due to imports rising by £7.4 billion, compared with a fall in exports of £1.1 billion. The increase in imports was primarily due to a £2.5 billion rise in unspecified goods and a £2.2 billion rise in machinery and transport equipment; specifically aircraft of £1.2 billion. The fall in exports was mainly due to a £1.3 billion decrease in exports of aircraft.
Trade in services covers the provision of services by UK residents to non-residents and vice versa. It also covers transactions in goods which are not freighted out of the country in which transactions take place, for example, purchases for local use by foreign forces in the UK, or by UK forces abroad and purchases by tourists. Transactions in goods which are freighted into or out of the UK are included under trade in goods.
The trade in services surplus was £25.1 billion in Quarter 3 2016, an increase of £2.2 billion from Quarter 2 2016. Exports rose by £1.2 billion from Quarter 2 2016, to £60.9 billion, with imports falling by £1.0 billion from Quarter 2 2016, to £35.8 billion.
The rise in exports was mainly due to an increase in the export of most services but particularly insurance and pension services by £0.8 billion and financial services by £0.6 billion. Offsetting these were £0.3 billion decreases in the export of both travel services and other business services.
The fall in total imports of services was mainly due to a decrease in the import of other business services of £1.7 billion. This was partially offset by small increases in the import of most other services.
Notes for: Trade in goods (Table E) and services (Table F)
Throughout this release Quarter 1 refers to January to March, Quarter 2 refers to April to June, Quarter 3 refers to July to September, and Quarter 4 refers to October to December.
Back to table of contents8. Primary income account (Table G)
Figure 5: UK primary income account balances (seasonally adjusted)
Quarter 4 (Oct to Dec) 2013 to Quarter 3 (July to Sept) 2016
Source: Office for National Statistics
Notes:
- Q1 refers to Quarter 1 (Jan to Mar), Q2 refers to Quarter 2 (Apr to June), Q3 refers to (July to Sept) and Q4 refers to Quarter 4 (Oct to Dec).
Download this chart Figure 5: UK primary income account balances (seasonally adjusted)
Image .csv .xlsThe primary income account is comprised of compensation of employees, investment income and other primary income.
Compensation of employees presents remuneration in return for the labour input into the production process contributed by an individual. In the international accounts, compensation of employees is recorded when the employer (the producing unit) and the employee are resident in different economies.
Investment income covers earnings (for example, profits, dividends and interest payments and receipts) arising from foreign investment in financial assets and liabilities. Credits are the earnings of UK residents from their investments abroad and other foreign assets. Debits are the earnings of foreign residents from their investments in the UK and other UK liabilities. The flow of investment in the financial account is recorded separately from earnings, although reinvested earnings of companies with foreign affiliates are a component of both. The total value of UK assets and liabilities held at any time is also recorded separately under the international investment position.
Other primary income covers earnings from rent and taxes, and subsidies on production and on the import of goods. Under the Balance of Payments Manual fifth edition, taxes and subsidies on production and on the import of goods were classified to secondary income (previously titled current transfers). The recording of rent was previously classified to other investment income.
The primary income deficit narrowed from £8.7 billion in Quarter 2 2016, to £5.0 billion in Quarter 3 2016.
The balance on compensation of employees recorded a deficit of £100 million in Quarter 3 2016, a slight widening from a deficit of £95 million in Quarter 2 2016.
The balance on direct investment income switched from a deficit of £0.8 billion in Quarter 2 2016, to a surplus of £3.6 billion in Quarter 3 2016. The switch was due to receipts rising by £3.2 billion from Quarter 2 2016 to £19.2 billion in Quarter 3 2016, while payments fell by £1.1 billion from Quarter 2 2016 to £15.7 billion in Quarter 3 2016.
Net earnings on UK foreign direct investment (FDI) have followed a broadly downward trend between 2011 and 2015, falling from an average surplus of £13.4 billion per quarter in 2011 to a record deficit of £3.6 billion in Quarter 4 2015. This was driven by falls in credits, whilst debits increased slightly over the same period. The deficit in net FDI earnings have narrowed since the fourth quarter of 2015, before returning to surplus during the third quarter of 2016 reaching £3.6 billion.
Figure 6: Quarterly foreign direct investment earnings (seasonally adjusted)
Quarter 1 (Jan to Mar) 2011 to Quarter 3 (July to Sept) 2016
Source: Office for National Statistics
Notes:
- Q1 refers to Quarter 1 (Jan to Mar), Q2 refers to Quarter 2 (Apr to June), Q3 refers to (July to Sept) and Q4 refers to Quarter 4 (Oct to Dec).
Download this chart Figure 6: Quarterly foreign direct investment earnings (seasonally adjusted)
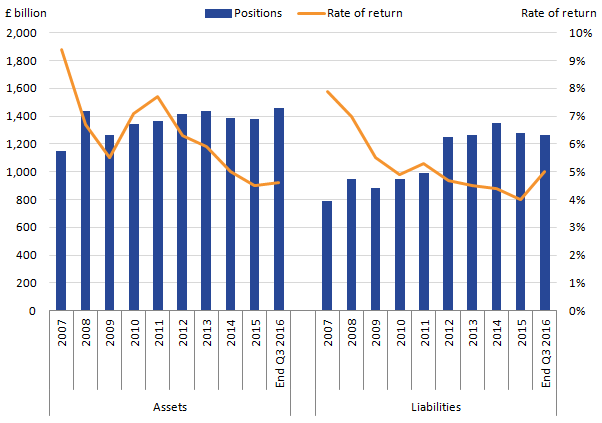
Image .csv .xlsThe broadly downward trend shown in FDI credits between 2011 and 2015 was predominantly caused by falling returns – with the rate of return on FDI assets falling from 7.7% in 2011 to 4.5% in 2015 – whilst FDI assets remained relatively stable over this period. In contrast, FDI debits tended to increase over the same period. Initially, this was due to increased investment into the UK, with FDI liabilities rising up until 2014, before the value of debits fell in 2015.
The narrowing of the FDI net earnings deficit during the first 3 quarters of 2016 was driven by increases in the value of credits over 3 consecutive quarters, increasing from £11.9 billion in Quarter 4 2015 to £19.2 billion in Quarter 3 2016. The increase reflects both an improvement in the rate of return in all 3 quarters, in addition to increases in assets in both Quarter 2 and Quarter 3 2016.
FDI debits remained constant in the first quarter of 2016, followed by an increase in the second quarter before experiencing a fall in the third quarter of 2016. The broad increase in FDI debits since Quarter 3 2015 appears mainly driven by changes in the rate of return.
The consistent increases in credits relative to debits between Quarter 4 2015 and Quarter 3 2016 explain the improvement seen in the balance of net FDI earnings. As outlined in a recent ONS paper, the recent depreciation in sterling may explain some of the recent strength seen in FDI assets and credits, as any foreign UK assets and earnings denominated in foreign currencies will increase in value when reported in sterling.
Figure 7: UK direct investment positions and rates of return (non-seasonally adjusted)
2007 to Quarter 3 (July to Sept) 2016
Source: Office for National Statistics
Notes:
- Rates of return are calculated using the income data from Table G and a rolling average of the international investment position from Table K.
- The rate of return for the 'End Q3 2016' data point is the average earnings for the three quarters of 2016 annualised.
- Q1 refers to Quarter 1 (Jan to Mar), Q2 refers to Quarter 2 (Apr to June), Q3 refers to Quarter 3 (July to Sept) and Q4 refers to Quarter 4 (Oct to Dec).
Download this image Figure 7: UK direct investment positions and rates of return (non-seasonally adjusted)
.png (17.9 kB) .xls (28.2 kB)
The portfolio investment income deficit widened by £0.8 billion between Quarter 2 2016 and Quarter 3 2016, to £6.2 billion. This was due to a slight widening in the deficits in both equity securities and debt securities.
The deficit on earnings from other investment narrowed slightly to £2.3 billion in Quarter 3 2016.
The deficit on other primary income was virtually unchanged at £0.3 billion in Quarter 3 2016.
Notes for: Primary income account (Table G)
Throughout this release Quarter 1 refers to January to March, Quarter 2 refers to April to June, Quarter 3 refers to July to September, and Quarter 4 refers to October to December.
Back to table of contents9. Secondary income account (Table H)
Figure 8: UK secondary income balance (seasonally adjusted)
Quarter 4 (Oct to Dec) 2013 to Quarter 3 (July to Sept) 2016
Source: Office for National Statistics
Notes:
- Q1 refers to Quarter 1 (Jan to Mar), Q2 refers to Quarter 2 (Apr to June), Q3 refers to (July to Sept) and Q4 refers to Quarter 4 (Oct to Dec).
Download this chart Figure 8: UK secondary income balance (seasonally adjusted)
Image .csv .xlsSecondary income represents the provision (or receipt) of an economic value by one party without directly receiving (or providing) a counterpart item of economic value. In plain terms, this is a transaction representing “something for nothing” or without a quid pro quo. Transfers can be in the form of money or of goods or services provided without the expectation of payment. General government transfers include receipts, contributions and subscriptions from or to European Union (EU) institutions and other international bodies, bilateral aid and military grants.
The deficit on secondary income widened from £6.1 billion in Quarter 2 2016 to £6.9 billion in Quarter 3 2016. This was due to payments increasing more than receipts.
It should be noted that the quarterly path of net contributions to EU institutions can be erratic due to the timing of payments.
Notes for: Secondary income account (Table H)
Throughout this release Quarter 1 refers to January to March, Quarter 2 refers to April to June, Quarter 3 refers to July to September, and Quarter 4 refers to October to December.
Back to table of contents10. Capital account (Table I)
The capital account comprises 2 components: capital transfers and the acquisition or disposal of non-produced, non-financial assets.
Under BPM6, there is no longer a requirement to record migrant transfers. The manual clarifies that the change in the residence does not involve a transaction between 2 entities but a change in status.
Capital transfers are those involving transfers of ownership of fixed assets, transfers of funds associated with the acquisition or disposal of fixed assets, and cancellation of liabilities by creditors without any counterparts being received in return. As with current transfers, they can be subdivided into general government transfers and other sectors transfers. The main sources of information are government departments (Department for International Development and HM Treasury) and the Bank of England. Compensation payments from the EU are also included here, for example, payments related to the destruction of animals to combat BSE and foot and mouth disease.
The sale or purchase of non-produced, non-financial assets covers intangibles such as patents, copyrights, franchises, leases and other transferable contracts, and goodwill. It also covers transactions involving tangible assets that may be used or needed for the production of goods and services but have not themselves been produced, such as land and sub-soil assets. The use of such assets is recorded under trade in services as royalties and license fees; only the outright purchase or sale of such assets is recorded in the capital account.
The capital account recorded a deficit of £0.2 billion in Quarter 3 (July to September) 2016, a slight narrowing from a deficit of £0.3 billion in Quarter 2 (April to June) 2016.
Back to table of contents11. Financial account (Table J)
Figure 9: UK financial account balances (not seasonally adjusted)
Quarter 4 (Oct to Dec) 2013 to Quarter 3 (July to Sept) 2016
Source: Office for National Statistics
Notes:
- Q1 refers to Quarter 1 (Jan to Mar), Q2 refers to Quarter 2 (Apr to June), Q3 refers to (July to Sept) and Q4 refers to Quarter 4 (Oct to Dec).
Download this chart Figure 9: UK financial account balances (not seasonally adjusted)
Image .csv .xlsThe financial account covers transactions that result in a change of ownership of financial assets and liabilities between UK residents and non-residents, for example, the acquisitions and disposals of foreign shares by UK residents.
The total financial account showed a net inflow (that is, more money flowing into the UK) of £22.6 billion in Quarter 3 2016, compared with a net inflow of £22.3 billion in Quarter 2 2016.
Direct investment recorded a net inflow (that is, more money flowing into the UK) of £7.0 billion in Quarter 3 2016, compared with a net inflow of £13.6 billion in Quarter 2 2016.
For further information on the impact of foreign direct investment acquisitions and disposals, please see background notes, understanding the data, part 2 interpreting the data.
Portfolio investment recorded a net inflow (that is, more money flowing into the UK) of £105.3 billion in Quarter 3 2016, an increase from a net inflow of £93.6 billion in Quarter 2 2016. The increased inflow in portfolio investment was due to non-residents’ net investment of £57.0 billion in Quarter 3 2016. This was broken down into net investment in UK equities of £15.1 billion and UK debt securities of £41.9 billion. Additionally, UK residents recorded net disinvestment of £48.3 billion in Quarter 3 2016. This was broken down into net disinvestment of foreign equities of £11.8 billion and net disinvestment of foreign debt of £36.5 billion.
Financial derivatives and employee stock options showed net settlement receipts of £26.8 billion in Quarter 3 2016, following net settlement payments of £41.0 billion in Quarter 2 2016.
Other investment in Quarter 3 2016 recorded a net outflow (that is, more money flowing from the UK) of £60.3 billion, compared with a net outflow of £123.1 billion in Quarter 2 2016.
Reserve assets showed net investment of £2.6 billion in Quarter 3 2016, a slight decrease from net investment of £2.8 billion in Quarter 2 2016.
Back to table of contents12. International investment position (Table K)
Figure 10: UK net international investment position (not seasonally adjusted)
Quarter 4 (Oct to Dec) 2013 to Quarter 3 (July to Sept) 2016
Source: Office for National Statistics
Notes:
- Q1 refers to Quarter 1 (Jan to Mar), Q2 refers to Quarter 2 (Apr to June), Q3 refers to (July to Sept) and Q4 refers to Quarter 4 (Oct to Dec).
Download this chart Figure 10: UK net international investment position (not seasonally adjusted)
Image .csv .xlsThe international investment position brings together the available estimates of the levels of identified UK external assets (foreign assets owned by UK residents) and identified UK external liabilities (UK assets owned by foreign residents) at the end of each calendar period.
The international investment position showed net external assets (that is, assets exceed liabilities) of £238.2 billion at the end of Quarter 3 2016, compared with net external assets of £150.3 billion at the end of Quarter 2 2016.
UK external assets abroad increased by £60.5 billion from the end of Quarter 2 2016, to a level of £11,170.8 billion at the end of Quarter 3 2016. The increase in the stock of UK external assets in Quarter 3 2016 was due to an increase in the value of stock in all asset classes except financial derivatives. The value of UK portfolio investment assets increased in Quarter 3 2016 due to the combination of exchange rates movements and price changes in equities and bonds, partially offset by UK residents’ continued net disinvestment of foreign equities (from Quarter 1 2015) and debt securities (from Quarter 4 2015).
UK external liabilities decreased by £27.4 billion in Quarter 3 2016, to a level of £10,932.6 billion. The decrease in UK external liabilities in Quarter 3 2016 was due to a decrease in UK liabilities in direct investment and financial derivatives, partially offset by increases in portfolio investment and other investment. While non-residents were generally net investors in the UK in Quarter 3 2016 they disinvested in other investment. With the exception of Quarter 2 2016, non-residents have recorded net disinvestment in other investment from Quarter 4 2014. This has been due to a combination of UK residents decreasing their loan liabilities and non-residents’ withdrawal of deposits. Despite this net disinvestment however, UK liabilities in other investment are returning to the level seen in Quarter 4 2014 due to the exchange rate impact on the foreign currency loans and deposits.
Figure 11: Sterling exchange rates with major trading partners
Quarter 1 (Jan to Mar) 2012 to Quarter 3 (July to Sept) 2016

Source: Office for National Statistics
Notes:
- Q1 refers to Quarter 1 (Jan to Mar), Q2 refers to Quarter 2 (Apr to June), Q3 refers to (July to Sept) and Q4 refers to Quarter 4 (Oct to Dec).
Download this image Figure 11: Sterling exchange rates with major trading partners
.png (14.8 kB) .xls (28.7 kB)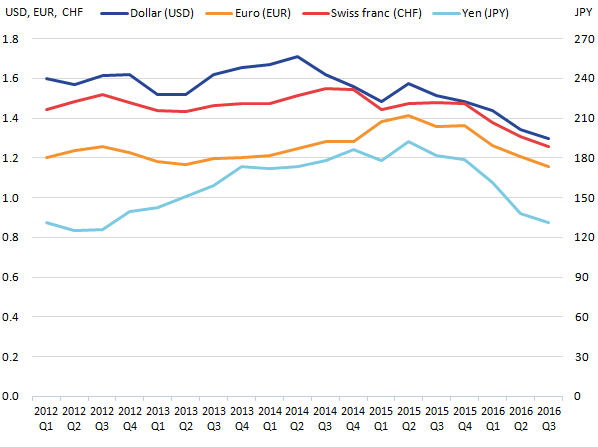
Figure 11 presents sterling exchange rates against the currencies of major trading partner countries at the close of markets at each quarter end. During Quarter 3 2016, sterling continued to depreciate and is almost 15% lower than a year ago compared with a basket of foreign currencies.
The stock of UK assets and liabilities with the rest of the world can be influenced by movements in exchange rates and price revaluations. Table 1 summarises which type of investment is impacted by these changes.
Most UK assets are held in foreign currency although a small portion of assets such as deposits and loans are held in sterling. Due to the UK’s Balance of Payments being presented in sterling, some assets have increased in value due to the devaluation of sterling. An article summarising the impact of exchange rates on direct investment abroad was previously published. While direct investment and portfolio investment liabilities are valued in sterling, some elements of other investment liabilities are held by foreign investors in foreign currency, so have also increased in value as a result of the sterling devaluation over recent periods.
Table 1: Revaluation impacts on investments
| Assets | Liabilities | |||
| Exchange rate movements | Price revaluations | Exchange rate movements | Price revaluations | |
| Direct Investment | Impact | Impact | No impact | Impact |
| Portfolio Investment | ||||
| Equities | Impact | Impact | No impact | Impact |
| Debt Securities | Impact | Impact | No impact | Impact |
| Other Investment | ||||
| Deposits | Impact | No impact | Impact | No impact |
| Loans | Impact | No impact | Impact | No impact |
| Source: Office for National Statistics | ||||
| Note: | ||||
| 1. Q1 refers to Quarter 1 (Jan to Mar), Q2 refers to Quarter 2 (Apr to June), Q3 refers to Quarter 3 (July to Sept) and Q4 refers to Quarter 4 (Oct to Dec). | ||||
Download this table Table 1: Revaluation impacts on investments
.xls (27.1 kB)Notes for: International investment position (Table K)
Throughout this release Quarter 1 refers to January to March, Quarter 2 refers to April to June, Quarter 3 refers to July to September, and Quarter 4 refers to October to December.
Back to table of contents13. Summary of revisions
Data in this release have been revised from Quarter 1 (Jan to Mar) 2015. Revisions tables are included in the balance of payments datasets (Tables R1, R2 and R3). Revisions are due to:
Trade in goods – Revisions from Quarter 1 (Jan to Mar) 2015 reflect the correction to the erratic series set out in the September 2016 Trade release, revised data from HM Revenue and Customs and other data suppliers, revised estimates of trading associated with VAT Missing Trader Intra-Community (MTIC) fraud and a seasonal adjustment review. Further information on trade is available in the UK Trade October 2016 statistical bulletin.
Trade in services – Revisions from Quarter 1 (Jan to Mar) 2015 are due to the introduction of annual 2015 benchmarks from the International Trade in Services survey, updated and late data to survey and administrative sources and a reassessment of seasonal factors.
Secondary income account – Revisions to the secondary income account are due to revised source data for transfers involving the UK government, the use of the latest data for various ONS surveys and a reassessment of seasonal factors.
Capital account – Revisions to the capital account are attributable to revised source data from HM Treasury and the ONS International Trade in Services (ITIS) survey.
Primary income, financial account and international investment position – Revisions from Quarter 1 (Jan to Mar) 2015 reflect the introduction of annual benchmarks from the 2015 Foreign Direct Investment (FDI) survey and the Financial Inquiries surveys, new and revised survey data, a reassessment of coverage adjustments to data from the Bank for International Settlements and a reassessment of seasonal factors. Revisions also reflect new estimates from the Bank for International Settlements.
Quarterly revisions to the current account balance as a percentage of GDP
Revisions to the current account balance as a percentage of GDP in this release may be due to revisions to the current account detailed in this section and/or changes to nominal GDP.
Table 2 provides revisions to the current account balance as a percentage of GDP annually for 2015 and quarterly between Quarter 1 2015 to Quarter 2 2016.
Table 2: Balance of Payments revisions to current account balance as a percentage of GDP, Quarter 3 (July to Sept) 2016
| % | |||
| Period | Current account balance as a percentage of GDP previously published | Current account balance as a percentage of GDP latest estimate | Revisions to total current account balance as a percentage of GDP (percentage points) |
| 2015 | -5.4 | -4.3 | 1.1 |
| 2015 Q1 | -5.4 | -4.6 | 0.8 |
| 2015 Q2 | -4.7 | -3.6 | 1.1 |
| 2015 Q3 | -4.4 | -3.4 | 1.0 |
| 2015 Q4 | -7.0 | -5.5 | 1.5 |
| 2016 Q1 | -5.7 | -4.9 | 0.8 |
| 2016 Q2 | -5.9 | -4.6 | 1.3 |
| Source: Office for National Statistics | |||
| Note: | |||
| 1. Q1 refers to Quarter 1 (Jan to Mar), Q2 refers to Quarter 2 (Apr to June), Q3 refers to Quarter 3 (July to Sept) and Q4 refers to Quarter 4 (Oct to Dec). | |||
Download this table Table 2: Balance of Payments revisions to current account balance as a percentage of GDP, Quarter 3 (July to Sept) 2016
.xls (27.1 kB)
Figure 12: Revisions to current account balance as a percentage of GDP by type of revision
Quarter 1 (Jan to Mar) 2014 to Quarter 3 (July to Sept) 2016

Source: Office for National Statistics
Notes:
- Q1 refers to Quarter 1 (Jan to Mar), Q2 refers to Quarter 2 (Apr to June), Q3 refers to (July to Sept) and Q4 refers to Quarter 4 (Oct to Dec).
Download this image Figure 12: Revisions to current account balance as a percentage of GDP by type of revision
.png (14.5 kB) .xls (28.2 kB)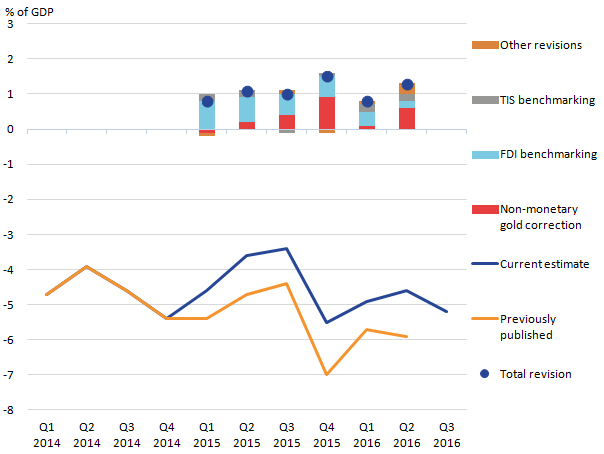
Revisions to the current account balance during the open period have mainly been due to 3 main revisions.
The correction of non-monetary gold as detailed in the October 2016 trade release. Revisions from this correction mostly narrowed the current account deficit.
The reconciliation of the quarterly ONS FDI survey to the annual ONS FDI survey. On a net earnings basis, the revision to 2015 as a whole narrowed the current account deficit by £12 billion. Revisions to Quarter 1 2016 and Quarter 2 2016 were partly due to information from the quarterly survey being carried forward. “Methods”, section 3 “Applying annual benchmarking data” discusses the FDI benchmark process in more detail. In addition, the annual FDI publication on 2 December 2016 discussed improvements to the sample design of quarterly FDI, which aims to reduce the magnitude of revisions in future from the annual benchmark process.
The reconciliation of the quarterly ONS ITIS survey to the annual ONS ITIS survey (the annual benchmark process).
Revisions to data outside of the open period
The revision window for this release is Quarter 1 2015 to Quarter 2 2016. As part of the quarterly round consistent with annual Blue Book and Pink Book (published one month before these much larger publications), the revision window is normally much longer to allow updated or new information from data sources to be taken on, and to implement methodological improvements to ensure comparability across the time series. It is therefore normal that there are some revisions to data sources which feed into the national accounts and balance of payments which are in the public domain but outside of the current revisions window.
The annual Foreign Direct Investment (FDI) survey released on 2 December 2016 included 2014 and 2015 annual estimates using information from the annual FDI survey. The quarterly FDI survey has been reconciled to the annual FDI estimates as part of the FDI benchmark process (see “Methods”, section 3 “Applying annual benchmarking data” for more information on the benchmark process). The benchmarked quarterly FDI estimates for 2015 have been incorporated into the estimates for the balance of payments and international investment position in today's publication.
The benchmarked quarterly FDI revised estimates for 2014 will be incorporated into the balance of payments and international investment position within the Quarter 2 2017 release on 29 September 2017, the next available opportunity. The annual FDI release published on 2 December 2016 provided information on the FDI revisions to 2014 that will be included within the BoP Quarter 2 2017 release, most notably the revisions to the FDI earnings within the primary income account.
The revision to 2014 FDI earnings would suggest a narrowing of the current account deficit of approximately £7 billion, all else being equal (from £85 billion as currently published to approximately £78 billion). However, at the point when 2014 FDI numbers are incorporated into the national accounts and balance of payments, all components will be open for revision to both updated and new data sources, as well as some improved methodology. It is unknown at this stage whether these other revisions will offset or increase the FDI revision to the current account balance, so the best 2014 estimates for the balance of payments and international investment position remain the unrevised published estimates within this release (which are consistent with Blue Book and Pink Book 2016). It is recommended that users who are specifically interested in the time series of FDI between 2014 and 2015 refer to the annual FDI release.
Back to table of contents