Table of contents
- Main points
- Things you need to know about this release
- Summary table of results
- Rate of inflation experienced by retired and non-retired households
- Rate of inflation experienced by income deciles
- Rate of inflation experienced by expenditure deciles
- Households with and without children
- Glossary
- Quality and methodology
- Annex A: Demographic characteristics
1. Main points
Consumer Prices Index including owner occupiers’ housing costs (CPIH)-consistent inflation rates have been calculated for different UK household groups.
Retired households have experienced slightly faster price growth than non-retired households since 2005 (2.3% on average per year compared with 2.2%); however, these averages conceal a larger variation in the 12-month inflation rates experienced by the two groups at different points over the period.
Since 2005, the rate of inflation experienced by lower income households has averaged 2.3% per year, compared with 2.1% per year for the higher income households.
Households with and without children have both, on average, experienced the same rate of inflation (2.2% on average per year).
CPIH has grown by 2.2% per year on average over the same period, in line with households in the middle of the income distribution.
The difference in the inflation rates experienced by different UK household groups has narrowed over the period since 2014.
2. Things you need to know about this release
What are CPIH consistent inflation rate estimates for UK household groups?
The Consumer Prices Index including owner occupiers’ housing costs (CPIH) is our most comprehensive measure of consumer price inflation. It measures the change in the prices of the goods and services as consumed by households. However, because the consumption baskets of specific households differ and because prices do not all change at the same rate, the price experience of different groups of households may differ from the average figure for all households. Producing CPIH-consistent inflation rates for different household groups therefore provides an insight into how these price changes can vary between different groups, within an established framework based on economic principles.
Users should note that the CPIH-consistent inflation rates for different household groups are experimental indices and therefore we would caution against any use other than for research purposes.
What household groups are presented in this article?
This article will cover the following household groups:
retired households and non-retired households
households grouped by equivalised disposable income deciles
households grouped by equivalised expenditure deciles
households with children and without children
For definitions of these terms, please see the Glossary at the end of this article.
If you would like to provide feedback on the choice of household groups presented, please send your comments to cpi@ons.gov.uk.
What is the structure of this release?
For each set of household groups, a similar structure is presented. The expenditure patterns for the household groups are covered first, followed by the average annual growth rates. We then look at contributions to the 12-month growth rate, which can highlight some of the main drivers of the changes in the inflation rate for each household group.
Quality and methodology information
For more information on the quality and methodology used to calculate these indices, please see the “Quality and methodology” section at the end of this article. We welcome feedback on these statistics to cpi@ons.gov.uk.
Previous research
The analysis presented in this article builds on research we published in 2014, entitled the Variation in the Inflation Experience of UK Households, 2003 to 2014. There are a number of improvements to the methodology used for this research compared with that used to produce the inflation rates in this article. The main difference is that these inflation rates are produced on a CPIH-consistent basis, whereas the research in 2014 produced the results on a Consumer Prices Index (CPI)-consistent basis. CPIH replaced CPI as our lead measure of inflation in March 2017. While the CPI is also based on economic principles, importantly it does not include certain housing costs, which are significant expenses for many households. Producing CPIH-consistent inflation rates for different household groups means that these estimates now include a measure of owner occupiers’ housing costs (OOH) and Council Tax that were not present in the previous iteration of our work.
Related publications
We are currently developing the Household Costs Indices (HCIs). The HCIs are a set of measures that aim to reflect UK households’ experience of changing prices and costs. For more information on the HCIs, including why they are being developed, how they differ from consumer price indices, and progress towards their development, can be found in the Developing the Household Costs Indices (HCIs) article.
Back to table of contents3. Summary table of results
Table 1: Average annual inflation rates for selected groups, UK, 2006 to 2016
| % | ||||||
| Group | Inflation | |||||
|---|---|---|---|---|---|---|
| Decile of | 1 | 2 | 9 | 10 | ||
| Disposable Income | 2.5 | 2.3 | 2.1 | 2.3 | ||
| Expenditure | 2.8 | 2.4 | 2.1 | 2.2 | ||
| Retired Households | 2.3 | |||||
| Non-Retired Households | 2.2 | |||||
| Households with Children | 2.2 | |||||
| Households without Children | 2.2 | |||||
| CPIH | 2.2 | |||||
| Source: Office for National Statistics Calculations | ||||||
| Notes: | ||||||
| 1. Deciles of disposable income and expenditure are calculated on an equivalised basis, adjusting for the composition of the household. See the Glossary for more details. | ||||||
| 2. Equivalised income deciles (1 equals lowest-income households, 10 equals highest-income households). | ||||||
| 3. Equivalised expenditure deciles (1 equals lowest-expenditure households, 10 equals highest-expenditure households). | ||||||
| 4. Differences may not sum due to rounding. | ||||||
| 5. The average presented is the compound average annual growth rate. | ||||||
Download this table Table 1: Average annual inflation rates for selected groups, UK, 2006 to 2016
.xls (29.2 kB)4. Rate of inflation experienced by retired and non-retired households
There is significant policy interest in differences in the inflation experience of households categorised by factors such as their retirement status.
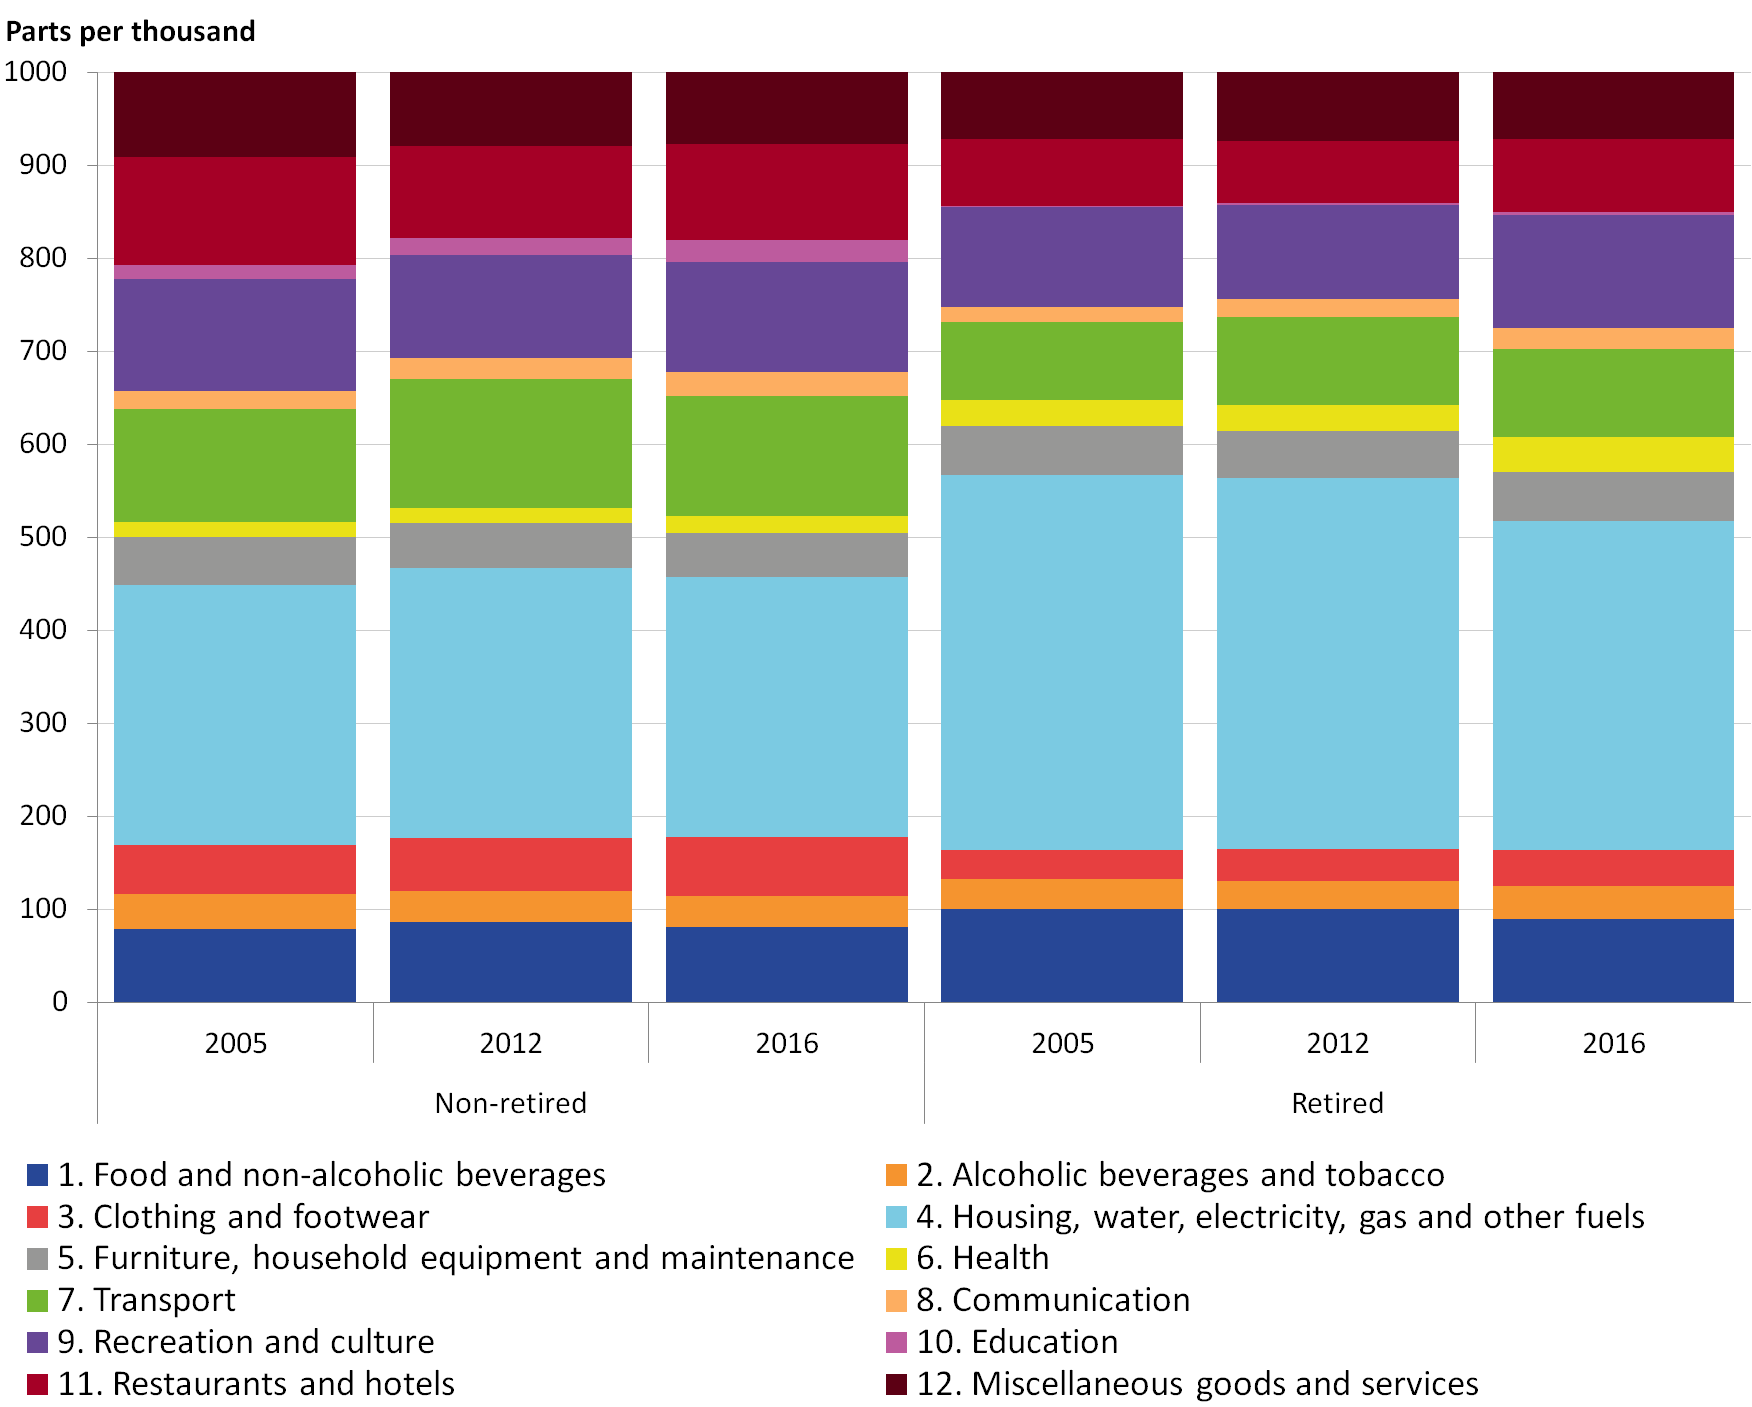
The only driver of differences between the inflation rates for each household group in this analysis is the share of expenditure, which they attribute to each category. Figure 1 presents household spending on each category (division) as a percentage of total expenditure for retired and non-retired household groups. The expenditure shares are fairly stable within groups over time but there are noticeable differences in the expenditure between the two groups. Retired households tend to spend more on housing-related goods and services while non-retired households have a relatively higher expenditure in education, transport, restaurants and hotels. Retired households also spend a larger proportion of their expenditure on health.
Figure 1: Expenditure shares for each category of spending, retired and non-retired households
UK, 2005, 2012 and 2016
Source: Office for National Statistics
Notes:
- Expenditure shares may not sum to 1000 due to rounding.
Download this image Figure 1: Expenditure shares for each category of spending, retired and non-retired households
.png (61.3 kB) .xls (22.5 kB)
Table 2 shows the annual rates of price growth experienced by retired and non-retired household groups between 2006 and 2016 (the last full year of data), compared with the Consumer Prices Index including owner occupiers’ housing costs (CPIH) annual rate of inflation. The final row of the table shows the average growth rate for each group over the same period.
Between 2006 and 2009, retired households consistently experienced higher rates of annual inflation compared with non-retired households. However, since 2010, there has only been one period (2016) where the annual inflation rate was higher for retired households. This has resulted in the average growth rate for retired households over the period 2005 to 2016 being only 0.1 percentage points higher compared with non-retired households. However, this average obscures the variation in inflation rates experienced by the two groups over the period.
Table 2: Annual inflation rates for retired and non-retired household groups, Consumer Prices Index including owner occupiers’ housing costs, UK, 2006 to 2016
| % | |||
| Year | Non-retired | Retired | CPIH |
|---|---|---|---|
| 2006 | 2.4 | 2.8 | 2.5 |
| 2007 | 2.3 | 2.6 | 2.4 |
| 2008 | 3.4 | 4.0 | 3.5 |
| 2009 | 1.9 | 2.4 | 2.0 |
| 2010 | 2.6 | 2.1 | 2.5 |
| 2011 | 3.9 | 3.6 | 3.8 |
| 2012 | 2.6 | 2.5 | 2.6 |
| 2013 | 2.3 | 2.1 | 2.3 |
| 2014 | 1.5 | 1.4 | 1.5 |
| 2015 | 0.4 | 0.4 | 0.4 |
| 2016 | 1.0 | 1.1 | 1.0 |
| Compound Average | 2.2 | 2.3 | 2.2 |
| Notes: | |||
| 1. The average presented is the compound average annual growth rate, and consequently may differ from the arithmetic average of the inflation rates presented. | |||
Download this table Table 2: Annual inflation rates for retired and non-retired household groups, Consumer Prices Index including owner occupiers’ housing costs, UK, 2006 to 2016
.xls (27.6 kB)The 12-month growth rate (Figure 2) can provide more clarity on this trend. Over the period to September 2009, retired households experienced a higher rate of inflation compared with non-retired households, with the maximum difference occurring in January 2009 (1.5 percentage points). This trend reverses over the period to October 2013, with non-retired households generally experiencing the higher rates of inflation. In the most recent period, the series begin to track each other more closely. In terms of cumulative price growth since 2005, prices for non-retired households grew by 31.2% by September 2017, while prices for retired households grew by 32.3%.
Figure 2: 12-month inflation rate for retired and non-retired households
UK, January 2006 to September 2017
Source: Office for National Statistics
Download this chart Figure 2: 12-month inflation rate for retired and non-retired households
Image .csv .xlsFigures 3 and 4 present the contributions to the 12-month growth rates for retired and non-retired households, which provide useful insight into the main drivers of these trends over time. The two series are driven by similar components: food and drink, housing, and electricity, gas and fuels. However, the differences in the magnitude with which these components affect the 12-month rates for each household group explain the divergence of growth rates (Figure 5).
Figure 3: Contributions to the 12-month percentage growth in inflation: non-retired households
UK, January 2006 to September 2017
Source: Office for National Statistics
Notes:
- Stacked bars reflect the percentage point contributions of each of the 87 class-level items to the annual percentage change in the CPIH-consistent inflation rate. The contribution of each of the 87 class-level items is estimated separately, before being aggregated to the categories. Note that a reduction in the contribution of series to the annual rate of change need not imply falling prices, but could also reflect a lower rate of increase than the previous year.
- Food, drink and tobacco is composed of food, non-alcoholic and alcoholic beverages and tobacco. Housing is composed of actual rents and products and services for the repair of dwellings. Owner occupiers’ housing costs (imputed rents) is a separate category. Elect., gas and fuel includes electricity, gas and other household fuels as well as fuels and lubricants for motor vehicles. Transport and package holidays includes passenger transport by road, rail, air and sea, as well as package holidays. Education reflects the division-level contribution. The “other” category reflects the combined contributions of the remaining class-level items, bringing the sum of contributions to the inflation rate.
- Contributions may not sum due to rounding.
Download this chart Figure 3: Contributions to the 12-month percentage growth in inflation: non-retired households
Image .csv .xls
Figure 4: Contributions to the 12-month percentage growth in inflation: retired households
UK, January 2006 to September 2017
Source: Office for National Statistics
Notes:
- Stacked bars reflect the percentage point contributions of each of the 87 class-level items to the annual percentage change in the CPIH-consistent inflation rate. The contribution of each of the 87 class-level items is estimated separately, before being aggregated to the categories. Note that a reduction in the contribution of series to the annual rate of change need not imply falling prices, but could also reflect a lower rate of increase than the previous year.
- Food, drink and tobacco is composed of food, non-alcoholic and alcoholic beverages and tobacco. Housing is composed of actual rents and products and services for the repair of dwellings. Owner occupiers’ housing costs (imputed rents) is a separate category. Elect., gas and fuel includes electricity, gas and other household fuels as well as fuels and lubricants for motor vehicles. Transport and package holidays includes passenger transport by road, rail, air and sea, as well as package holidays. Education reflects the division-level contribution. The “other” category reflects the combined contributions of the remaining class-level items, bringing the sum of contributions to the inflation rate.
- Contributions may not sum due to rounding.
Download this chart Figure 4: Contributions to the 12-month percentage growth in inflation: retired households
Image .csv .xls
Figure 5: Contributions to the difference in annual inflation: non-retired households less retired households
UK, January 2006 to September 2017
Source: Office for National Statistics
Notes:
- Stacked bars reflect the percentage point contributions of each of the 87 class-level items to the annual percentage change in the CPIH-consistent inflation rate. The contribution of each of the 87 class-level items is estimated separately, before being aggregated to the categories. Note that a reduction in the contribution of series to the annual rate of change need not imply falling prices, but could also reflect a lower rate of increase than the previous year.
- Food, drink and tobacco is composed of food, non-alcoholic and alcoholic beverages and tobacco. Housing is composed of actual rents and products and services for the repair of dwellings. Owner occupiers’ housing costs (imputed rents) is a separate category. Elect., gas and fuel includes electricity, gas and other household fuels as well as fuels and lubricants for motor vehicles. Transport and package holidays includes passenger transport by road, rail, air and sea, as well as package holidays. Education reflects the division-level contribution. The “other” category reflects the combined contributions of the remaining class-level items, bringing the sum of contributions to the inflation rate.
- Contributions may not sum due to rounding.
Download this chart Figure 5: Contributions to the difference in annual inflation: non-retired households less retired households
Image .csv .xlsThe two downward spikes observed in Figure 5 prior to October 2009 indicate that retired households experienced higher inflation in those periods compared with non-retired households. This was driven largely by electricity, gas and fuel, food and drink, and owner occupiers’ housing costs (OOH). The prices for these categories of items were rising during these time periods, and as retired households have a larger proportion of their expenditure attributed to these categories of items, they experienced faster growth. The positive peak shortly after indicates a higher rate of inflation for non-retired households. This was mainly driven by the differences in contributions from electricity, gas and fuel.
Higher positive contributions from education have consistently increased the rate of inflation experienced by non-retired households compared with retired households. This is to be expected as a higher share of expenditure on education for non-retired households will accentuate any fluctuations in the price of education for that particular group. Since October 2013, the larger contributions to the retired household inflation from OOH, and electricity, gas and fuel are offset by components such as housing, transport and package holidays, and education for non-retired households.
Back to table of contents5. Rate of inflation experienced by income deciles
As well as dividing household by retirement status, we can also look at the UK household population divided into income deciles: 10 equally-sized groups of households ranked by their equivalised disposable income. Figure 6 presents household spending on each category (division) as a percentage of total expenditure by each decile.
Figure 6: Expenditure shares by category of spending, by equivalised disposable income decile
UK, average 2005 to 2017

Source: Office for National Statistics
Notes:
- Equivalised disposable income deciles (1 equals lowest-income households, 10 equals highest-income households).
- Expenditure shares may not sum to 1,000 due to rounding.
- CPIH weights are the weights for each division averaged across the period of 2005 to 2017 (only the weights for January 2017 are included in the average).
Download this image Figure 6: Expenditure shares by category of spending, by equivalised disposable income decile
.png (59.8 kB) .xls (22.5 kB)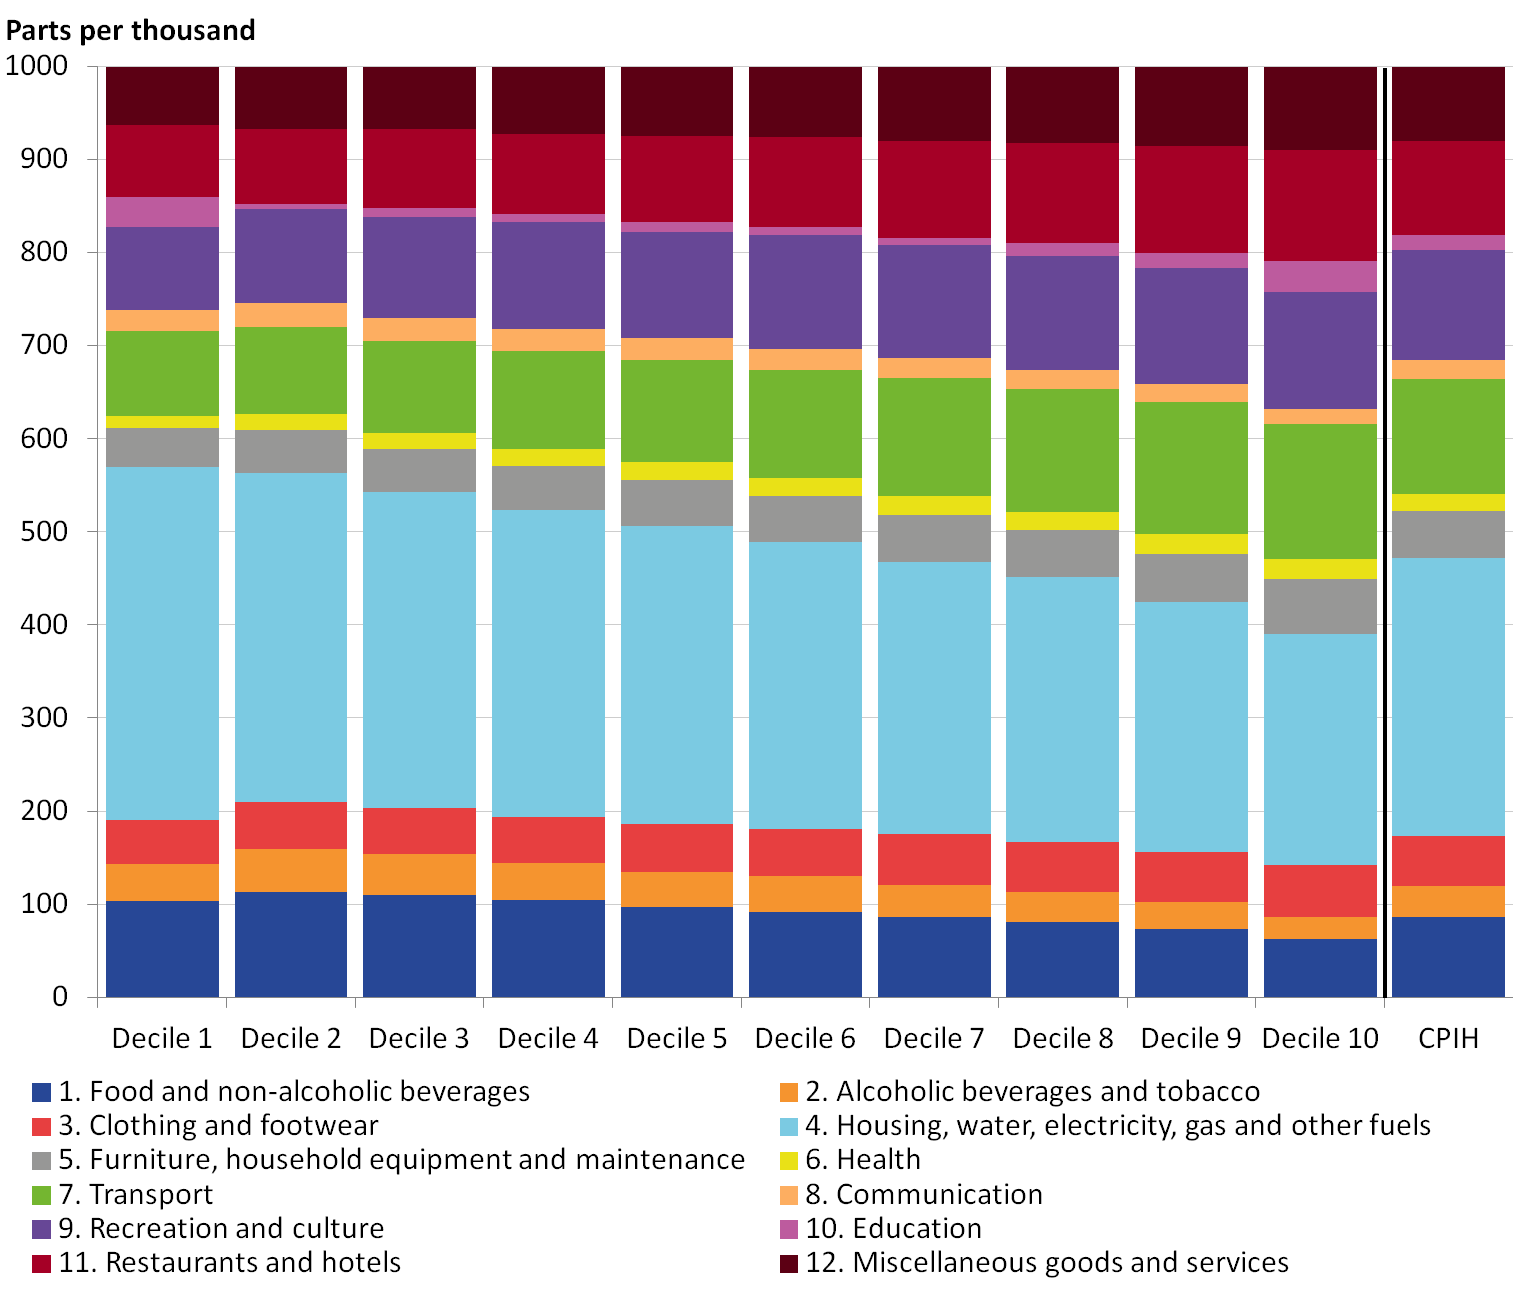
Spending on “essentials” such as food, housing and utilities declines smoothly as a fraction of total spending between the lowest and highest income deciles. Conversely, the fraction of expenditure on restaurants, hotels and transport tends to gradually increase. Education stands out from other divisions; the spending share between the first and second deciles drops sharply from 3% in decile one to just 0.6% in decile two.
Annex A contains some information on the demographic composition of the deciles and shows a sharp increase in the number of student households (with low current income) from decile one to decile two, which may explain the sharp increase in the education spending share. Because of the unusual composition of the lowest income decile, care should be taken when comparing this decile to other groups. Decile 10 may also contain unusually high-income households, so for the rest of this section we will focus on the difference between decile two and decile nine.
These differences in expenditure share cause differences in the inflation experience of these households. Table 3 shows the annual rates of price growth experienced by each equivalised income decile between 2006 and 2016 (the last full year of data), compared with the Consumer Prices Index including owner occupiers’ housing costs (CPIH) annual rate of inflation. It suggests that there is some variation in the rate of inflation experienced by households with differing levels of equivalised income: the average annual rate over this period varies between 2.5% for the lowest-income decile, and 2.1% for the seventh, eighth and ninth income deciles. The CPIH has on average grown by 2.2% over the same period. This is equivalent to the average growth rate experienced by the fourth, fifth and sixth deciles within the income distribution.
Table 3: Annual inflation rates for equivalised disposable income deciles, Consumer Prices Index including owner occupiers’ housing costs, UK, 2006 to 2016
| Equivalised disposable income decile | |||||||||||
|---|---|---|---|---|---|---|---|---|---|---|---|
| Year | 1 | 2 | 3 | 4 | 5 | 6 | 7 | 8 | 9 | 10 | CPIH |
| 2006 | 2.8 | 2.6 | 2.7 | 2.5 | 2.5 | 2.4 | 2.4 | 2.3 | 2.4 | 2.3 | 2.5 |
| 2007 | 2.8 | 2.7 | 2.4 | 2.3 | 2.4 | 2.4 | 2.3 | 2.3 | 2.3 | 2.5 | 2.4 |
| 2008 | 3.8 | 3.9 | 3.7 | 3.6 | 3.6 | 3.6 | 3.3 | 3.5 | 3.2 | 3.4 | 3.5 |
| 2009 | 2.1 | 2.3 | 2.0 | 2.3 | 2.3 | 2.1 | 1.8 | 1.9 | 1.6 | 2.0 | 2.0 |
| 2010 | 2.1 | 2.1 | 2.4 | 2.2 | 2.3 | 2.5 | 2.3 | 2.6 | 2.8 | 2.8 | 2.5 |
| 2011 | 3.9 | 3.8 | 3.9 | 3.8 | 3.7 | 3.9 | 3.8 | 4.0 | 3.8 | 3.9 | 3.8 |
| 2012 | 3.1 | 2.8 | 2.8 | 2.5 | 2.6 | 2.7 | 2.5 | 2.5 | 2.3 | 2.5 | 2.6 |
| 2013 | 2.7 | 2.4 | 2.3 | 2.3 | 2.3 | 2.3 | 2.2 | 2.1 | 2.3 | 2.3 | 2.3 |
| 2014 | 2.0 | 1.5 | 1.5 | 1.3 | 1.4 | 1.4 | 1.3 | 1.3 | 1.4 | 1.5 | 1.5 |
| 2015 | 0.9 | 0.3 | 0.3 | 0.3 | 0.3 | 0.2 | 0.2 | 0.3 | 0.4 | 0.7 | 0.4 |
| 2016 | 1.2 | 0.9 | 0.9 | 0.9 | 1.0 | 0.9 | 0.9 | 1.0 | 1.0 | 1.1 | 1.0 |
| Compound Average | 2.5 | 2.3 | 2.3 | 2.2 | 2.2 | 2.2 | 2.1 | 2.1 | 2.1 | 2.3 | 2.2 |
| Notes: | |||||||||||
| 1. The average presented is the compound average annual growth rate and consequently may differ from the arithmetic average of the inflation rates presented. Equivalised disposable income deciles (1 equals lowest-income households, 10 equals highest-income households) | |||||||||||
Download this table Table 3: Annual inflation rates for equivalised disposable income deciles, Consumer Prices Index including owner occupiers’ housing costs, UK, 2006 to 2016
.xls (29.2 kB)Figure 7 presents the annual inflation for the income deciles on a monthly basis between January 2006 and September 2017, alongside CPIH. The rate of inflation experienced by the first income decile is an outlier from the rest of the deciles, which may be due to the unusual household composition of the group. The spread between inflation rates is widest in January 2009. Since 2016, all income deciles have seen very similar inflation rates.
Figure 7: Range of 12-month growth rates for equivalised disposable income deciles, selected equivalised income deciles and Consumer Prices Index including owner occupiers’ housing costs
UK, January 2006 to September 2017

Source: Office for National Statistics
Notes:
- Equivalised income deciles (1 equals lowest-income households, 10 equals highest-income households).
Download this image Figure 7: Range of 12-month growth rates for equivalised disposable income deciles, selected equivalised income deciles and Consumer Prices Index including owner occupiers’ housing costs
.png (252.2 kB) .xls (41.5 kB)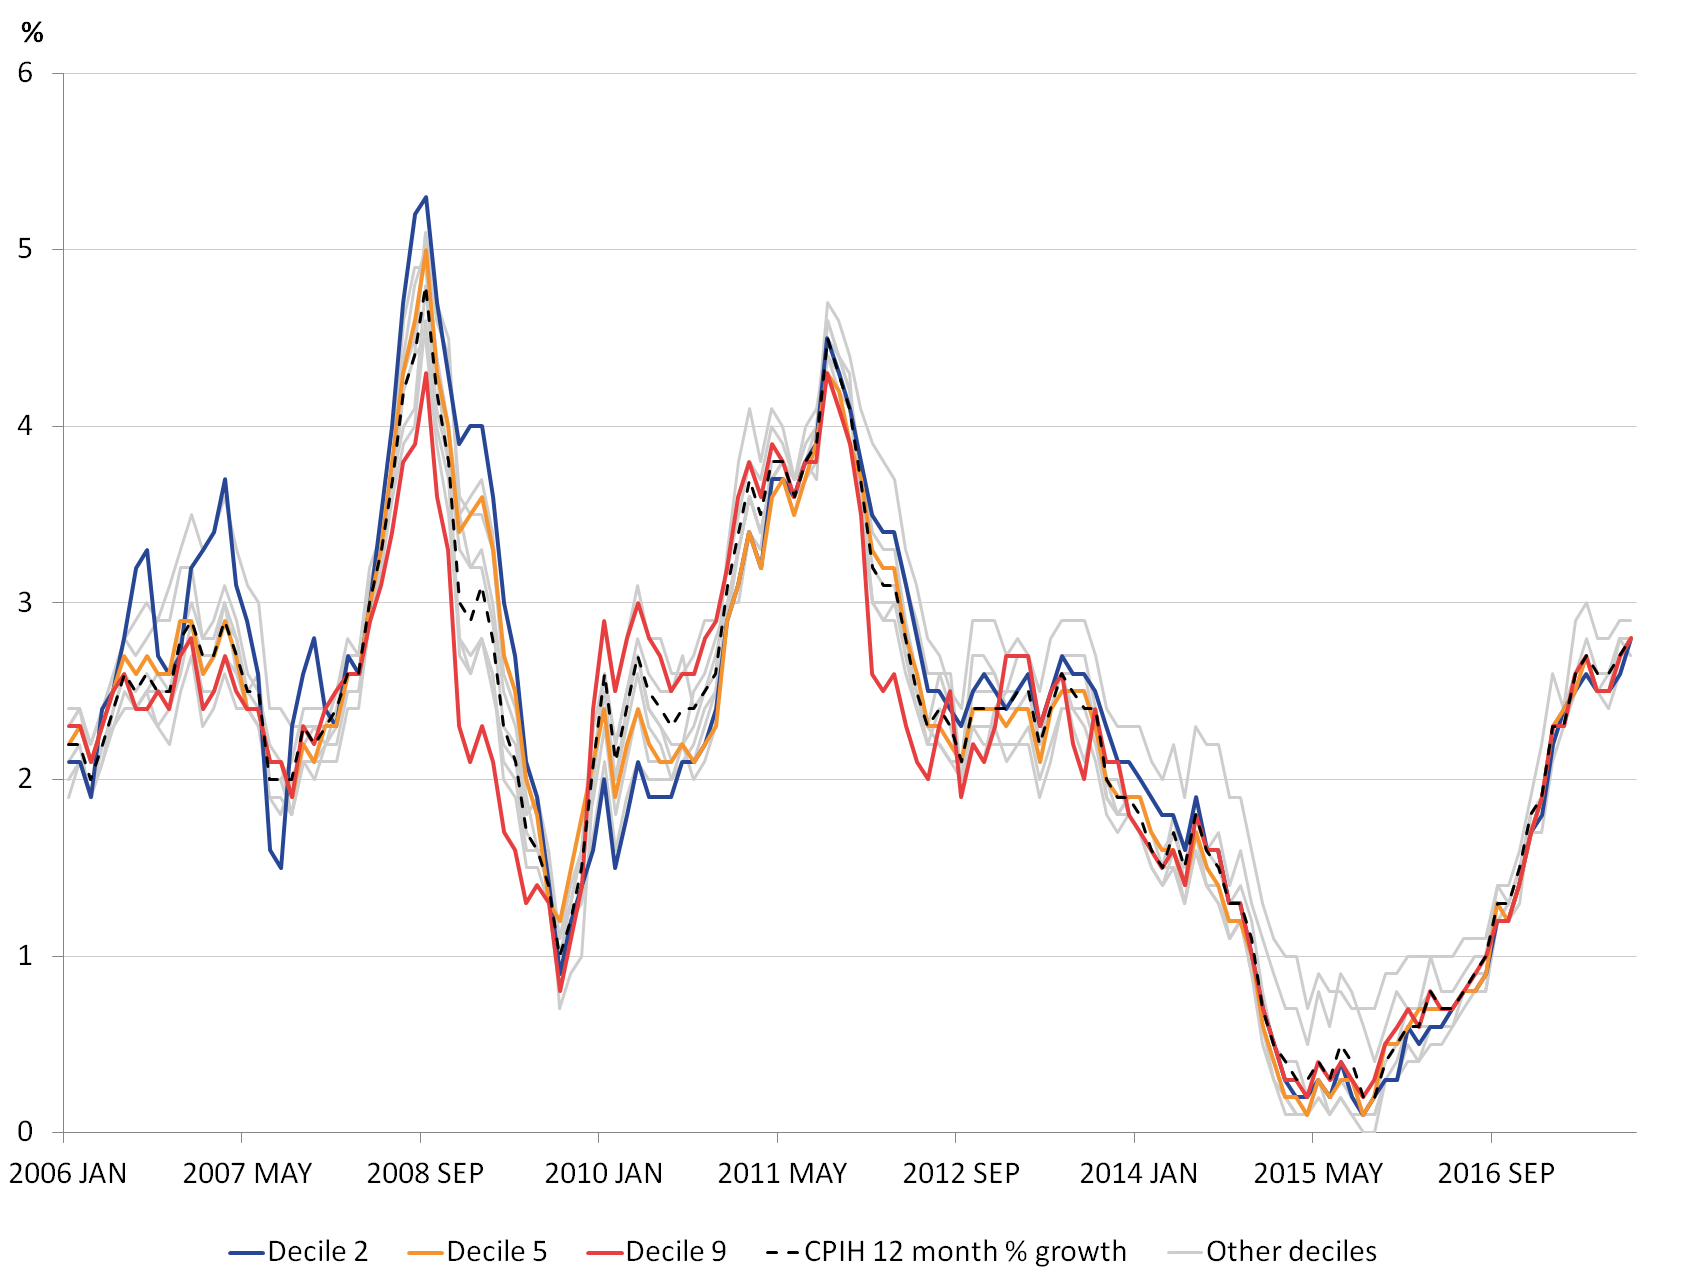
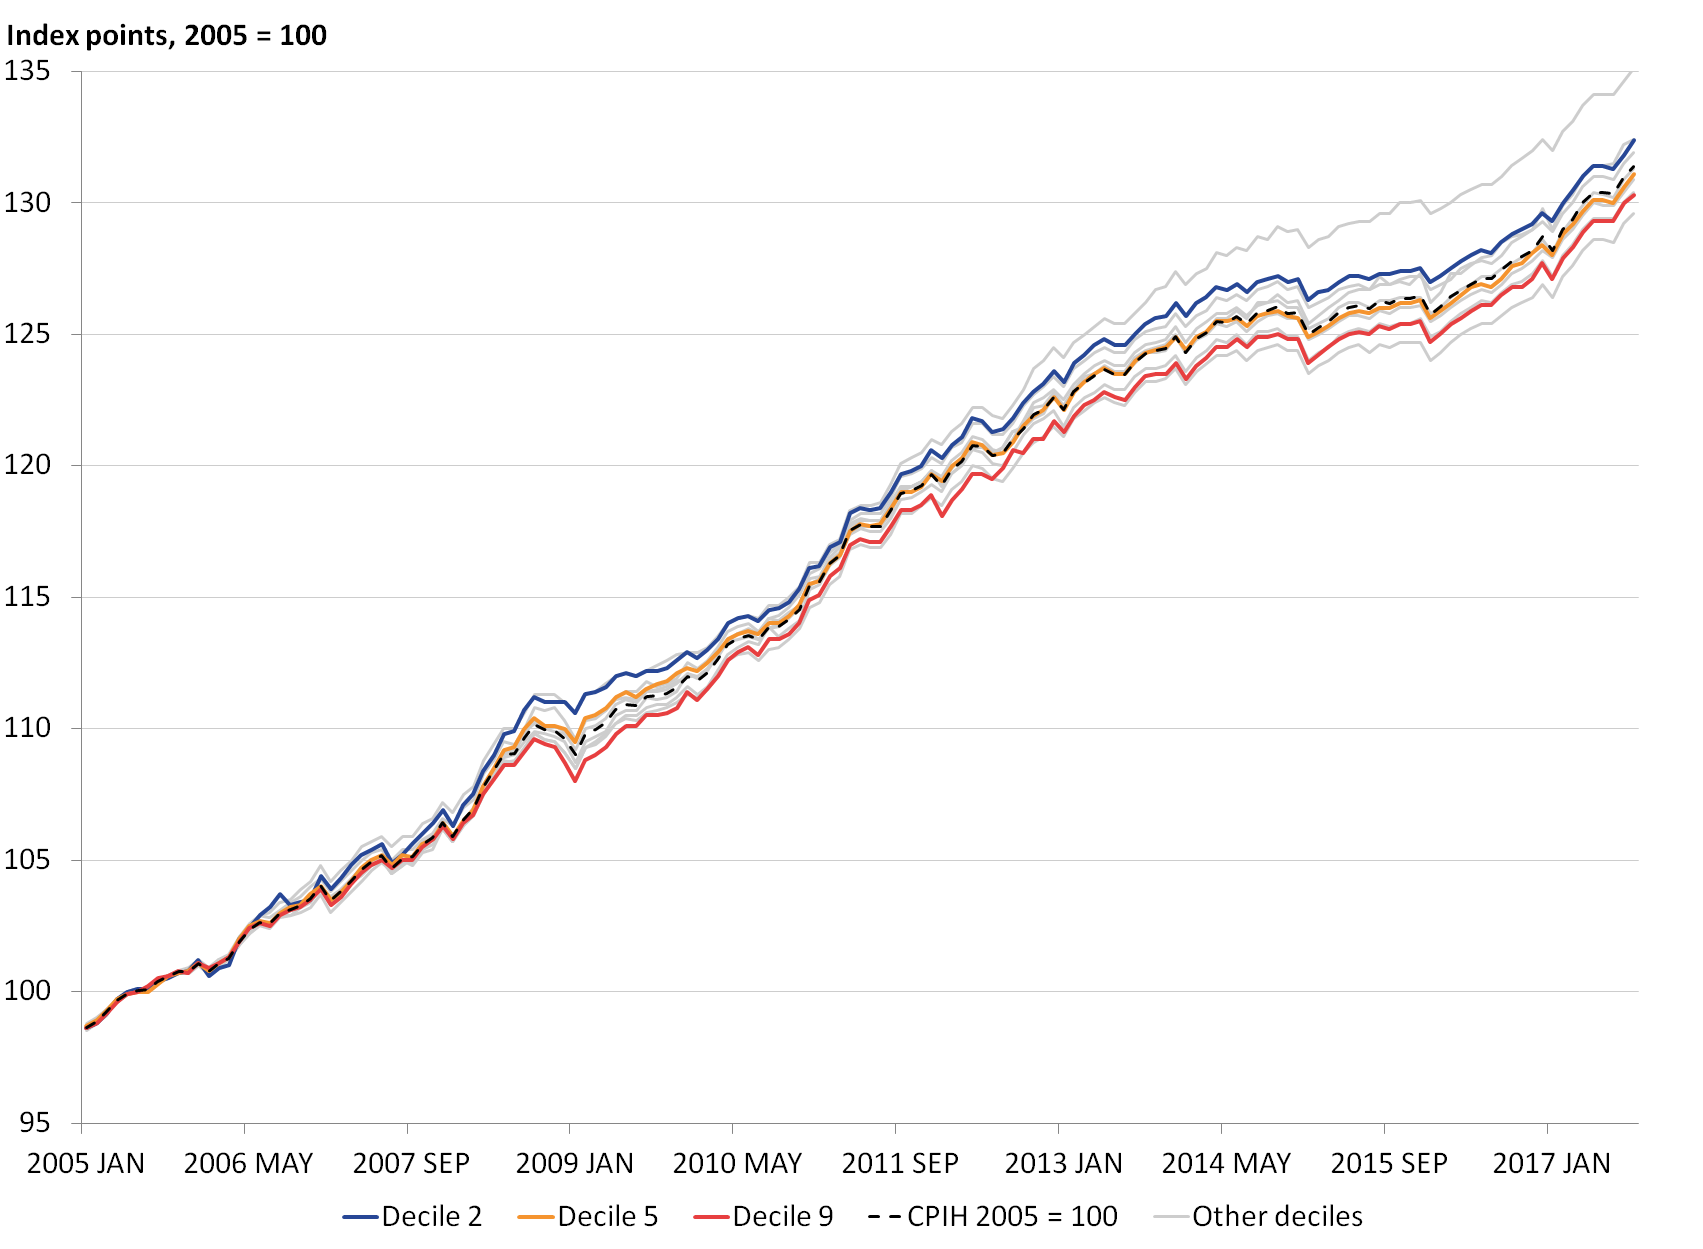
Cumulative price changes over time can be seen in Figure 8. Since 2005, prices for the goods and services purchased by the lowest-income households have risen by 35.1%, while the goods and services purchased by households in the seventh decile of the income distribution saw the lowest price change over the period, at 29.6%. If we exclude the first and tenth deciles, under the assumption that these may be influenced by the unusual household composition of these groups, the cumulative difference between the second and ninth decile is 2.1 index points over the period since 2005.
Note that individual households will only have experienced these differences if they were consistently placed in a given equivalised income decile through time. As households have been shown to move between income deciles through their life-cycle, the cumulative price impact presented in Figure 8 is for the goods and services that households in each decile purchase through time.
Figure 8: Range of cumulative price changes for equivalised disposable income deciles, selected equivalised income deciles and Consumer Prices Index including owner occupiers’ housing costs
UK, January 2005 to September 2017
Source: Office for National Statistics
Notes:
- Equivalised income deciles (1 equals lowest-income households, 10 equals highest-income households).
Download this image Figure 8: Range of cumulative price changes for equivalised disposable income deciles, selected equivalised income deciles and Consumer Prices Index including owner occupiers’ housing costs
.png (156.4 kB) .xls (40.4 kB)
The contributions to the 12-month growth rate (Figures 9 and 10) give an overview of the main drivers of the annual inflation rates for the second and ninth decile. These categories are broadly similar for both groups over time, including both food and drink, and energy prices. However, to understand what drives the disparity between the two series, we also need to see the differences between these contributions (Figure 11).
Figure 9: Contributions to the 12-month percentage growth in inflation: second equivalised disposable income decile
UK, January 2006 to September 2017
Source: Office for National Statistics
Notes:
- Stacked bars reflect the percentage point contributions of each of the 87 class-level items to the annual percentage change in the CPIH-consistent inflation rate. The contribution of each of the 87 class-level items is estimated separately, before being aggregated to the categories. Note that a reduction in the contribution of series to the annual rate of change need not imply falling prices, but could also reflect a lower rate of increase than the previous year.
- Food, drink and tobacco is composed of food, non-alcoholic and alcoholic beverages and tobacco. Housing is composed of actual rents and products and services for the repair of dwellings. Owner occupiers’ housing costs (imputed rents) is a separate category. Elect., gas and fuel includes electricity, gas and other household fuels as well as fuels and lubricants for motor vehicles. Transport and package holidays includes passenger transport by road, rail, air and sea, as well as package holidays. Education reflects the division-level contribution. The “other” category reflects the combined contributions of the remaining class-level items, bringing the sum of contributions to the inflation rate.
- Contributions may not sum due to rounding.
Download this chart Figure 9: Contributions to the 12-month percentage growth in inflation: second equivalised disposable income decile
Image .csv .xls
Figure 10: Contributions to the 12-month percentage growth in inflation: ninth equivalised disposable income decile
UK, January 2006 to September 2017
Source: Office for National Statistics
Notes:
- Stacked bars reflect the percentage point contributions of each of the 87 class-level items to the annual percentage change in the CPIH-consistent inflation rate. The contribution of each of the 87 class-level items is estimated separately, before being aggregated to the categories. Note that a reduction in the contribution of series to the annual rate of change need not imply falling prices, but could also reflect a lower rate of increase than the previous year.
- Food, drink and tobacco is composed of food, non-alcoholic and alcoholic beverages and tobacco. Housing is composed of actual rents and products and services for the repair of dwellings. Owner occupiers’ housing costs (imputed rents) is a separate category. Elect., gas and fuel includes electricity, gas and other household fuels as well as fuels and lubricants for motor vehicles. Transport and package holidays includes passenger transport by road, rail, air and sea, as well as package holidays. Education reflects the division-level contribution. The “other” category reflects the combined contributions of the remaining class-level items, bringing the sum of contributions to the inflation rate.
- Contributions may not sum due to rounding.
Download this chart Figure 10: Contributions to the 12-month percentage growth in inflation: ninth equivalised disposable income decile
Image .csv .xls
Figure 11: Contributions to the difference in annual inflation experienced by equivalised disposable income deciles: decile two less decile nine
UK, January 2006 to September 2017
Source: Office for National Statistics
Notes:
- Stacked bars reflect the percentage point contributions of each of the 87 class-level items to the annual percentage change in the CPIH-consistent inflation rate. The contribution of each of the 87 class-level items is estimated separately, before being aggregated to the categories. Note that a reduction in the contribution of series to the annual rate of change need not imply falling prices, but could also reflect a lower rate of increase than the previous year.
- Food, drink and tobacco is composed of food, non-alcoholic and alcoholic beverages and tobacco. Housing is composed of actual rents and products and services for the repair of dwellings. Owner occupiers’ housing costs (imputed rents) is a separate category. Elect., gas and fuel includes electricity, gas and other household fuels as well as fuels and lubricants for motor vehicles. Transport and package holidays includes passenger transport by road, rail, air and sea, as well as package holidays. Education reflects the division-level contribution. The “other” category reflects the combined contributions of the remaining class-level items, bringing the sum of contributions to the inflation rate.
- Contributions may not sum due to rounding.
Download this chart Figure 11: Contributions to the difference in annual inflation experienced by equivalised disposable income deciles: decile two less decile nine
Image .csv .xlsThe reason behind the recent convergence of inflation rates between deciles can now be explained by the balance of contributions at the end of the period. Figure 11 indicates that the contribution from housing and later from food and drink, act to increase the inflation rate for the lower-income households compared with households in the ninth income decile. By comparison, education and the “other” category act to increase the inflation rate for the ninth decile compared with the second decile. The magnitudes of these contributions cancel out however, leading to the convergence of these inflation rates.
In general over the period, the food and drink category adds 0.2 percentage points on average to the difference in inflation rates of low-income households compared with households in the ninth income decile. The contribution from electricity, gas and fuels is more volatile, reflecting the underlying instability in these prices.
Back to table of contents6. Rate of inflation experienced by expenditure deciles
Analysis on an expenditure basis is a useful complement to income. Some households' lower levels of income may be the result of temporary factors, for example, related to the nature of self-employment. When incomes fall temporarily such households may maintain their expenditure by running down savings or borrowing. In this situation, household expenditure might be a better indicator of standard of living than household income.
However, one important aspect to consider is the effect of including owner occupiers’ housing costs. Because housing expenditure makes up a large part of a households budget, households in the lowest expenditure decile are often allocated to this decile due to having low levels of expenditure on owner occupiers’ housing costs (OOH). Although this is conceptually the correct approach, it is important to understand that the allocation of households in the first decile could therefore be dependent on a single expenditure component (OOH), while their expenditure in other categories may remain comparable with those in other deciles. With this in mind, the following section presents the results for deciles of household expenditure with a focus on deciles two and nine.
Figure 12 shows the share of total expenditure that is allocated to each of the 12 categories of spending for each of the equivalised expenditure deciles – 10 equally-sized groups of households ranked according to their equivalised expenditure totals. Households in the first decile tend to dedicate a larger proportion of their expenditure to food and non-alcoholic beverages compared with households in other deciles. This is also true for alcohol and tobacco. Spending shares in these divisions decrease as we move up the expenditure distribution from lowest expenditure households to highest expenditure households. Conversely, households with higher expenditure tend to spend a larger proportion of their expenditure on less essential categories of spending – for example, restaurants and cafes.
Figure 12: Expenditure shares by category of spending, by equivalised expenditure decile
UK, average 2005 to 2017

Source: Office for National Statistics
Notes:
- Equivalised expenditure deciles (1 equals lowest expenditure households, 10 equals highest expenditure households).
- Expenditure shares may not sum to 1000 due to rounding.
- CPIH weights are the weights for each division averaged across the period of 2005 to 2017 (only the weights for January 2017 are included in the average).
Download this image Figure 12: Expenditure shares by category of spending, by equivalised expenditure decile
.png (60.5 kB) .xls (22.5 kB)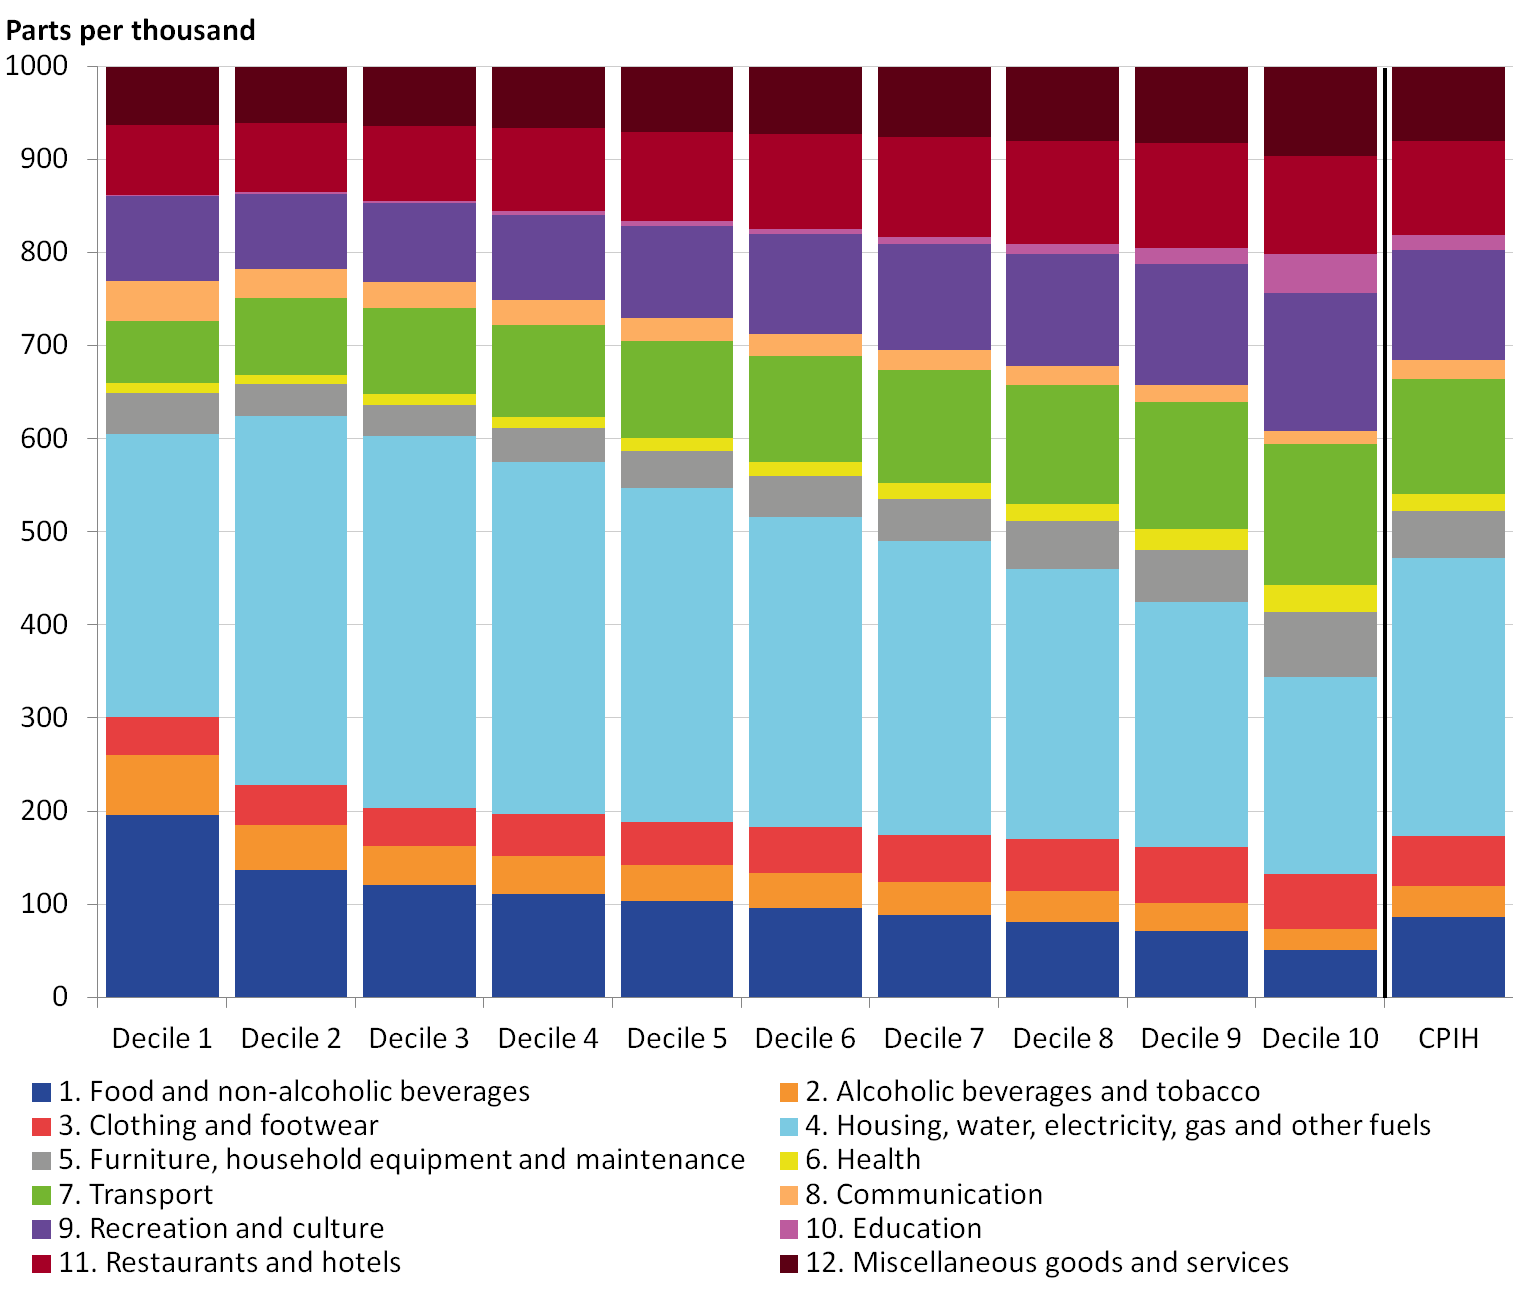
The expenditure share on housing is of particular interest as it falls gradually throughout the decile distribution, with the exception of a noticeable “kink” between deciles one and two. The housing division is composed of owner occupiers’ housing costs (OOH) alongside other housing expenditure categories such as actual rent. As discussed, households in the lowest expenditure decile are often allocated to this decile due to having low levels of expenditure on OOH. This is shown in Table 6 (see Annex A), which contains some information on the demographic composition of the deciles. Decile one only contains an average of 1% of owner occupiers and 40% of subsidised renters (that is, households with a tenure type of local authority, housing association or rent free). This means that the housing category will receive a much smaller share of expenditure for households in the first expenditure decile compared with the rest of the distribution.
This can also explain why decile one has relatively higher expenditure shares for categories such as food and drink. The underlying data show that total expenditure for decile one is around half of that for the second expenditure decile, much of which is due to differences in expenditure on OOH. This means that the proportion of that expenditure taken up by other categories of spending may be relatively higher compared with other expenditure deciles. Care should therefore be taken when comparing this decile to other groups. Decile 10 may also contain unusually high-expenditure households, so for the rest of this section we will focus on the difference between decile two and decile nine.
Table 4 shows the annual rates of price growth experienced by each equivalised expenditure decile between 2006 and 2016 (the last full year of data), compared with the Consumer Prices Index including owner occupiers’ housing costs (CPIH) annual rate of inflation. The final row of the table shows the average growth rate for each group over the same period. Annual growth rates and indices on a monthly basis can be found in the related data download.
Table 4: Annual inflation rates for equivalised expenditure deciles, Consumer Prices Index including owner occupiers’ housing costs, UK, 2006 to 2016
| Equivalised expenditure decile | |||||||||||
| Year | 1 | 2 | 3 | 4 | 5 | 6 | 7 | 8 | 9 | 10 | CPIH |
|---|---|---|---|---|---|---|---|---|---|---|---|
| 2006 | 3.8 | 3.2 | 3.0 | 2.8 | 2.8 | 2.6 | 2.5 | 2.4 | 2.2 | 1.9 | 2.5 |
| 2007 | 3.2 | 2.8 | 2.7 | 2.5 | 2.5 | 2.4 | 2.3 | 2.3 | 2.2 | 2.3 | 2.4 |
| 2008 | 4.9 | 4.2 | 4.1 | 3.9 | 3.8 | 3.6 | 3.4 | 3.3 | 3.1 | 3.2 | 3.5 |
| 2009 | 3.0 | 2.3 | 2.1 | 2.0 | 1.8 | 1.9 | 2.0 | 1.7 | 1.7 | 2.1 | 2.0 |
| 2010 | 2.2 | 2.0 | 2.1 | 2.2 | 2.4 | 2.3 | 2.3 | 2.4 | 2.6 | 3.0 | 2.5 |
| 2011 | 4.6 | 4.1 | 4.0 | 4.1 | 3.9 | 4.0 | 3.9 | 3.8 | 3.8 | 3.5 | 3.8 |
| 2012 | 3.5 | 3.0 | 2.9 | 2.8 | 2.7 | 2.6 | 2.6 | 2.6 | 2.5 | 2.2 | 2.6 |
| 2013 | 3.1 | 2.5 | 2.4 | 2.3 | 2.3 | 2.2 | 2.2 | 2.2 | 2.2 | 2.4 | 2.3 |
| 2014 | 1.8 | 1.6 | 1.5 | 1.5 | 1.4 | 1.3 | 1.4 | 1.4 | 1.5 | 1.5 | 1.5 |
| 2015 | 0.0 | 0.3 | 0.3 | 0.3 | 0.3 | 0.2 | 0.3 | 0.3 | 0.4 | 0.7 | 0.4 |
| 2016 | 0.5 | 0.9 | 0.9 | 1.0 | 1.0 | 1.0 | 1.0 | 0.9 | 1.0 | 1.1 | 1.0 |
| Compound Average | 2.8 | 2.4 | 2.4 | 2.3 | 2.2 | 2.2 | 2.2 | 2.1 | 2.1 | 2.2 | 2.2 |
| Notes: | |||||||||||
| 1. The average presented is the compound average annual growth rate and consequently may differ from the arithmetic average of the inflation rates presented. | |||||||||||
| 2. Equivalised expenditure deciles (1 equals lowest expenditure households, 10 equals highest expenditure households). | |||||||||||
Download this table Table 4: Annual inflation rates for equivalised expenditure deciles, Consumer Prices Index including owner occupiers’ housing costs, UK, 2006 to 2016
.xls (28.7 kB)Over much of the period, the lower expenditure deciles have experienced a higher rate of inflation. On average, the average annual rate for the second expenditure decile is 0.3 percentage points higher compared with the ninth expenditure decile. However, 2010, 2015 and 2016 provide exceptions to this pattern, with the lower expenditure households having a lower rate of inflation compared with the higher expenditure households. The compound average annual growth rate for CPIH over this period was 2.2%. This is equivalent to the growth rate experienced by the fifth, sixth and seventh deciles of the expenditure distribution.
Looking at the contributions to the 12-month rate (Figures 13 and 14) can provide some insight into why low expenditure households may have experienced lower rates of inflation for these years. In 2015 and 2016, both the second and ninth expenditure deciles experienced downwards pressure on their inflation rate from food and drink, and electricity, gas and fuels. A similar pattern was seen in the contributions to the overall CPIH 12-month rate, which reflected the supermarket price war and falling oil price respectively over the period.
From looking at the expenditure shares for these deciles however, it is clear that the lower expenditure households would have benefitted most from these falling prices, as they have a higher expenditure weight on these categories. This resulted in the second expenditure decile having larger negative contributions from these categories, compared with the ninth expenditure decile.
Figure 13: Contributions to the 12-month percentage growth in inflation: second equivalised expenditure decile
UK, January 2006 to September 2017
Source: Office for National Statistics
Notes:
- Stacked bars reflect the percentage point contributions of each of the 87 class-level items to the annual percentage change in the CPIH-consistent inflation rate. The contribution of each of the 87 class-level items is estimated separately, before being aggregated to the categories. Note that a reduction in the contribution of series to the annual rate of change need not imply falling prices, but could also reflect a lower rate of increase than the previous year.
- Food, drink and tobacco is composed of food, non-alcoholic and alcoholic beverages and tobacco. Housing is composed of actual rents and products and services for the repair of dwellings. Owner occupiers’ housing costs (imputed rents) is a separate category. Elect., gas and fuel includes electricity, gas and other household fuels as well as fuels and lubricants for motor vehicles. Transport and package holidays includes passenger transport by road, rail, air and sea, as well as package holidays. Education reflects the division-level contribution. The “other” category reflects the combined contributions of the remaining class-level items, bringing the sum of contributions to the inflation rate.
- Contributions may not sum due to rounding.
Download this chart Figure 13: Contributions to the 12-month percentage growth in inflation: second equivalised expenditure decile
Image .csv .xlsFigure 14: Contributions to the 12-month percentage growth in inflation: ninth equivalised expenditure decile
UK, January 2006 to September 2017
Source: Office for National Statistics
Notes:
- Stacked bars reflect the percentage point contributions of each of the 87 class-level items to the annual percentage change in the CPIH-consistent inflation rate. The contribution of each of the 87 class-level items is estimated separately, before being aggregated to the categories. Note that a reduction in the contribution of series to the annual rate of change need not imply falling prices, but could also reflect a lower rate of increase than the previous year.
- Food, drink and tobacco is composed of food, non-alcoholic and alcoholic beverages and tobacco. Housing is composed of actual rents and products and services for the repair of dwellings. Owner occupiers’ housing costs (imputed rents) is a separate category. Elect., gas and fuel includes electricity, gas and other household fuels as well as fuels and lubricants for motor vehicles. Transport and package holidays includes passenger transport by road, rail, air and sea, as well as package holidays. Education reflects the division-level contribution. The “other” category reflects the combined contributions of the remaining class-level items, bringing the sum of contributions to the inflation rate.
- Contributions may not sum due to rounding.
Download this chart Figure 14: Contributions to the 12-month percentage growth in inflation: ninth equivalised expenditure decile
Image .csv .xlsWe can see the differences in the main drivers more clearly in Figure 15. For example, the difference in contributions from food and drink, and electricity, gas and fuels in 2015 and 2016 led to these categories increasing the 12-month growth rate for high-expenditure households compared with the low-expenditure households.
The larger differences between the second and ninth deciles before the beginning of 2015 are caused by a variety of factors. Higher positive contributions from food and drink have consistently increased the rate of inflation experienced by low expenditure households compared with high expenditure households over the period to November 2014. By comparison, transport and package holidays have consistently increased the rate of inflation for high expenditure households. The convergence of the deciles in terms of annual growth rates and the narrowing spread between them can be explained by a more stable balance of contributions since the beginning of 2015.
Figure 15: Contributions to the difference in annual inflation experienced by equivalised expenditure deciles: decile two less decile nine
UK, January 2006 to September 2017
Source: Office for National Statistics
Notes:
- Stacked bars reflect the percentage point contributions of each of the 87 class-level items to the annual percentage change in the CPIH-consistent inflation rate. The contribution of each of the 87 class-level items is estimated separately, before being aggregated to the categories. Note that a reduction in the contribution of series to the annual rate of change need not imply falling prices, but could also reflect a lower rate of increase than the previous year.
- Food, drink and tobacco is composed of food, non-alcoholic and alcoholic beverages and tobacco. Housing is composed of actual rents and products and services for the repair of dwellings. Owner occupiers’ housing costs (imputed rents) is a separate category. Elect., gas and fuel includes electricity, gas and other household fuels as well as fuels and lubricants for motor vehicles. Transport and package holidays includes passenger transport by road, rail, air and sea, as well as package holidays. Education reflects the division-level contribution. The “other” category reflects the combined contributions of the remaining class-level items, bringing the sum of contributions to the inflation rate.
- Contributions may not sum due to rounding.
Download this chart Figure 15: Contributions to the difference in annual inflation experienced by equivalised expenditure deciles: decile two less decile nine
Image .csv .xls7. Households with and without children
The final household group analysed is households with and without children. Whether or not there are children within a household can influence what goods and services the household purchases. Therefore, we explore the expenditure patterns and inflation experience of both groups.
Figure 16 presents the expenditure patterns of households with and without children by category of spending. Similar to the retired and non-retired households, the fraction of expenditure allocated to the various divisions for both households with and without children has remained fairly stable over time. However the differences between the groups are more noticeable. For example, households with children tend to focus more of their expenditure on education, food and drink, while households without children spend slightly more on housing-related expenditure. In general, however, the differences between expenditure shares for these groups are not as high as those between retired and non-retired households.
Figure 16: Expenditure shares by category of spending, households with and without children
UK, 2005, 2012 and 2016

Source: Office for National Statistics
Notes:
- Expenditure shares may not sum to 1,000 due to rounding.
Download this image Figure 16: Expenditure shares by category of spending, households with and without children
.png (61.6 kB) .xls (21.5 kB)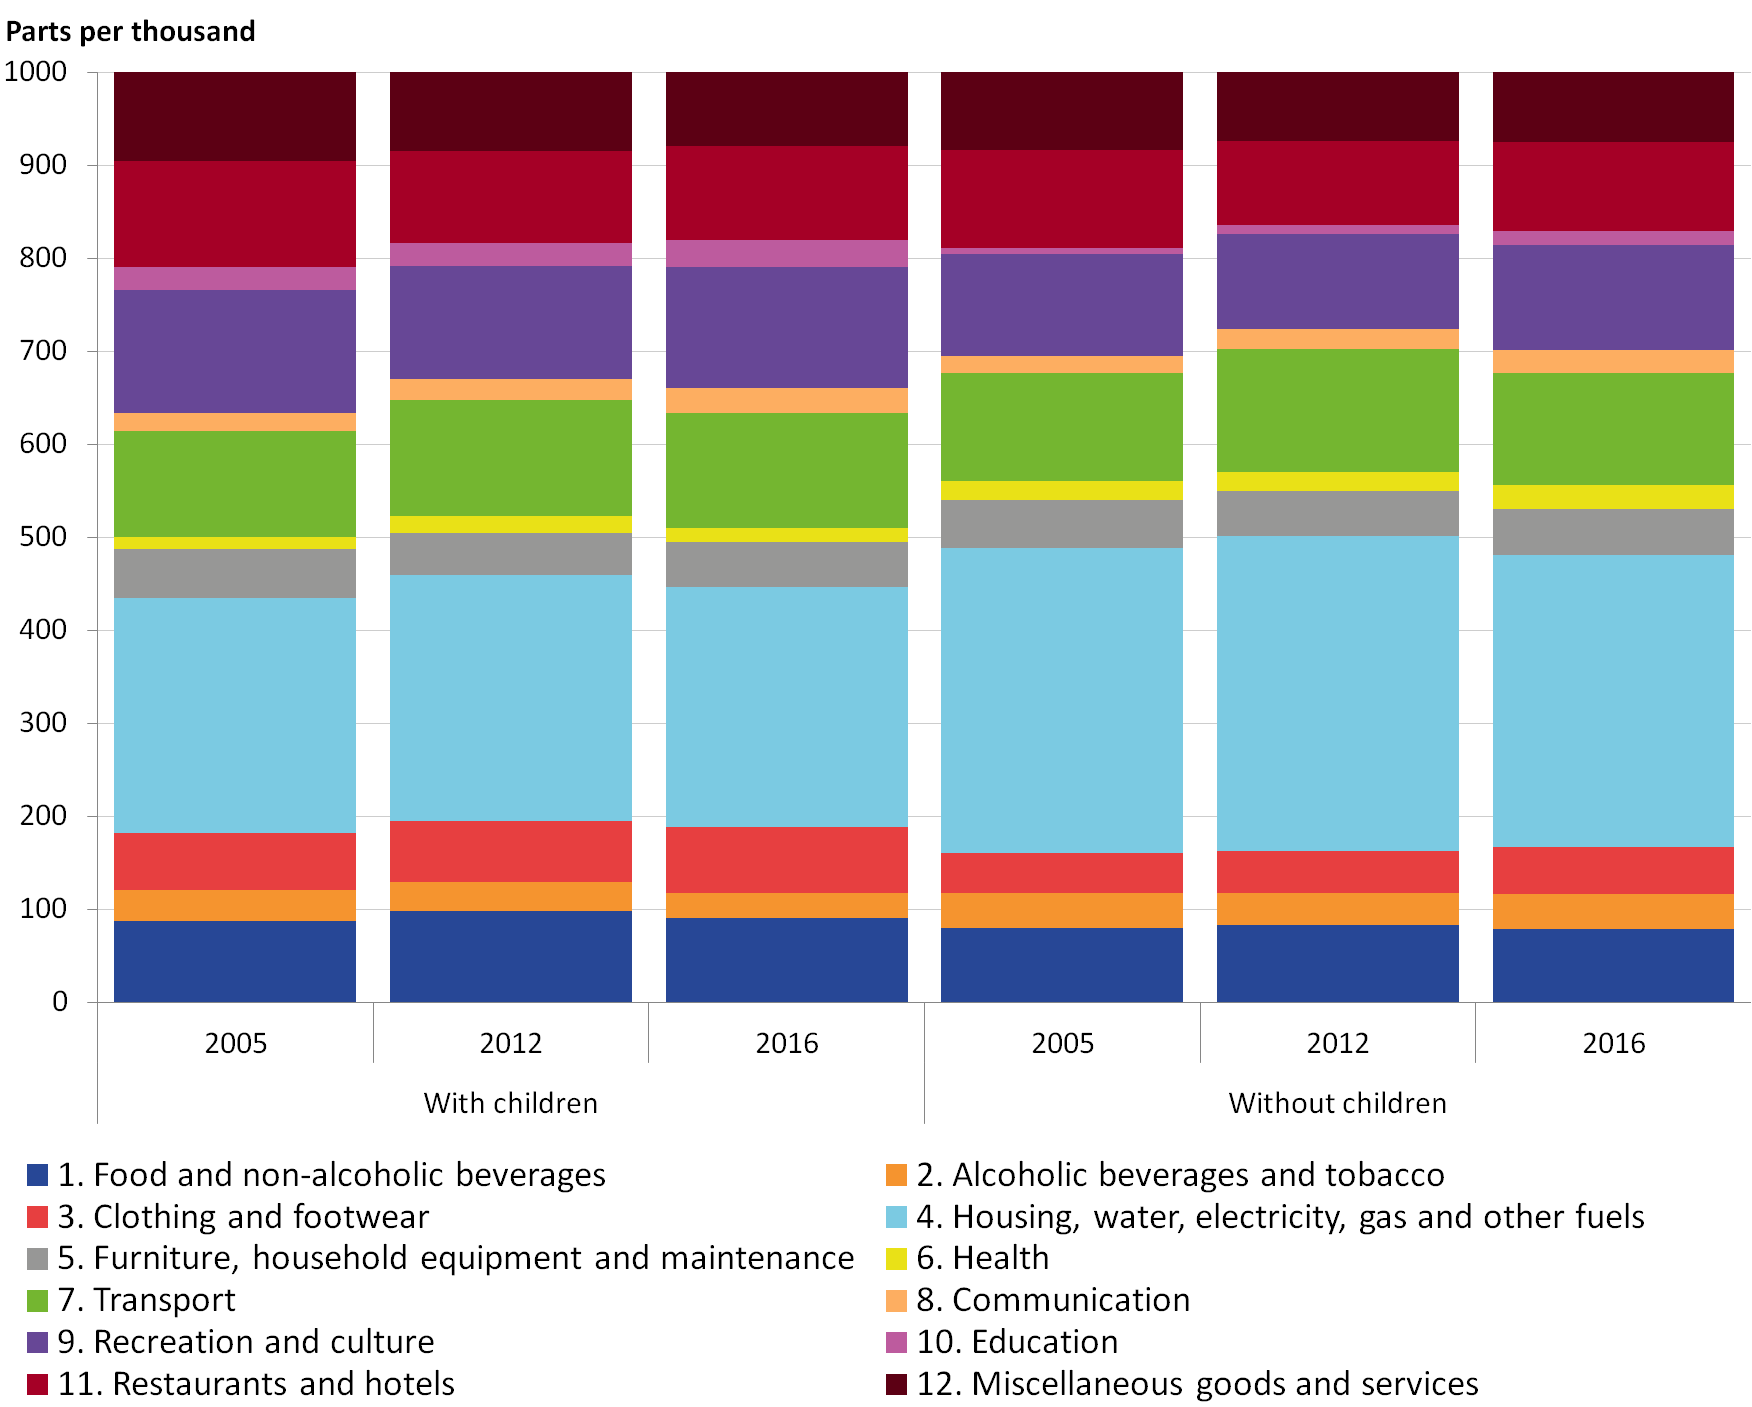
The similarities in expenditure patterns have contributed to households with and without children experiencing a similar rate of inflation over the period. The final row of Table 5 shows that the average growth rate for each group over the period was the same, at 2.2%. The maximum difference between the two groups was in 2006, where the difference was 0.4 percentage points. In the following years, the annual inflation rates were within 0.2 percentage points of each other. The cumulative difference between the two groups over the period since 2005 was 1.1 percentage points. Prices for households without children grew by 31.7%, while households with children saw their prices rise by 30.7%.
Table 5: Annual inflation rates for households with and without children, Consumer Prices Index including owner occupiers’ housing costs, UK, 2006 to 2016
| % | |||
| Year | With children | Without children | CPIH |
|---|---|---|---|
| 2006 | 2.2 | 2.6 | 2.5 |
| 2007 | 2.3 | 2.5 | 2.4 |
| 2008 | 3.4 | 3.6 | 3.5 |
| 2009 | 1.9 | 2.0 | 2.0 |
| 2010 | 2.5 | 2.5 | 2.5 |
| 2011 | 3.9 | 3.8 | 3.8 |
| 2012 | 2.6 | 2.5 | 2.6 |
| 2013 | 2.4 | 2.3 | 2.3 |
| 2014 | 1.5 | 1.4 | 1.5 |
| 2015 | 0.3 | 0.4 | 0.4 |
| 2016 | 0.9 | 1.0 | 1.0 |
| Compound Average | 2.2 | 2.2 | 2.2 |
| Notes: | |||
| 1. The average presented is the compound average annual growth rate and consequently may differ from the arithmetic average of the inflation rates presented. | |||
Download this table Table 5: Annual inflation rates for households with and without children, Consumer Prices Index including owner occupiers’ housing costs, UK, 2006 to 2016
.xls (27.6 kB)Due to the similarity between the two inflation rates, the contributions charts have not been presented in this section and instead can be found in the data download.
Back to table of contents8. Glossary
Equivalised
Income and expenditure groups are based on a ranking of households by equivalised income and expenditure. Equivalisation is the process of accounting for the fact that households with many members are likely to need a higher income to achieve the same standard of living as households with fewer members.
Equivalisation takes into account the number of people living in the household and their ages, acknowledging that while a household with two people in it will need more money to sustain the same living standards as one with a single person, the two-person household is unlikely to need double the income. This analysis uses the modified-Organisation for Economic Co-operation and Development (OECD) equivalisation scale.
Disposable income
Disposable income is that which is available for consumption and is equal to all income from wages and salaries, self-employment, private pensions and investments, plus cash benefits less direct taxes.
Disposable income deciles
Households are grouped into deciles (or tenths) based on their equivalised disposable income. The richest decile (decile 10) is the 10% of households with the highest equivalised disposable income. Similarly, the poorest decile (decile one) is the 10% of households with the lowest equivalised disposable income.
Expenditure deciles
Households are grouped into deciles (or tenths) based on their equivalised expenditure. The highest-expenditure decile (decile 10) is the 10% of households with the highest equivalised expenditure. Similarly, the lowest-expenditure decile (decile one) is the 10% of households with the lowest equivalised expenditure.
Households with children
Households with children are defined as any household with one or more household members who are under 18 years of age, in full-time education and have never been married.
Retired persons and households
A retired person is defined as anyone who describes themselves (in the Living Costs and Food Survey (LCF)) as “retired” or anyone over minimum National Insurance pension age describing themselves as “unoccupied” or “sick or injured but not intending to seek work”. A retired household is defined as one where the combined income of retired members amounts to at least half the total gross income of the household.
Back to table of contents9. Quality and methodology
More information on the methodology used to calculate these indices can be found in the related Methodology to calculate CPIH consistent inflation rates for UK household groups publication.
Limitations
While the calculation of inflation rates for household groups is straightforward analytically, a range of data constraints make their estimation challenging in practice. For instance, an analysis of household group specific inflation rates would ideally use price indices and expenditure weights specific to each household group. This would reflect the fact that different households will purchase goods and services from different outlets and therefore face different prices.
However, data are not available on specific price indices, and therefore we have had to use national price indices as an approximation. There are also a number of challenges that arise from the data sources that we have available for us to calculate the expenditure shares. These limitations do not impede the validity of the chosen methodology and its robustness. For more information, please see the related methodology publication.
Weights
Price indices are constructed using price and expenditure data. These expenditure shares can be calculated using different methodological approaches; the main two are democratic and plutocratic weighting. An overview of these approaches and their associated concepts can be found in Section 7.2 of the Consumer Price Indices Technical Manual (PDF, 674.44KB). We have also produced a methodology article Investigating the impact of different weighting methods on CPIH that compares the two approaches, alongside additional approaches to weighting a price index.
For the purpose of this article, plutocratic weighting is used, which is consistent with the method of weighting used in Consumer Prices Index including owner occupiers’ housing costs (CPIH). Plutocratic weighting is also the most common approach used internationally. Using plutocratic weighting allows for comparisons to be made between the household group inflation rates and the headline CPIH because both are produced within an established framework.
However, for analytical purposes we have also produced democratically-weighted inflation rates for each household group. Data are available to download alongside this release in the data download section.
Back to table of contents10. Annex A: Demographic characteristics
Table 6 shows the average distribution of students, renters and retired households across income and expenditure deciles for the years 2005 to 2017.
Table 6: Shares of student, retired and renting households by equivalised income and expenditure deciles, UK, average 2005 to 2017
| Expenditure Deciles | Income Deciles | |||||||||
| Decile | Subsidised renters | Full-time students | Retired households | Owner occupier households | Subsidised renters | Full-time students | Retired households | Owner occupier households | ||
|---|---|---|---|---|---|---|---|---|---|---|
| 1 | 0.40 | 0.11 | 0.13 | 0.01 | 0.16 | 0.40 | 0.13 | 0.08 | ||
| 2 | 0.21 | 0.12 | 0.13 | 0.06 | 0.19 | 0.11 | 0.15 | 0.07 | ||
| 3 | 0.12 | 0.09 | 0.13 | 0.09 | 0.19 | 0.09 | 0.17 | 0.07 | ||
| 4 | 0.09 | 0.10 | 0.11 | 0.10 | 0.15 | 0.08 | 0.15 | 0.08 | ||
| 5 | 0.06 | 0.12 | 0.11 | 0.11 | 0.11 | 0.07 | 0.11 | 0.10 | ||
| 6 | 0.04 | 0.08 | 0.09 | 0.12 | 0.09 | 0.06 | 0.09 | 0.10 | ||
| 7 | 0.03 | 0.11 | 0.08 | 0.12 | 0.05 | 0.05 | 0.07 | 0.11 | ||
| 8 | 0.02 | 0.09 | 0.08 | 0.12 | 0.03 | 0.05 | 0.05 | 0.12 | ||
| 9 | 0.02 | 0.08 | 0.07 | 0.13 | 0.02 | 0.05 | 0.04 | 0.13 | ||
| 10 | 0.01 | 0.09 | 0.07 | 0.13 | 0.01 | 0.05 | 0.03 | 0.13 | ||
| Notes: | ||||||||||
| 1. Subsidised renters are defined as those households who have a tenure type of local authority, housing association or rent free housing. | ||||||||||
| 2. Full-time students are defined as those households whose socio-economic group of the household reference person is defined as a full-time student. | ||||||||||
| 3. Owner-occupier households are defined as those households who have a tenure type of owned with mortgage, owned with rental purchase or owned outright. | ||||||||||
Download this table Table 6: Shares of student, retired and renting households by equivalised income and expenditure deciles, UK, average 2005 to 2017
.xls (28.7 kB)These figures should be treated with caution, particularly in the case of students, as the Living Costs and Food Survey (LCF) does not cover student halls of residence and the definition also excludes households where they live at home with other family members.
Back to table of contents