Table of contents
- Main points
- Introduction
- A brief description of owner occupiers’ housing costs
- Payments
- Net acquisitions
- Rental equivalence
- Comparing the different approaches of measuring owner occupiers’ housing costs
- Spotlight: Revisions to OOH(RE) expenditure weights
- Annex 1A: Payments methodology
- Annex 1B: Net acquisitions methodology
- Annex 1C: Rental equivalence methodology
- Annex 2: Weights analysis
1. Main points
Owner occupiers’ housing costs (OOH) in the UK under the rental equivalence approach have grown by 2.6% in Quarter 4 (Oct to Dec) 2016.
OOH according to the net acquisition approach have grown by 2.0% in Quarter 4 2016.
OOH compiled using the payments approach experienced growth of 0.3% in Quarter 4 2016.
2. Introduction
This series of articles aims to provide more information about the different approaches to measuring owner occupiers’ housing costs (OOH) to aid your understanding of the differences in concept and underlying methodology. It will be updated on a quarterly basis to evaluate the performance of the different measures over time, in prevailing economic conditions. It will also include a new “spotlight” section each quarter that focuses on a particular topic relevant to the measurement of OOH. This quarter, the spotlight will look at how the initial OOH weights estimates evolve against the final Blue Book expenditure totals. We invite you to submit ideas for future spotlights to cpi@ons.gov.uk.
We have published a number of articles that summarise the different approaches of measuring OOH. Table 1 provides a link to each paper and a summary of its contents. For more general information on CPIH, please see the CPIH Compendium.
Table 1: Summary of published articles on the different approaches of measuring OOH
| Publication | Description | |
|---|---|---|
| Understanding the different approaches of measuring owner occupiers’ housing costs (OOH): Quarter 2 (Apr to June) 2016 | This is the first article in the series and therefore it provides a more detailed description of each of the methods in the first section of the article (Different approaches of measuring owner occupiers’ housing costs). It also provides a more detailed commentary and analysis of the historical time series and the main drivers behind these long-term trends. Spotlight: the relationship between private rents and house prices |
|
| Understanding the different approaches of measuring owner occupiers’ housing costs (OOH): UK, Quarter 3 (July to Sept) 2016 | This article provides more of a template for future quarterly releases, with more focus on the latest quarterly movements in the different measures rather than the longer-term trends and methodology. Spotlight: owner occupiers' housing costs in the RPI |
|
| Understanding the different approaches of measuring owner occupiers’ housing costs (OOH): Weights analysis | This article was published as a stand-alone piece of analysis which aggregated the approaches with the Consumer Prices Index (CPI) to create a hybrid aggregate inflation measure which includes OOH as measured by each approach. The analysis will be updated on a quarterly basis in a dataset published alongside each quarterly article, and is summarised in Annex 2 of the quarterly article. |
You should note that the payments approach and net acquisitions are both experimental indices and therefore we would caution against any use other than for research purposes. More information on the methodology for each approach can also be found in Annex 1.
Back to table of contents3. A brief description of owner occupiers’ housing costs
The Consumer Prices Index including owner occupiers’ housing costs (CPIH) extends the Consumer Prices Index (CPI) to include a measure of owner occupiers’ housing costs (OOH), along with council tax. OOH are the costs of housing services associated with owning, maintaining and living in one’s own home. This is distinct from the cost of purchasing a house which is partly for the accumulation of wealth and partly for housing services.
There is not a single defined measure of OOH because they can be calculated differently depending on what the target is. In particular, should OOH be measured at the point of acquisition of the housing service, the point of use, or the point at which it is paid for? Each of these 3 approaches has its own specific methodological strengths and weaknesses, and is measured using different methods.
Back to table of contents4. Payments
What is the payments approach?
The payments approach aims to measure the payments related to the ownership of owner occupier housing. This means that all payments that households make as owner occupiers when consuming housing should be included, such as mortgage interest payments, transaction costs, and running costs. The payments approach is not our favoured method to measuring owner occupiers’ housing costs (OOH) in CPIH. This is because a consumer prices index aims to measure consumption, and interest payments represent the cost of borrowing money rather than the cost of consumption.
OOH(Payments) is an experimental series, and we therefore advise using it with some caution. We are continuing to work on identifying possible improvements to the current methodology and data sources. Any changes to the index will be highlighted in future releases and we will update the methodology section and historical series accordingly. For more information on the current methodology and data sources used to construct the OOH(Payments) approach, please see Annex 1A.
Payments approach
The payments approach is calculated using the below model:
Payments approach = Mortgage interest payments
+ Council Tax (Great Britain)
+ Northern Ireland rates
+ Dwelling Insurance
+ Ground rent
+ Stamp duty
+ Estate agent fees
+ Home-buyers survey
+ Major repairs and maintenance
+ House conveyancing
A correction has been made to OOH(Payments) since the previous release in December 2016. This was due to a small error when aggregating the sub-indices. The previous releases have all been updated to reflect this change.
Latest figure and long-term trend
Owner occupiers’ housing costs compiled using the payments approach - OOH(Payments) - experienced growth of 0.3% in Quarter 4 (Oct to Dec) 2016 compared with Quarter 4 2015 (Figure 1). This fell from Quarter 3 (July to Sept) 2016, but remains in line with historical trends.
Figure 2 presents the contributions to the quarterly growth rate of OOH(Payments) from the sub-indices used in its construction. Looking at contributions to growth is helpful to provide insight into the main drivers behind the year-on-year changes in the series. The fall from Quarter 3 to Quarter 4 was largely driven by an increase in the negative contribution from mortgage interest rates, which remain the largest negative contributor. The drop in the Bank of England base rate to 0.25% in August 2016 may have contributed towards this. Council Tax was the highest positive contributor, which is in line with recent quarters.
For a longer time series of contributions, please see the dataset presented alongside this release.
Figure 1: OOH (Payments) growth rate, quarter on corresponding quarter of previous year
UK, Quarter 1 (Jan to Mar) 2006 to Quarter 4 (Oct to Dec) 2016
Source: Office for National Statistics
Notes:
- Q1 refers to Quarter 1 (Jan to Mar); Q2 refers to Quarter 2 (Apr to June); Q3 refers to Quarter 3 (July to Sept); and Q4 refers to Quarter 4 (Oct to Dec).
Download this chart Figure 1: OOH (Payments) growth rate, quarter on corresponding quarter of previous year
Image .csv .xls
Figure 2: Contributions to percentage change in OOH(Payments) from component sub-indices, latest quarter on corresponding quarter of previous year
UK, Quarter 4 (Oct to Dec) 2016
Source: Office for National Statistics
Notes:
- Contributions may not sum due to rounding. Council Tax includes Council Tax in Great Britain and Northern Ireland rates. Other includes dwelling insurance, ground rent, estate agent fees, home-buyers survey and house conveyancing.
Download this chart Figure 2: Contributions to percentage change in OOH(Payments) from component sub-indices, latest quarter on corresponding quarter of previous year
Image .csv .xls5. Net acquisitions
What is the net acquisitions approach?
The net acquisitions approach – OOH(NA) – theoretically treats a home as the purchase of a good that is part asset (the land) and part consumable (the house). Asset prices should not be included in a consumer price index (which measures the cost of consumption), as an asset is not consumed in the same way that goods and services are. Therefore, the land component should be excluded from the index. OOH(NA) also includes costs associated with buying and maintaining a house; for example, self-builds and renovations, repairs and maintenance, transfer costs and dwelling insurance. The “net” principle in net acquisitions relates to the fact that only transactions that occur between the OOH sector and other sectors (for example, construction firms and private landlords) should be included.
In practice, while the measure presented here is the best measure of the net acquisitions approach that we can currently produce, the lack of available source data means that some components are not recorded fully. For instance, because of the lack of available data, the methodology used does not separate between the land and house price, and therefore there will be some measure of asset price included in the example. We therefore advise that OOH(NA) should be used and referred to with caution, and it is consequently not our favoured approach of measuring OOH in CPIH. As with the OOH(Payments) approach, it is an experimental index and we will continue to work on improving the methodology and data sources used in the index. For more information on the methodology used to construct OOH(NA), please see Annex 1B.
Net acquisitions approach
The net acquisitions approach is calculated using the below model:
Net acquisitions approach = Acquisition of new dwellings
+ Self builds and renovations
+ Existing dwellings new to the OOH sector
+ Services related to acquisition
+ Major repairs and maintenance
+ Insurance connected with the dwelling
+ Other services related to ownership of dwellings
Latest figure and long-term trend
The net acquisitions approach – OOH(NA) – grew by 2.0% in Quarter 4 (Oct to Dec) 2016 compared with Quarter 4 2015. This is lower than the 2.1% growth rate for Quarter 3 2016 but is still in line with historical trends (Figure 3).
Figure 4 shows the contributions to quarter on corresponding quarter of previous year growth rate for OOH(NA). While new dwellings continued to be the main driver of the increase in OOH(NA), its contributions to the growth rate have halved since Quarter 2. The input data for the new dwellings series is the HPI, which has seen a fall in the 12-month growth rate since July 2016 although there was a slight upward tick in December 2016. This demonstrates one of the main limitations of the current method of measuring net acquisitions, which is that movements in the asset price are not excluded from the index and can therefore influence some of the main trends shown in the data.
For a longer time series of contributions, please see the dataset presented alongside this release.
Figure 3: OOH(NA) growth rate, quarter on corresponding quarter of previous year
UK, Quarter 1 (Jan to Mar) 2006 to Quarter 4 (Oct to Dec) 2016
Source: Office for National Statistics
Download this chart Figure 3: OOH(NA) growth rate, quarter on corresponding quarter of previous year
Image .csv .xls
Figure 4: Contributions to percentage change in OOH(NA) from component sub-indices, latest quarter on corresponding quarter of previous year
UK, Quarter 4 (Oct to Dec) 2016
Source: Office for National Statistics
Notes:
- Contributions may not sum due to rounding. New dwellings includes acquisition of new dwellings and self builds and renovations.
Download this chart Figure 4: Contributions to percentage change in OOH(NA) from component sub-indices, latest quarter on corresponding quarter of previous year
Image .csv .xls6. Rental equivalence
What is the rental equivalence approach?
The final section presents the rental equivalence approach to measuring owner occupiers’ housing costs – OOH(RE), which targets the measurement of ongoing consumption of OOH services, rather than when OOH is acquired or when it is paid for. As a consumer price index, CPIH is a measure of the cost of consumption. Therefore the choice of method for measuring OOH should be based on the most statistically accurate method for measuring the cost of consumption in the UK. This means that asset prices should not be included, as an asset is not consumed in the way that goods and services are. The rental equivalence approach is our preferred method for measuring OOH costs in CPIH because the other approaches include either a measure of interest rates, or some measure of the capital element of housing, which make them unsuitable for a price index that measures the changing cost of consumption. The approach is also based on a higher quality data source than the other approaches presented in this article, allowing for a more reliable estimate of the measure. For more information about why the rental equivalence is used in CPIH, please see the CPIH compendium.
Latest figure and long-term trend
OOH(RE) grew by 2.6% in December 2016 compared with December 2015 (Figure 5). This continued the upward trend in 12-month growth rate of OOH(RE) seen since the end of 2015 and began to reach similar levels of growth seen prior to the economic downturn in 2008. On a quarterly basis for consistency with OOH(Payments) and OOH(NA), OOH(RE) grew by 2.6% in Quarter 4 (Oct to Dec) 2016 compared with the corresponding quarter of the previous year, up from 2.4% in Quarter 3 (July to Sept) 2016.
Figure 5: 12-month growth rate of OOH(RE)
UK, Jan 2006 to Dec 2016
Source: Office for National Statistics
Download this chart Figure 5: 12-month growth rate of OOH(RE)
Image .csv .xls7. Comparing the different approaches of measuring owner occupiers’ housing costs
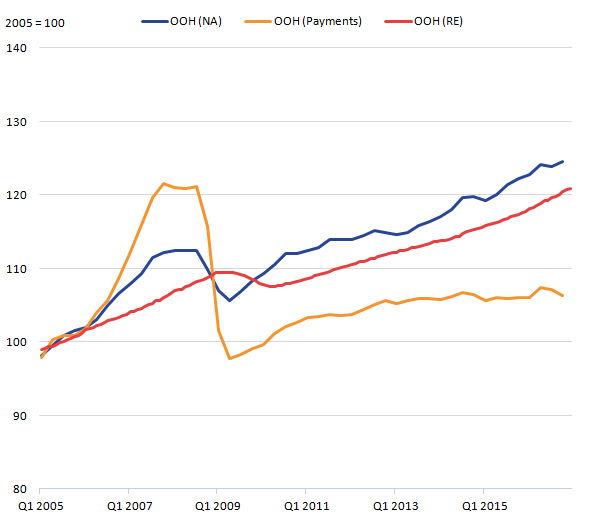
Although there is not a single defined measure of OOH, and each of the methods discussed prior measure different aspects of OOH, it is still useful to look at the 3 measures together to see how they differ over time.
The cumulative measure of all 3 approaches is presented in Figure 6. It suggests that since 2005, OOH(NA) has shown the strongest growth over the period. OOH(Payments) saw strong growth prior to the economic downturn due to the large positive contributions from the growth in mortgage interest payments (Figure 6). Of the 3 measures, it has also seen the largest fall since the economic downturn, again driven by the falling price of mortgage interest payments and has still not recovered its pre-downturn peak.
OOH(RE) appears at a lag to the OOH(NA) and OOH(Payments) approaches for the peak and trough before and after the economic downturn. This lag is because OOH(RE) is a “stock” measure of rents. This means that it captures price information for the entire stock of rental properties, which includes existing contracted properties and properties that are new to the market. Therefore, the flow of new rents based on recent developments in house prices will only gradually influence its development because the stock of existing dwellings is so much larger. This also means that the relative peaks and troughs of OOH(RE) will be subdued relative to OOH(NA) because the large stock of contracted rental properties is likely to mute the impact of volatile house prices.
Figure 6: OOH(RE), OOH(NA) and OOH(Payments) indices, 2005 = 100
UK, Quarter 1 (Jan to Mar) 2005 to Quarter 4 (Oct to Dec) 2016
Source: Office for National Statistics
Notes:
- Q1 refers to Quarter 1 (Jan to Mar); Q2 refers to Quarter 2 (Apr to June); Q3 refers to Quarter 3 (July to Sept); and Q4 refers to Quarter 4 (Oct to Dec).
Download this image Figure 6: OOH(RE), OOH(NA) and OOH(Payments) indices, 2005 = 100
.png (15.2 kB) .xls (34.8 kB)
The lag for OOH(RE) is not a disadvantage to using the rental equivalence approach in the calculation of the owner occupier’s housing costs component in CPIH. This is because the rental equivalence approach aims to measure the housing services that are consumed each period (consistent with the principles that underlie the construction of CPIH) and therefore does not need to follow the trend of house prices. If consideration is required of house prices, the HPI should be used instead.
Back to table of contents8. Spotlight: Revisions to OOH(RE) expenditure weights
To calculate CPIH, the owner occupiers’ housing costs (OOH) component measured using the rental equivalence approach is aggregated together with other items in the fixed basket of goods and services. Expenditure weights for the OOH component comes from the National Accounts household final consumption expenditure (HHFCE) data on imputed rentals. In turn, this is taken from the latest available national accounts dataset, which is published in Quarter 3, and is consistent with the most recent Blue Book release (typically published in June or September). Thus for a given year y, the expenditure shares are based on the Blue Book release y-1, which publishes data for year y-2.
National accounts estimates are open for revisions, and therefore there can be differences between the initial expenditure estimates used to calculate the OOH weights and revised expenditure totals for each year provided in subsequent Blue Book releases. This spotlight aims to provide an overview of the revisions that have affected the HHFCE imputed rentals series. This has also been summarised in the CPIH Compendium Section 2.4.2. For more information, please see the Changes to National Accounts: Imputed Rental (2016) article as well as Blue Book 2013: Improvements to Household Expenditure Estimates.
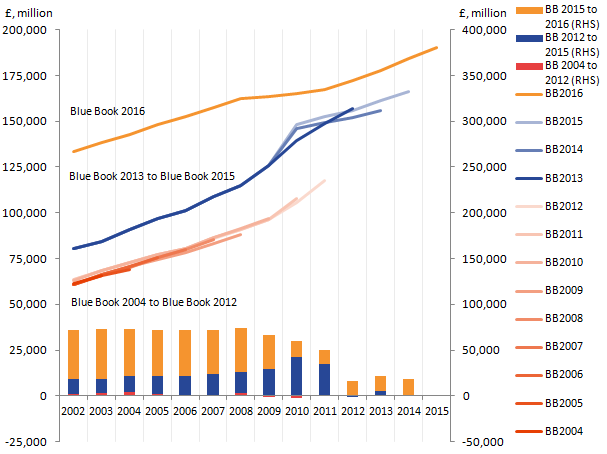
Figure 7 provides an overview of Blue Book consistent published expenditure for the HHFCE imputed rentals component. Each line represents a different vintage of Blue Book data and its respective historical series. For example, the line for Blue Book 2016 (BB2016) covers yearly expenditure from 2002 to 2015. The lines are grouped according to important changes to methodology and data sources. The red lines indicate vintages of Blue Book between 2004 and 2012. The blue lines are between 2013 and 2015, while the orange top line is consistent with Blue Book 2016.
The bars in Figure 7 represent the differences in total expenditure between the first publication of data for that year and the latest Blue Book vintage. Specifically, we divide the bars into changes from BB2004 to BB2012 (red), BB2012 to BB2015 (blue) and BB2015 to BB2016 (orange). These illustrate the different magnitudes of revisions implemented, in particular for Blue Book 2013 and Blue Book 2016.
Figure 7: Imputed rental expenditure figures for 2002 to 2015 as published in different Blue Book vintages (BB2004 to BB2016)
UK, 2002 to 2015
Source: Office for National Statistics
Download this image Figure 7: Imputed rental expenditure figures for 2002 to 2015 as published in different Blue Book vintages (BB2004 to BB2016)
.png (28.2 kB) .xls (30.2 kB)
Blue Book 2004 to Blue Book 2012
The revisions to imputed rentals expenditure leading up to Blue Book 2012 (red bars) have not been large relative to subsequent revisions, and have mainly been due to minor data changes. The largest difference over this period was for 2004, which was revised upwards by 6% between Blue Book 2005 and Blue Book 2012.
Blue Book 2013 to Blue Book 2015
The blue bars in Figure 7 show that there has been a noticeable level shift in total expenditure for imputed rentals from Blue Book 2012 to Blue Book 2013. This is due to expenditure revisions that occurred due to changes in the methodology. In particular, prior to the release of Blue Book 2013 there had been a large development project on the treatment of “Imputed rentals on owner-occupied dwellings” and “Maintenance and repairs of the dwelling”. The aim of these improvements was to ensure increased compliance with ESA95. The changes were implemented in Blue Book 2013 and involved changes to the treatment of imputed rentals on owner-occupied dwellings. The change ensured that maintenance and repairs expenditure was included within imputed rentals expenditure.
There were further changes to expenditure between Blue Book 2013 and Blue Book 2014. When CPIH was introduced in 2013, it showed a different evolution in prices for owner-occupiers’ compared to the implied deflator1 used in the National Accounts. An interim solution was implemented in Blue Book 2014, fixing the current price imputed rental series so that it grew in line with the slower-growing CPIH deflator. This improvement was implemented for 2010 onwards, as only this period was open for revision at the point of introduction. Although this improved the series for the most recent period, bringing it in line with CPIH, it also led to a discontinuity until an improved methodology was introduced in Blue Book 2016. This is what caused the jump between 2009 and 2010 in Figure 7 for the BB2014 and BB2015 series.
Blue Book 2016
The large expenditure shift between Blue Book 2015 and Blue Book 2016 in Figure 7 can be mostly attributed to data source changes and minor complementary methodological changes. Before Blue Book 2016, the existing estimates of imputed rental expenditures (current prices) were based on price information from the Living Costs and Food (LCF) survey and housing stock levels from the Department for Communities and Local Government (DCLG). A new approach was implemented in Blue Book 2016 that uses Valuation Office Agency (VOA) data together with similar data from the devolved administrations instead of the LCF price data2. The VOA and DCLG data are also forecast to the latest period (where data are not yet available) at the strata level using standard ONS forecasting principles. As well as data changes, some changes were made to the calculation of the imputed rental series due to more robust VOA data (see article and section 2.4 of the CPIH compendium).
When creating weights for OOH in CPIH for 2015, an early, non-systematised estimate of the imputed rentals expenditure consistent with this new Blue Book 2016 methodology was provided to Prices by National Accounts. This was instead of using the Blue Book 2014 data, as is standard practice. The offline expenditure allowed for the 2015 OOH weights within CPIH to be created on the new Blue Book 2016 basis. As improvements to the OOH index were being introduced in CPIH, the weights for imputed rentals were also revised backwards to ensure that there was no significant step change (see Changes to National Accounts: Imputed Rental article). This allowed Prices to mitigate the level shift in the underlying expenditure that was expected to occur between Blue Book 2015 and 2016 expenditure estimates and would have affected the OOH weights in CPIH.
In 2016, the weights for OOH were calculated based on a new set of preliminary estimates of the Blue Book 2016 consistent expenditure. These were different to the ones provided in 2015. However, these expenditure estimates were only used for the creation of 2016 weights and were not revised backwards to take on board this new set of expenditure estimates.
These preliminary estimates from National Accounts were slightly different to the final expenditure figures published in Blue Book 2016. As part of a package of improvements being introduced to CPIH in March 2017, it was decided that the OOH weights should be revised to ensure that the expenditure underlying the OOH weights within CPIH were consistent with Blue Book 2016 and remove the use of the offline estimates provided by National Accounts. It would also ensure that the price updating procedure applied to the historical expenditure figures for OOH are the same as the one that will be applied going forward. Overall, this ensures that the expenditure data is as up to date as possible and that the methods used are consistent. For the impact of using the finalised figures from Blue Book 2016 please see “Impact of inclusion of Council Tax and revised imputed rents on CPIH”.
Summary
Figure 8 summarises the timeline of these revisions. Orange circles indicate that there have been routine data revisions, blue circles indicate cases where there have been methodological changes, red circles highlight revisions to the CPIH weights and finally white circles denote other notable changes.
Figure 8: Timeline of revisions to HHFCE imputed rentals expenditure and OOH weights within CPIH

Source: Office for National Statistics
Download this image Figure 8: Timeline of revisions to HHFCE imputed rentals expenditure and OOH weights within CPIH
.PNG (36.3 kB)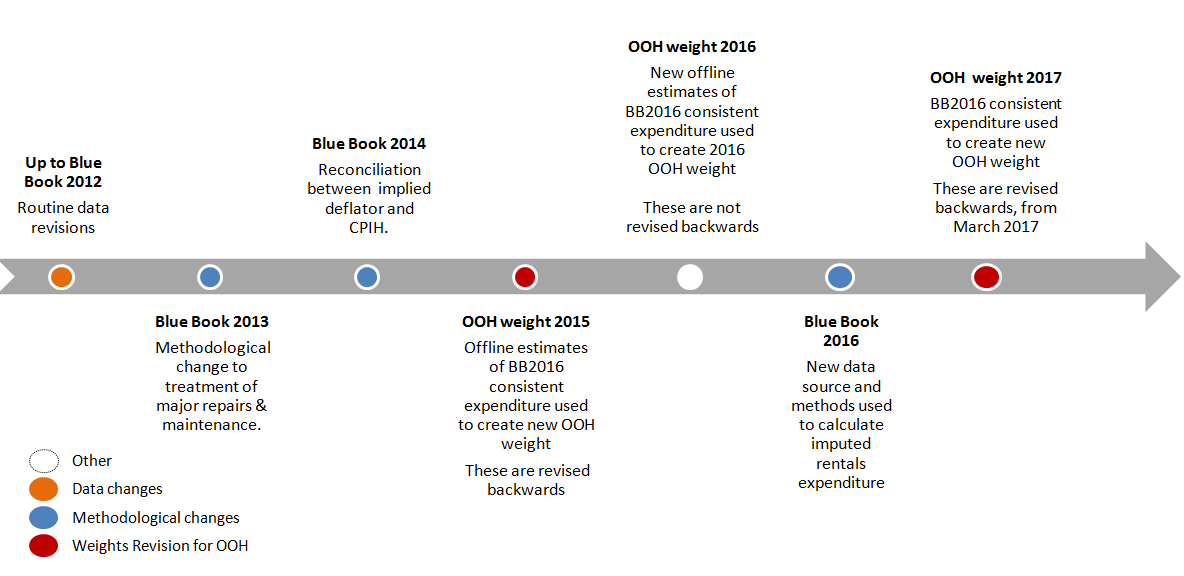
In summary, historical data revisions have not been large (as evidenced by the changes experienced up to Blue Book 2012); however, given that the methodology has been improved it is difficult to say what these data revisions will look like in the future. There are some further methodological changes planned for Blue Book 2017, although these are small compared to recent movement. There are also no further methodological changes planned for imputed rentals. As such, revisions to national accounts data should be smaller than those shown in the blue and orange bars in Figure 7. We therefore do not expect to revise the expenditure weights for OOH in the foreseeable future.
Notes for: Spotlight: Revisions to OOH(RE) expenditure weights
An implied deflator is a measure derived by dividing a current price expenditure series by the volume series. For more information on the implied deflator refer to this article.
These sources have much larger sample sizes than the LCF (for example, around 500,000 properties per year in the VOA data), and this also allows the use of an improved methodology using stratification. In contrast, the LCF data are based on around 400 households’ rental prices per quarter.
9. Annex 1A: Payments methodology
The payments approach is an experimental method for measuring owner occupiers’ housing costs (OOH) that attempts to capture what households pay out as owner occupiers when consuming housing (excluding capital repayments). This includes mortgage interest payments, transaction costs such as estate agency fees and legal fees, and running costs such as repairs and maintenance, ground rent and dwelling insurance.
Table A1 presents a full list of the OOH(Payments) component indices, as well as the source data for the prices and weights information used to construct the index. Most of the indices are drawn from the Retail Prices Index (RPI), which can be said to follow a payments approach to measuring OOH. One of the problems for the payments approach is to account for major repairs and maintenance, which are difficult to obtain prices for on a consistent basis. One method of dealing with this problem is the approach taken in the RPI, which includes a component for the depreciation of the property. The approach was characterised as estimating the amount of money households should put aside for necessary major repairs and updating in order to maintain the value of the property. The method used here, which is more in line with a true payments approach, is to include a major repairs and maintenance component, proxied by the regular repairs and maintenance series in the Consumer Prices Index (CPI) due to lack of alternative data source.
The other sub-index which does not come from the RPI is the Stamp Duty Index. This has been constructed for the OOH(NA) approach (see Annex 1B), and uses national accounts gross fixed capital formation (GFCF) and household final consumption expenditure (HHFCE) as the source data for the expenditure weights.
Table A1: Source data for OOH(Payments) sub-indices
| OOH(RE) Indices | Mortgage interest payments | Council Tax (GB) | Northern Ireland rates | Dwelling insurance | Ground rent | Stamp duty | Estate agent fees | Home-buyers survey | Major repairs and maintenance | House conveyancing |
| Source of Price Data | RPI | RPI | RPI | RPI | RPI | Stamp duty index | RPI | RPI | CPI | RPI |
| Source of Weights Data | RPI | RPI | RPI | RPI | RPI | HHFCE and GFCF | RPI | RPI | HHFCE | RPI |
| Source: Office for National Statistics | ||||||||||
| Notes: | ||||||||||
| 1 This table incorrectly originally listed this category as National Insurance rates. This was updated to read Northern Ireland rates on 15th November 2017 at 1pm. | ||||||||||
Download this table Table A1: Source data for OOH(Payments) sub-indices
.xls (19.5 kB)10. Annex 1B: Net acquisitions methodology
The net acquisitions approach is an experimental method for measuring owner occupiers’ housing costs (OOH) that are associated with the purchase and ongoing ownership of dwellings for own use. As the Harmonised Index of Consumer Prices (HICP) does not cover investment spending, the net acquisitions approach treats a home as the purchase of a good that is part asset (the land) and part consumable (the house) and excludes the land component from the index. OOH(NA) also includes costs associated with buying and maintaining a house; for example, self-builds and renovations, repairs and maintenance, transfer costs and dwelling insurance. The method we use to calculate OOH(NA) was proposed by Eurostat. It groups sub-indices measuring different aspects of OOH costs into 2 classes; those related to the acquisition of dwellings and those related to the ownership of dwellings.
The ideal method for excluding the land component in OOH(NA) is the net-net approach, whereby prices and weights both exclude the land component from the house purchase. However, as many member states (including the UK) are unable to implement the net-net approach due to a lack of available data, Eurostat requires all member states to use the net-gross (net weight, gross price) approach. This includes the use of the House Price Index (HPI), which does not separate between the land and house price, within the “Acquisition of New Dwellings” and “Existing Dwellings New to the OOH Sector” components. This means that the net acquisitions approach presented here will include some measure of asset price in the index.
In addition to the HPI, Table A2 presents the other sources of component price indices. With the exception of the Stamp Duty Index, all are drawn from some of our existing publications, including the Consumer Prices Index (CPI), Producer Price Index (PPI) and Retail Prices Index (RPI). More information about each of the sub-indices is available.
Table A2 also shows that the component expenditure weights used to compile OOH(NA) are derived from the national accounts gross fixed capital formation (GFCF) and household final consumption expenditure (HHFCE). The “net” principle in net acquisitions relates to the fact that only transactions that occur between the OOH sector and other sectors (for example, construction firms and private landlords) should be included. However, we cannot currently distinguish between sectors and therefore the weight for “Acquisition of New Dwellings” includes expenditure on all newly constructed dwellings and not those specifically destined for the OOH sector as per the methodology outlined by Eurostat. In addition, a weight for “Existing Dwellings New to the OOH Sector” does not exist; therefore, a 0 weight is currently applied. The “Other services related to ownership of dwellings” is based on the national accounts series 04.4.4 “Other services relating to the dwelling” and has zero expenditure recorded in Blue Book 2016. It therefore has a weight of 0 in the net acquisitions approach, and is excluded from the calculation.
Table A2: Source data for OOH(NA) sub-indices
| Acquisition of dwellings | Ownership of dwellings | |||||||
| OOH(NA) Indices | Acquisitions of New Dwellings (exc. Land) | Self Builds and Renovations | Existing Dwellings new to the OOH Sector | Services Related to Acquisition | Major Repairs and Maintenance | Insurance Connected with the Dwelling | Other services related to ownership of dwellings | |
| Source of Price Data | HPI | PPI and CPI | HPI | RPI and a Stamp Duty Index | CPI | RPI | No price index | |
| Source of Weights Data | GFCF | GFCF | No weight currently exists | HHFCE and GFCF | HHFCE | HHFCE | HHFCE | |
| Source: Office for National Statistics | ||||||||
Download this table Table A2: Source data for OOH(NA) sub-indices
.xls (18.9 kB)11. Annex 1C: Rental equivalence methodology
The rental equivalence approach is a method for measuring owner occupiers’ housing costs (OOH) at the point at which the services provided by OOH are consumed.
Rental equivalence uses the rent paid for an equivalent house as a proxy for the costs faced by an owner occupier. The rent charged by landlords covers not just the property but many of the other costs borne by owner occupiers, such as repairs and maintenance and transaction costs. Therefore, under the rental equivalence approach, these are not estimated separately, as to do so would introduce double-counting. The rental equivalence approach also does not capture changes in asset value; rather it measures the change in price of housing services provided.
The rental equivalence approach uses private rental data from the Valuation Office Agency (VOA) and supplemented with data from the devolved administrations. The data are stratified regionally as well as by property type (detached, semi-detached, terraced, or flat or maisonette) and whether the property is furnished or unfurnished. For each stratum, elementary aggregates are calculated which are then weighted together to create an aggregate index.
The private rental data are used in both the calculation of the owner occupiers’ housing costs component in CPIH (the rental equivalence approach) and the Index of Private Housing Rental Prices (IPHRP). The difference between the indices stems from the different weights used to combine the elementary aggregates. Strata weights for OOH(RE) are designed to represent the owner-occupied market and strata weights for IPHRP are designed to represent the private rental market. For example, looking at the range of housing available on the market, there would be a larger proportion of typical rental properties (for example, 1-bedroom flats), and the weights calculated would reflect this mix. By comparison, the owner occupied housing weights will reflect the larger proportion of more typically purchased properties (for example, 3-bedroom detached houses). Expenditure weights are calculated by multiplying dwelling stock counts for the owner occupied sector or private rental sector by average rental prices.
For a more detailed overview of the rental equivalence approach methodology, please see the CPIH compendium.
Back to table of contents12. Annex 2: Weights analysis
In January 2017, we published a stand-alone piece of analysis which aggregated the different approaches to measuring owner occupiers’ housing costs (OOH) with the Consumer Prices Index (CPI) to create a hybrid aggregate inflation measure which includes OOH as measured by each approach: Understanding the different approaches of measuring owner occupiers’ housing costs (OOH): Weights analysis.
From March 2017, CPIH was extended to include council tax. To ensure that CPIH is of the best possible quality, the full back series of CPIH has been revised to incorporate council tax and revised weights for OOH using the rental equivalence approach. This means that the CPIH series published in the dataset alongside this release will be different to that published in the January article.
There are also changes to the CPI-H(Payments) and CPI-H(NA) series. To ensure coherence with the new CPIH series, CPI-H(NA) has been revised to include council tax. OOH(NA) remains the same. OOH(Payments) includes council tax and therefore it is already coherent with CPIH. The January article identified two methods of calculating the payments approach. We have since identified a correction in the OOH(Payments1) approach which has more closely aligned the two methods. From now on we will therefore only include the OOH(Payments1) method in the quarterly spreadsheet, and rename these series OOH(Payments) and CPI-H(Payments).
For reference, the formula used to calculate the aggregate indices for CPI-H(Payments) and CPI-H(NA) is as follows:
Where:
p is the price level
q is the volume purchased
r is the reference period
t is the time period
i is the items in the CPI basket
CT is council tax
CPIH is as published.
Back to table of contents