Table of contents
- Main points
- Things you need to know about this release
- The North West was the fastest growing NUTS1 region in the UK in 2015
- NUTS3 – GVA performance at the local area level
- What was the average GVA in your local area?
- Belfast and Edinburgh were the top performing cities in 2015
- NUTS2 – used to allocate EU structural funding
- Links to related statistics
- What’s changed in this release?
- Future work plans
- Quality and methodology
1. Main points
In 2015 gross value added (GVA) per head of population increased in all NUTS1 regions. The highest annual growth was in the North West at 3.0% and the lowest annual growth was in the East Midlands at 1.0%.
At the regional level, in 2015 London had the highest GVA per head at £43,629 while Wales had the lowest at £18,002.
The North West was also the fastest growing NUTS1 region in the UK in 2015 when looking at annual growth in total GVA (in millions of pounds). Total GVA in the North West grew by 3.6% in 2015. East Midlands had the lowest rate of growth in total GVA at 1.8% in 2015.
Looking at the growth between 2014 and 2015 in broad industry groups, information and communication was the strongest growing industry in the UK (6.9%). The North East (14.9%), South East (10.8%) and North West (8.9%) all performed strongly in this industry.
The capital cities of Belfast (4.7%) and Edinburgh (4.5%) were showing the strongest annual growth in GVA per head in 2015, outstripping Cardiff (2.6%) and London (1.6%).
GVA per head increased in 151 of the 173 NUTS3 local areas between 2014 and 2015. The largest percentage increase was in Solihull (7.9%) and the largest decrease was in Central Bedfordshire (negative 4.4%).
Back to table of contents2. Things you need to know about this release
Gross value added (GVA) is a measure of the increase in the value of the economy due to the production of goods and services. It is measured at current basic prices, which include the effect of inflation, excluding taxes (less subsidies) on products (for example, Value Added Tax). GVA plus taxes (less subsidies) on products is equivalent to gross domestic product (GDP).
These regional estimates of gross value added are measured using the income approach, sometimes denoted by GVA(I). This involves adding up the income generated by UK resident individuals or corporations in the production of goods and services. It is calculated gross of deductions for consumption of fixed capital, which is the amount of fixed assets used up in the process of production in any period. We also publish experimental estimates of GVA measured using the production approach, with the effect of inflation removed.
These estimates are consistent with the National Accounts Blue Book 2016. National aggregates for the components of GVA are allocated to regions using the most appropriate regional indicator available.
GVA estimates in this bulletin are available at three geographical levels, in accordance with the NUTS classification which came into force on 1 January 2015. The Nomenclature of Units for Territorial Statistics (NUTS) provides a single uniform breakdown for the production of regional statistics for the EU:
NUTS1: Wales, Scotland, Northern Ireland and the nine English regions
NUTS2: 40 sub-regions – mainly groups of counties and unitary authorities
NUTS3: 173 local areas – principally individual counties and unitary authorities the term Extra-Regio is applied to economic activity that cannot be assigned to any specific region within a country
Further information can be found in chapter 1 of the regional accounts methodology guide.
The GVA(I) estimates presented here are on a workplace basis (allocated to the location where the economic activity takes place). GVA(I) per head of population is a useful way of comparing regions of different size and is an important indicator for both domestic and European policy purposes. Total GVA(I) estimates in millions of pounds (£m) are divided by the total resident population of a region (including the economically inactive) to give GVA per head in pounds (£). While GVA(I) per head can be a useful way of comparing regions of different size, comparisons can be affected by commuting flows into or out of the region.
These regional GVA estimates update those published in December 2015 for the period 1997 to 2014. Additionally, provisional estimates for the year 2015 are released for the first time. These figures are provisional as national estimates have not been through Supply and Use balancing at the time of this publication.
Back to table of contents3. The North West was the fastest growing NUTS1 region in the UK in 2015
In 2015 gross value added (GVA) per head for the UK as a whole was £25,601. With Extra-Regio and the statistical discrepancy excluded, the UK per head figure was £25,351. Of the four UK countries, only England had a higher GVA per head value at £26,159. Wales had the lowest GVA per head at £18,002, but its growth between 2014 and 2015 was the highest at 2.8%. The lowest growth was in Northern Ireland at 1.4%.
Table 1: NUTS1 regional GVA1,2, 20153
| NUTS1 regions | GVA per head (£)2 | GVA per head growth on 2014 (%) | GVA per head index (UK=100) | Total GVA (£m)2 | Total GVA growth on 2014 (%) | Share of UK total GVA (%)4 | |||
| United Kingdom5 | 25,351 | 2.1 | 100.0 | 1,666,342 | 2.6 | 100.0 | |||
| North East | 18,927 | 2.8 | 74.7 | 49,677 | 3.0 | 3.0 | |||
| North West | 21,867 | 3.0 | 86.3 | 156,872 | 3.6 | 9.4 | |||
| Yorkshire and The Humber | 20,351 | 2.4 | 80.3 | 109,704 | 3.0 | 6.6 | |||
| East Midlands | 20,929 | 1.0 | 82.6 | 97,887 | 1.8 | 5.9 | |||
| West Midlands | 20,826 | 1.6 | 82.1 | 119,769 | 2.2 | 7.2 | |||
| East of England | 23,970 | 1.7 | 94.6 | 145,651 | 2.7 | 8.7 | |||
| London | 43,629 | 1.6 | 172.1 | 378,424 | 3.2 | 22.7 | |||
| South East | 27,847 | 2.3 | 109.8 | 249,174 | 3.2 | 14.9 | |||
| South West | 23,031 | 2.0 | 90.8 | 126,007 | 2.9 | 7.6 | |||
| England | 26,159 | 2.1 | 103.2 | 1,433,164 | 3.0 | 86.0 | |||
| Wales | 18,002 | 2.8 | 71.0 | 55,788 | 3.0 | 3.3 | |||
| Scotland | 23,685 | 1.8 | 93.4 | 127,260 | 2.3 | 7.6 | |||
| Northern Ireland | 18,584 | 1.4 | 73.3 | 34,410 | 2.0 | 2.1 | |||
| Extra-Regio | n/a | n/a | n/a | 16,242 | -19.3 | 1.0 | |||
| Source: Office for National Statistics | |||||||||
| Notes: | |||||||||
| 1. GVA at current basic prices on workplace basis. | |||||||||
| 2. Figures may not sum due to rounding in totals; per head (£) figures are rounded to the nearest pound. | |||||||||
| 3. 2015 estimates are provisional. | |||||||||
| 4. Shares have been calculated as the regions' proportions of the UK total excluding statistical discrepancy. | |||||||||
| 5. Per head and per head index figures exclude the statistical discrepancy and Extra-Regio: the off-shore contribution to GVA that cannot be assigned to any region. These are included in the total GVA figure. | |||||||||
Download this table Table 1: NUTS1 regional GVA^1,2^, 2015^3^
.xls (29.7 kB)In 2015 GVA per head of population increased in all NUTS1 regions. The largest percentage increase was in the North West at 3.0%, just ahead of the North East and Wales, both at 2.8%. The East Midlands had the smallest percentage increase at 1.0%, followed by Northern Ireland at 1.4%.
A similar pattern can be seen in the employment rates (for those aged 16 to 64) for 2015, which rose in all regions except Yorkshire and The Humber and the East Midlands. The North West saw the largest increase, from 70.9% to 73.2%, and the second largest was in Wales, from 69.2% to 71.4%. Unemployment decreased strongly in many UK regions in 2015; it fell by more than a percentage point in the North West, Wales and the East of England. By contrast, there were very small increases in the unemployment rate in Scotland, Northern Ireland, Yorkshire and The Humber and the North East.
The economic downturn experienced in the UK in late 2008 and 2009 affected all NUTS1 regions. Looking at growth in UK GVA per head (excluding Extra-Regio and statistical discrepancy), the UK economy grew by 2.1% in 2015. This was slower than in 2014, when the UK grew by 4.2%, the fastest rate since the UK returned to growth following the 2009 economic downturn.
Figure 1 shows the annual rate of growth in regional GVA(I) per head for each NUTS1 region across the period 1997 to 2015.
Click on the region names above the chart to toggle the lines on and off.
Figure 1: NUTS1 regions GVA per head growth, 1998 to 2015
Source: Office for National Statistics
Download this chart Figure 1: NUTS1 regions GVA per head growth, 1998 to 2015
Image .csv .xlsWhile each region saw a decline in rate of growth in 2009, their paths of recovery from 2009 to 2015 have varied. The rate of growth in Scotland reached its lowest point in 2010, with a decrease of 2.2%. In 2010 all other regions showed higher annual growth than they had in the previous year. Since the economic downturn in 2009 the highest annual growth seen in any region was 6.2% in London in 2014.
In addition to GVA per head, the North West was also the fastest growing NUTS1 region in the UK in 2015 when looking at total GVA (in millions of pounds). Total GVA in the North West grew by 3.6% from £151,385 in 2014 to £156,872 in 2015. East Midlands had the lowest rate of growth in total GVA at 1.8% in 2015.
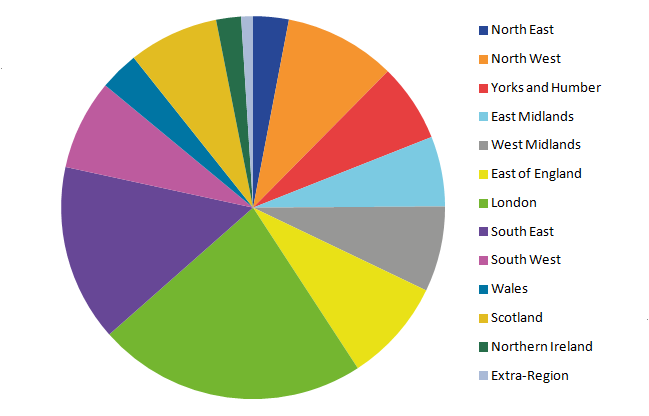
Figure 2 shows each region’s share of the UK total including Extra-Regio. London had the highest share of UK GVA in 2015, with 22.7%, followed by the South East with 14.9%. The lowest share after Extra-Regio (1.0%) was Northern Ireland, with 2.1%, followed by the North East with 3.0%.
Figure 2: Regional share of total GVA, 2015
Source: Office for National Statistics
Notes:
- Units: %
Download this image Figure 2: Regional share of total GVA, 2015
.png (21.9 kB) .xls (16.9 kB)
Although most regions’ shares of total GVA haven’t changed greatly since the start of the time series in 1997, London has increased its share by 4.0 percentage points. The South East has also increased, by 0.1 percentage points. All other regions decreased, with the West Midlands and Extra-Regio decreasing the most, by 0.8 percentage points.
Regional GVA estimates provide a comprehensive industry breakdown, with activities grouped into 20 sections (with a further 13 manufacturing sub-sections) in accordance with the Standard Industrial Classification 2007 (SIC 2007).
It should be noted that all 2015 industry data in this release are provisional as they are based on national data that have not been through the Supply and Use balancing process. The provisional industry estimates for regions compiled using the income approach will not sum to those published in the UK National Accounts, compiled using the output approach. The difference is shown in the statistical discrepancy that can be found in the reference tables released with this bulletin.
The North West was the fastest growing NUTS1 region in 2015. Looking at the industrial composition of the North West for broad industry groupings, information and communication (9.0%), distribution, transport, accommodation and food (5.5%) and real estate activities (4.9%) all performed strongly between 2014 and 2015.
Figure 3 shows the industrial composition of total GVA for each NUTS1 region in 2015 for broad industry groupings. Looking at the growth between 2014 and 2015:
- information and communication was the strongest growing industry in the UK (6.9%); the North East (14.9%), South East (10.8%) and North West (9.0%) all performed strongly in this industry
- agriculture, mining and the utilities (electricity, gas and water) decreased in 2015 in all regions except Wales (5.1%) and the East Midlands (0.6%)
- the construction industry grew in most regions in 2015, with the exception of London (negative 3.8%), South East (negative 1.5%) and Wales (negative 1.2%)
- the public service industries also showed growth across most of the NUTS1 regions, with the highest in the South East (8.4%); a decrease was seen in the West Midlands (negative 0.4%) and Extra-Regio (negative 8.6%); Extra-Regio for the public service industries relates to UK forces and embassies staff stationed overseas
Figure 3: Industrial variation in total GVA in NUTS1 regions, 2015
Source: Office for National Statistics
Download this chart Figure 3: Industrial variation in total GVA in NUTS1 regions, 2015
Image .csv .xls4. NUTS3 – GVA performance at the local area level
The ten NUTS3 local areas with the highest gross value added (GVA) per head and the ten with the lowest GVA per head in 2015 are displayed in table 2.
Table 2: NUTS3 top 10 and bottom 10 local areas1 by GVA2 per head, 20153
| NUTS3 local areas | GVA per head (£) | GVA per head growth on 2014 (%) | GVA per head index (UK=100) | Total GVA (£m) | Total GVA growth on 2014 (%) | |||
| United Kingdom4 | 25,351 | 2.1 | 100.0 | 1,666,342 | 2.6 | |||
| Top ten GVA per head | ||||||||
| Camden and City of London | 292,855 | -0.8 | 1,155.2 | 73,161 | 2.0 | |||
| Westminster | 221,103 | -2.1 | 872.2 | 53,573 | 1.7 | |||
| Tower Hamlets | 98,134 | 3.2 | 387.1 | 28,973 | 7.3 | |||
| Kensington & Chelsea and Hammersmith & Fulham | 62,431 | 0.9 | 246.3 | 21,047 | 1.6 | |||
| Haringey and Islington | 45,611 | 1.4 | 179.9 | 22,831 | 3.9 | |||
| Milton Keynes | 41,581 | 3.1 | 164.0 | 10,884 | 4.1 | |||
| Berkshire | 40,248 | 3.6 | 158.8 | 35,845 | 4.2 | |||
| Hounslow and Richmond upon Thames | 37,087 | 5.7 | 146.3 | 17,190 | 6.7 | |||
| City of Edinburgh | 36,963 | 4.5 | 145.8 | 18,437 | 5.8 | |||
| Aberdeen City and Aberdeenshire | 36,726 | -2.5 | 144.9 | 18,081 | -1.9 | |||
| Bottom ten GVA per head | ||||||||
| Central Valleys | 15,429 | 1.7 | 60.9 | 4,578 | 2.0 | |||
| Blackpool | 15,372 | 1.8 | 60.6 | 2,146 | 1.2 | |||
| East Ayrshire and North Ayrshire mainland | 15,200 | 4.7 | 60.0 | 3,834 | 4.6 | |||
| East Lothian and Midlothian | 15,128 | 2.7 | 59.7 | 2,881 | 3.9 | |||
| Sefton | 14,769 | 3.2 | 58.3 | 4,042 | 3.3 | |||
| Outer Belfast | 14,592 | -0.7 | 57.6 | 5,823 | 0.0 | |||
| Wirral | 14,523 | 5.3 | 57.3 | 4,661 | 5.3 | |||
| North of Northern Ireland | 13,919 | -0.3 | 54.9 | 4,073 | 0.1 | |||
| Gwent Valleys | 13,681 | 2.8 | 54.0 | 4,673 | 2.9 | |||
| Isle of Anglesey | 13,411 | 1.3 | 52.9 | 938 | 1.0 | |||
| Source: Office for National Statistics | ||||||||
| Notes: | ||||||||
| 1. Data for all NUTS3 local areas are included in reference tables 1 to 5. | ||||||||
| 2. GVA at current basic prices on workplace basis. | ||||||||
| 3. 2015 estimates are provisional. | ||||||||
| 4. Per head and per head index figures exclude the statistical discrepancy and Extra-Regio: the off-shore contribution to GVA that cannot be assigned to any region. These are included in the total GVA figure. | ||||||||
Download this table Table 2: NUTS3 top 10 and bottom 10 local areas^1^ by GVA^2^ per head, 2015^3^
.xls (32.3 kB)All of the top ten NUTS3 local areas were in London, South East or Scotland NUTS1 regions, the top five of which were in London. The bottom ten local areas were all within Wales, Scotland, Northern Ireland or the North West of England.
Please note that while GVA per head can be a useful way of comparing regions of different size, it is not such a good indicator for those areas with high net in- or out-commuting. This is because it compares a workplace measure of economic output (GVA), which includes the contribution of in-commuters, with a residence-based denominator (population). For such areas it is advisable to refer to ONS sub-regional productivity data for a direct measure of economic performance.
GVA per head increased in 151 of the 173 NUTS3 local areas between 2014 and 2015. The largest percentage increases were in:
- Solihull (West Midlands region), 7.9%
- Mid Lancashire (North West region), 5.9%
- Darlington (North East region), 5.7%
- Hounslow and Richmond upon Thames (London), 5.7%
GVA per head decreased in 22 local areas. The largest decreases were in:
- Central Bedfordshire (East of England region), negative 4.4%
- West Northamptonshire (East Midlands region), negative 2.8%
- Aberdeen City and Aberdeenshire (Scotland), negative 2.5%
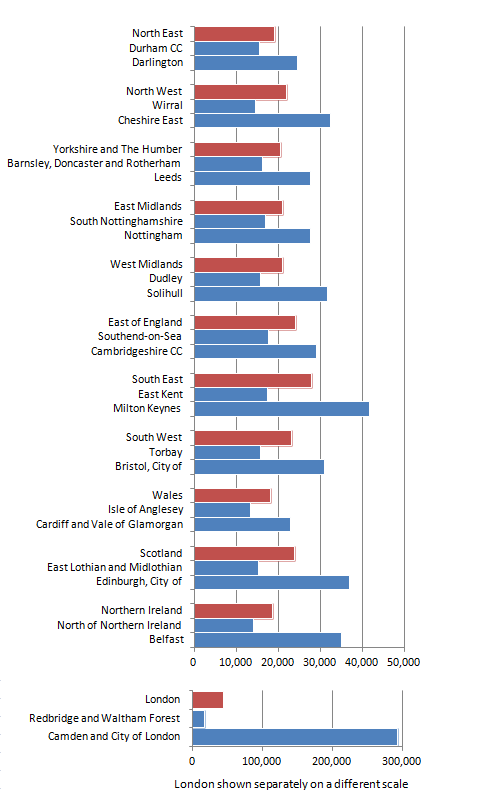
Within a NUTS1 region there can be considerable variation in its local areas. Figure 4 shows the highest and lowest local areas’ GVA per head within each region.
Figure 4: NUTS3 GVA per head variation within NUTS1 regions, 2015
£per head
Source: Office for National Statistics
Download this image Figure 4: NUTS3 GVA per head variation within NUTS1 regions, 2015
.png (21.7 kB) .xlsx (43.7 kB)
The region with the most variation by far is London, where the difference between Redbridge and Waltham Forest and Camden and the City of London is £275,802 per head. The North East and Wales have the least amount of variation, with the differences between the highest and lowest local areas at £9,110 and £9,372 respectively.
Outside of London, Belfast was the local area furthest away from its NUTS1 figure, with £16,439 per head more than Northern Ireland as a whole. Wales and the South West were the most evenly balanced, with the lowest and highest local areas being roughly the same distance from the NUTS1 figure.
Back to table of contents5. What was the average GVA in your local area?
Use this interactive map to see how gross value added (GVA) per head varied across NUTS3 local areas in the years 1997 to 2015.
Embed code
6. Belfast and Edinburgh were the top performing cities in 2015
Figure 5 shows annual growth in total GVA and GVA per head between 2014 and 2015 for a selection of the largest cities in the UK. Most of these cities are single NUTS3 local areas (with Newcastle upon Tyne represented by Tyneside NUTS3 area), but we have included Greater Manchester (NUTS2) and London (NUTS1) for comparison purposes. The difference in growth between total GVA and GVA per head is caused by changes in the resident population of the city. We can see that London and Bristol are the cities affected most by population change, with a difference of 1.6% between their total GVA and GVA per head growths.
Figure 5: Growth in total GVA and GVA per head in UK cities, 2015
Source: Office for National Statistics
Download this chart Figure 5: Growth in total GVA and GVA per head in UK cities, 2015
Image .csv .xlsThe capital cities of Belfast (5.4% (total GVA) and 4.7% (GVA per head)) and Edinburgh (5.8% and 4.5%) are showing the strongest growth in 2015, outstripping Cardiff (3.2% and 2.6%) and London (3.2% and 1.6%) along with all the other major cities shown.
Over the five year period since 2010 London has shown the strongest growth in both total GVA (27.1%) and GVA per head (18.1%). In total GVA the next best growth among the cities shown was seen in Birmingham (19.2%) and Newcastle upon Tyne (18.5%), whereas in GVA per head the next best growth was in Newcastle upon Tyne (15.6%) and Belfast (13.9%).
Back to table of contents7. NUTS2 – used to allocate EU structural funding
Table 3 shows the top and bottom 5 NUTS2 sub-regions, ranked by gross value added (GVA) per head in 2015.
Table 3: NUTS2 top 5 and bottom 5 sub-regions1 by GVA2 per head, 20153
| NUTS2 sub-regions | GVA per head (£) | GVA per head growth on 2014 (%) | GVA per head index (UK=100) | Total GVA (£m) | Total GVA growth on 2014 (%) | ||
| United Kingdom4 | 25,351 | 2.1 | 100.0 | 1,666,342 | 2.6 | ||
| Top five GVA per head | |||||||
| Inner London - West | 137,513 | 0.0 | 542.4 | 157,285 | 1.8 | ||
| Inner London - East | 41,518 | 2.5 | 163.8 | 96,666 | 5.0 | ||
| North Eastern Scotland | 36,726 | -2.5 | 144.9 | 18,081 | -1.9 | ||
| Berkshire, Buckinghamshire and Oxfordshire | 35,550 | 3.3 | 140.2 | 83,848 | 4.1 | ||
| Cheshire | 30,099 | 3.0 | 118.7 | 27,601 | 3.5 | ||
| Bottom five GVA per head | |||||||
| Outer London - East and North East | 18,487 | 3.1 | 72.9 | 34,467 | 4.5 | ||
| Cornwall and Isles of Scilly | 17,964 | 3.3 | 70.9 | 9,911 | 4.1 | ||
| South Yorkshire | 17,688 | 2.4 | 69.8 | 24,315 | 3.0 | ||
| Tees Valley and Durham | 17,419 | 1.6 | 68.7 | 20,680 | 1.9 | ||
| West Wales and The Valleys | 16,059 | 2.5 | 63.3 | 31,327 | 2.7 | ||
| Source: Office for National Statistics | |||||||
| Notes: | |||||||
| 1. Data for all NUTS2 sub-regions are included in reference tables 1 to 5. | |||||||
| 2. GVA at current basic prices on workplace basis. | |||||||
| 3. 2015 estimates are provisional. | |||||||
| 4. Per head and per head index figures exclude the statistical discrepancy and Extra-Regio: the off-shore contribution to GVA that cannot be assigned to any region. These are included in the total GVA figure. | |||||||
Download this table Table 3: NUTS2 top 5 and bottom 5 sub-regions^1^ by GVA^2^ per head, 2015^3^
.xls (30.7 kB)In 2015 GVA per head increased in 38 of the 40 NUTS2 sub-regions. The largest percentage increases were in:
- Northumberland and Tyne and Wear, 3.6%
- Lancashire, 3.5%
- Berkshire, Buckinghamshire and Oxfordshire, 3.3%
- Cornwall and Isles of Scilly, 3.3%
GVA per head decreased in one region, North Eastern Scotland, with a decrease of 2.5%. In Inner London – West, GVA per head did not change from its value in 2014.
This NUTS2 sub-regional breakdown has an important function in being a legal requirement of the European Union (EU), which is used to inform the EU’s Cohesion Policy. This policy is aimed at “reducing disparities between the various regions” (Eurostat). The current funding period for this policy covers the years 2014 to 2020 and money is allocated to regions based on their percentage of the EU’s average gross domestic product (GDP) per head.
Sub-regions with a GDP per head of less than 75% of the EU average are eligible for funding from the European Regional Development Fund (ERDF), the European Social Fund (ESF) and the Cohesion Fund. In the latest funding round, covering 2014 to 2020, two UK regions were considered eligible: Cornwall and Isles of Scilly and West Wales and The Valleys.
Figure 6 compares the GVA per head for the two regions eligible for funding as per head indices for the period 1997 to 2015. GVA per head indices show how a region compares with the UK average (where the UK is equal to 100).
Figure 6: Cornwall and Isles of Scilly and West Wales and The Valleys GVA per head index, 1997 to 2015
Source: Office for National Statistics
Download this chart Figure 6: Cornwall and Isles of Scilly and West Wales and The Valleys GVA per head index, 1997 to 2015
Image .csv .xlsDespite being eligible for full EU funding in the 2007 to 2013 and 2014 to 2020 funding periods, both Cornwall and Isles of Scilly and West Wales and The Valleys have remained below the UK average in all years across the time series, with West Wales and The Valleys having the lowest GVA per head figure of all NUTS2 sub-regions in each of the years 1997 to 2015. Neither region has improved its performance across the time series, with both sub-regions moving relatively further away from the UK average since the start of the time period.
However, in terms of growth in GVA per head between 2014 and 2015, both West Wales and The Valleys and Cornwall and Isles of Scilly have performed better than the UK average. Cornwall and Isles of Scilly grew by 3.3% and West Wales and The Valleys grew by 2.5% compared with a UK average of 2.1%. This meant that Cornwall and Isles of Scilly is no longer in the bottom 2 regions, and has moved to fourth from the bottom, as can be seen in table 3.
Those sub-regions with a GDP per head between 75% and 90% of the EU average are eligible for transition funding, meaning they receive a smaller amount of funding. In the 2014 to 2020 funding period 11 UK regions were eligible for transition funding: Cumbria; Devon; East Yorkshire and Northern Lincolnshire; Highlands and Islands; Lancashire; Lincolnshire; Merseyside; Northern Ireland; Shropshire and Staffordshire; South Yorkshire; Tees Valley and Durham.
Back to table of contents9. What’s changed in this release?
The UK National Accounts have included for the first time in Blue Book 2016 the Crossrail business rates supplement (BRS). This is a tax on production which has been levied from April 2010. The tax is collected on behalf of the Greater London Authority (GLA) by the 32 London boroughs and the City of London Corporation. A regional indicator has been compiled using estimates published by the GLA of estimates of income from Crossrail BRS by London borough.
In keeping with the UK National Accounts commitment to meeting the European Commission definition of Gross National Income and the new European System of Accounts (ESA2010), there have been changes made to the UK National Accounts measure of gross value added (GVA). These impact upon the regional GVA estimates in the form of different national totals for the various components of income, even where no explicit changes to the regional allocation have been needed. Of these, a change to the treatment of Owner-Occupied Imputed Rental has resulted in the greatest impact on the national figures.
A change has been made to show subsidies on production separately in this release. In previous releases, subsidies have been included in mixed income and profits, and allocated (that is, subtracted) from the profits of each of the sectors (households, public non-financial corporations and private non-financial corporations). In this release, each of the separate subsidies has been regionalised independently, in the same way that taxes on production are processed. The subsidies component can now be found in reference table 15.
We have carried out a review of the way we measure the manufacture of coke and refined petroleum industry (SIC Sub-section CD) in regional GVA and have made some changes to improve consistency with the reality of the industry. A discrepancy was found between the conversion to SIC 2007 in GVA(I) compared with the production measure (GVA(P)), with the GVA(P) conversion found to be the better of the two. Thus, the GVA(I) series has been re-converted, bringing the 2 measures closer together. Alongside this, extensive industry research has been carried out to influence adjustments made to the raw data to reflect reality as accurately as possible.
In last year’s release, there was a change in the average house prices used to calculate the regional allocation of imputed rental of owner-occupied dwellings. The new data used median house prices from ONS instead of mean house prices, which reduces the impact of the most expensive houses and improves the consistency of estimates over time. The exception at the time was Northern Ireland: mean house prices were used for Northern Ireland as median house prices were unavailable. We have now been able to source median house price data for Northern Ireland consistent with the rest of the UK regions and countries. This has had an impact on GVA estimates for Real Estate Activities (SIC Section L) in Northern Ireland.
Back to table of contents10. Future work plans
Historically we have produced regional gross value added (GVA) by both the income approach (as National Statistics) and the production approach (as experimental statistics). We plan to take the strengths from both measures and use them to produce a new balanced measure of regional GVA. This will give users a single measure of economic activity within a region. A first set of results will be published for consultation in spring to summer 2017. Depending on the results of that consultation, we hope to publish all 3 measures alongside each other in December 2017, with the balanced data being the lead series.
We have published GVA(I) and gross disposable household income (GDHI) for local authorities in England in 2016. By the end of March 2017, we plan to extend the GVA(I) data to cover the whole of the UK, and the GDHI data by the end of July 2017. By September 2017 we plan to include “real” measures of GVA. Further work in 2017 and 2018 will look into the viability of disaggregating these local authority data further down into output areas for GDHI and workplace zones for GVA.
We have recently published a feasibility study on regional household final consumption expenditure (HFCE). Producing this at a regional level would complete the suite of household accounts by measuring spending on consumer goods and services. It will also pave the way for a regional savings ratio. Work will be carried out in 2017 to further examine data sources and concepts, with an aim to produce regional HFCE in 2018.
In the next regional GVA(I) release we plan to take on an improved method for allocating owner occupied imputed rental (OOIR). In Blue Book 2016 the regional allocation of owner occupied dwelling was allocated using a data source available regionally, however the privately rented dwellings continued to use a data source which was only available nationally. For Blue Book 2017 national accounts intend to move to a regional-based data source for privately rented dwellings as well. We intend to implement these regional sources following Blue Book 2017.
Further details about our development programme are available in the article Supporting devolution: developments in regional and local statistics.
Back to table of contents11. Quality and methodology
Quality
The regional GVA(I) Quality and Methodology Information document contains important information on:
- the strengths and limitations of the data
- the quality of the output: including the accuracy of the data, how it compares with related data
- uses and users
- how the output was created
Figures for 2015 are provisional as national estimates have not been through Supply and Use balancing at the time of this publication. Regional industry estimates for the components of income in 2015 have been calculated by applying growth in GDP(O) industry figures and then constraining these to sum to the income component totals. The figures used in this process are consistent with those published in the National Accounts Blue Book 2016.
The statistical discrepancy is the difference between the sum of the national income components and the definitive national estimate of GVA.
Methodology
Various guidance and methodology documents relating to regional GVA(I) are available on our website. The regional accounts methodology guide provides an overview of the methodology used to compile regional accounts outputs. Quality and methodology information (QMI) reports are available, covering the relevance, accuracy, timeliness, accessibility and coherence of each of the regional accounts outputs. Other historical guidance, methodology and update documents are also available.
Revisions
Revisions to NUTS1, NUTS2 and NUTS3 regional GVA(I) estimates in this statistical bulletin cover the period 1997 to 2014.
Very few statistical revisions arise as a result of errors in the popular sense of the word. All estimates, by definition, are subject to statistical error but in this context the word refers to the uncertainty in any process or calculation that uses sampling, estimation or modelling. Most revisions reflect either the adoption of new statistical techniques or the incorporation of new information which allows the statistical error of previous estimates to be reduced. Only rarely are there avoidable errors such as human or system errors and such mistakes are made clear when they are discovered and corrected.
The main reasons for revisions are detailed in the What’s changed in this release? section.
Revisions to GVA estimates for 2014 are shown in table 4. Further detail is available in the revisions triangles on our website.
Table 4: UK Percentage revisions to workplace-based GVA in 2014 by UK NUTS1 region
| 2014 | Total revision (%) | Revision due to National Estimates (%) | Revision due to other regional dataset changes (%) | |||
| UK | 0.7 | 0.7 | 0.0 | |||
| North East | 1.1 | 1.2 | -0.1 | |||
| North West | 1.0 | 1.0 | 0.0 | |||
| Yorkshire and The Humber | 0.1 | 1.1 | -1.0 | |||
| East Midlands | 1.0 | 1.1 | -0.1 | |||
| West Midlands | 2.1 | 1.3 | 0.8 | |||
| East of England | 2.2 | 1.3 | 0.8 | |||
| London | 0.6 | 0.0 | 0.6 | |||
| South East | 0.7 | 1.4 | -0.7 | |||
| South West | 1.1 | 1.1 | 0.0 | |||
| Wales | -0.3 | 1.0 | -1.3 | |||
| Scotland | 0.7 | 0.8 | -0.1 | |||
| Northern Ireland | -1.9 | 0.7 | -2.6 | |||
| Extra-Regio | -9.0 | -10.3 | 1.4 | |||
| Source: Office for National Statistics | ||||||