Table of contents
- Main points
- Summary
- About this release
- Economic background for 2014
- Regional (NUTS1) GDHI estimates
- Sub-regional (NUTS2) GDHI estimates
- Local area (NUTS3) GDHI estimates
- Main components of GDHI
- Domestic (UK) use of regional GDHI estimates
- European use of disposable household income estimates
- Recent methodological changes
- Future work plans
- Background notes
- Methodology
1. Main points
Of the NUTS1 regions in 2014, London had the highest gross disposable household income (GDHI) per head where, on average, each person had £23,607 available to save or spend. Northern Ireland had the lowest where, on average, each person had £14,645. This compares with a UK average of £17,965.
In 2014, the highest growth in GDHI per head in the NUTS1 regions was in London at 1.9%, followed by the East Midlands at 0.8%. The largest decrease was in the West Midlands where GDHI per head fell by 0.5%. These figures are measured in current prices, so include the effect of inflation. The Consumer Prices Index grew by 1.5% in 2014, so only London increased in real terms.
Of the 173 NUTS3 local areas, in 2014 Kensington & Chelsea and Hammersmith & Fulham had the highest GDHI per head, where the average person had £45,988 available to save or spend. Leicester had the lowest, with the average person having £12,071.
In 2014, the highest growth in GDHI per head in NUTS3 local areas was in Lewisham and Southwark at 5.3%, followed by East Ayrshire and North Ayrshire mainland at 4.8%. The largest decrease was in Coventry where GDHI per head fell by 4.3%.
The GDHI per head index shows each region relative to the UK as a whole (UK=100). Of the NUTS3 local areas, Kensington & Chelsea and Hammersmith & Fulham has grown the most over the time series, from 193.1 in 1997 to 256.0 in 2014. Manchester had the largest decrease in relation to the UK average, from 91.8 in 1997 to 76.5 in 2014.
Back to table of contents2. Summary
This bulletin presents the latest estimates of gross disposable household income (GDHI) for regions, sub-regions and local areas of the UK. GDHI is the amount of money that all of the individuals in the household sector have available for spending or saving after income distribution measures (for example, taxes, social contributions and benefits) have taken effect.
It should be noted that these estimates relate to totals for all individuals within the household sector for a region rather than to an average household or family unit. GDHI per head are estimates of values for each person, not each household.
Total GDHI estimates in millions of pounds (£ million) are divided by the resident population of a region to give GDHI per head in pounds (£). This can be a useful way of comparing regions of different sizes.
Table 1: Countries of the UK gross disposable household income1, 20142
| NUTS1 Regions | GDHI per head (£) | GDHI per head growth on 2013 (percentage) | GDHI per head index (UK=100) | Total GDHI1 (£ million) | Total GDHI growth on 2013 (percentage) | Share of UK total GDHI1 (percentage) | |||
| United Kingdom | 17,965 | 0.5 | 100.0 | 1,160,485 | 1.3 | 100.0 | |||
| England | 18,315 | 0.6 | 101.9 | 994,797 | 1.4 | 85.7 | |||
| Wales | 15,302 | -0.1 | 85.2 | 47,316 | 0.3 | 4.1 | |||
| Scotland | 17,095 | 0.2 | 95.2 | 91,419 | 0.6 | 7.9 | |||
| Northern Ireland | 14,645 | -0.3 | 81.5 | 26,953 | 0.2 | 2.3 | |||
| Source: Office for National Statistics | |||||||||
| Notes: | |||||||||
| 1. Figures may not sum to totals as a result of rounding. | |||||||||
| 2. 2014 estimates are provisional. | |||||||||
Download this table Table 1: Countries of the UK gross disposable household income^1^, 2014^2^
.xls (26.6 kB)The UK per head figure in 2014 was £17,965. Of the four UK countries, only England had a higher GDHI per head value at £18,315. England also leads in terms of growth on 2013, at 0.6%. Northern Ireland had the lowest GDHI per head at £14,645 and the lowest growth at -0.3%.
Regional figures for the UK used in this release are presented for areas according to the European classification of Nomenclature of Units for Territorial Statistics (NUTS) (see background note 1 for more information).
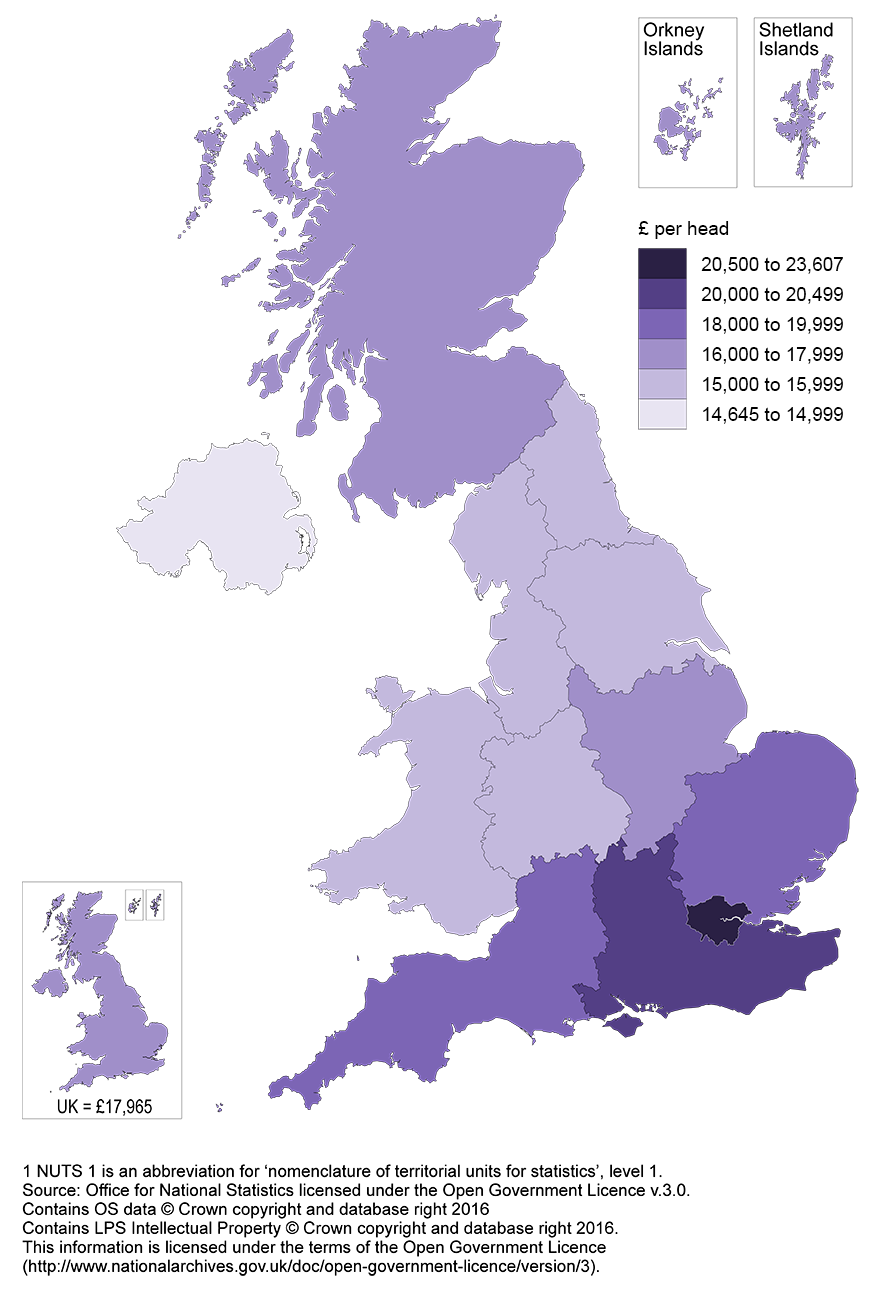
Map 1 shows the variation in GDHI per head across the UK in 2014.
Map 1: Gross disposable household income (GDHI) per head by NUTS1 area, UK, 2014
Source: Office for National Statistics
Download this image Map 1: Gross disposable household income (GDHI) per head by NUTS1 area, UK, 2014
.png (310.5 kB) .xlsx (10.1 kB)
In 2014, the UK average GDHI per head was £17,965. GDHI per head was above the UK average in 4 of the 12 NUTS1 regions:
- London, at £23,607
- the South East, at £20,434
- the East of England, at £18,897
- the South West, at £18,144
The lowest GDHI per head was in Northern Ireland at £14,645.
Figure 1: Percentage share of UK gross disposable household income 20141

Source: Office for National Statistics
Notes:
- Figures may not sum to totals as a result of rounding.
Download this image Figure 1: Percentage share of UK gross disposable household income 2014^1^
.png (23.0 kB) .xlsx (56.3 kB)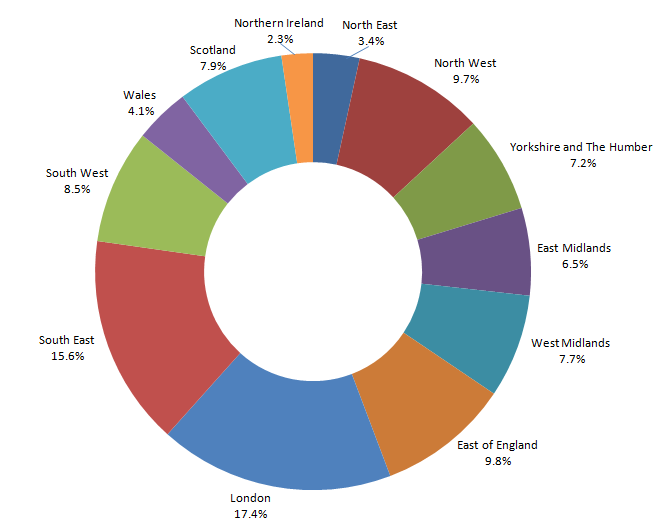
UK total GDHI in 2014 was £1,160 billion. Of that, 33.0% was in London and the South East, at 17.4% and 15.6% respectively. Northern Ireland had the lowest share of total GDHI in 2014 at 2.3%.
Since the start of the time series in 1997, 3 regions have increased their share of total GDHI:
- London, from 14.7% in 1997 to 17.4% in 2014
- the East of England, from 9.6% to 9.8%
- the South West, from 8.4% to 8.5%
Three regions’ shares were the same in 1997 and 2014 (to one decimal place): the East Midlands at 6.5%; the South East at 15.6%; and Northern Ireland at 2.3%. All other regions’ shares decreased, with the North West seeing the largest decrease in share from 10.6% in 1997 to 9.7% in 2014.
Back to table of contents3. About this release
Gross disposable household income (GDHI) is the amount of money that all of the individuals in the household sector have available for spending or saving after income distribution measures (for example, taxes, social contributions and benefits) have taken effect.
GDHI does not provide measures relating to actual households or family units.
The household sector comprises all individuals in an economy, including people living in traditional households as well as those living in institutions such as retirement homes and prisons. The sector also includes sole trader enterprises (the self-employed) and non-profit institutions serving households (NPISH). Examples of the latter include charities and most universities.
A distinction can be made between the two stages of income distribution:
The allocation of primary income account shows the income of households generated from employment and ownership of assets. The balance of primary income is equal to total primary resources less total primary uses:
- total primary resources: compensation of employees (income from employment), operating surplus (mainly rental, imputed or otherwise), mixed income from self-employment and property income received from financial assets
- total primary uses: property income paid (for example, mortgages, rent on land)
The secondary distribution of income account includes government redistribution of income. The balance of secondary income is equal to total secondary resources less total secondary uses:
- total secondary resources: social benefits (for example State Pension, Jobseeker's Allowance) and other current transfers received (such as financial gifts, non-life insurance claims)
- total secondary uses: current taxes on income and wealth, social contributions paid (employee's pension and social security contributions) and other current transfers paid (for example non-life insurance premiums)
GDHI is derived from the balances of primary and secondary income. It includes consumption of fixed capital (the decline in value of fixed assets due to normal wear and tear, items becoming obsolete and a normal rate of accidental damage).
GDHI = balance of primary income + balance of secondary income
GDHI estimates in this bulletin are available at three geographical levels, in accordance with the Nomenclature of Units for Territorial Statistics (NUTS) (see background note 1).
Per head data takes account of the entire resident population of regions, sub-regions and local areas. The working population and the economically inactive are included. These estimates are produced at current prices which include the effects of price changes.
Regional GDHI estimates for 2014 are released for the first time, with revisions (see background note 3) from 1997 to 2013 updating the estimates published in May 2015. Estimates for 2014 should be considered provisional until revised next year.
These estimates are consistent with the National Accounts Blue Book 2015. National aggregates for the components of GDHI are allocated to regions using the most appropriate regional indicator available. Further information on the methodology used to compile these estimates is available in the Regional Accounts Methodology Guide.
4. Economic background for 2014
The UK economy grew in real terms by an estimated 2.9% in 2014, up from growth of 2.2% in 2013 and the strongest annual economic growth since 2005. Growth during 2014 was relatively consistent through the year, with quarter on quarter growth of 0.6% during quarter 1 (Jan to Mar), 0.8% during quarter 2 (Apr to June) and 0.7% during quarter 3 (July to Sept) and again in quarter 4 (Oct to Dec).
The overall increase in gross domestic product (GDP) in 2014 compared with 2013 was aided by growth in household final consumption expenditure, general government final consumption expenditure and gross fixed capital formation. By contrast, there was a slight worsening of the UK’s net trade balance during the year. Nominal regional gross value added (GVA) increased in all UK regions and countries during 2014, with year-on-year growth highest in London (6.8%), East of England (5.3%) and Scotland (4.6%). Growth was lowest in Wales at 2.4%.
Throughout 2014, interest rates remained at 0.5%. Inflation, meanwhile, stayed below the Bank of England’s target rate of 2.0% throughout the year with the Consumer Prices Index rising by 1.5% from 2013 to 2014 following a 2.6% rise the previous year.
In 2014, the number of births of businesses exceeded the number of deaths of businesses in all UK regions and countries. London had the highest business birth rate at 17.7%, followed by the North East at 14.0% and the North West (13.7%). Northern Ireland had the lowest business birth rate at 8.7%.
Overall, the number of workforce jobs in the UK increased from December 2013 to December 2014. Jobs increased during this period by 2.6% in England and 1.4% in both Scotland and Wales. The number of workforce jobs remained unchanged in Northern Ireland. Within England, the East Midlands experienced the largest increase in jobs (3.8%) followed by the South West (3.3%) and Yorkshire and The Humber (3.2%). The smallest increases in jobs were observed in the North East (0.1%) and the West Midlands (1.8%).
Unemployment rates decreased in all four countries and all English regions between quarter 4 (Oct to Dec) 2013 and quarter 4 (Oct to Dec) 2014. The largest decreases in unemployment rates were in Yorkshire and The Humber and the West Midlands (by -2.4% and -2.2%). Employment rates increased in all countries and English regions except Wales, where the employment rate fell (by -1.1%). The largest increases in employment rate were in the North East and the North West. The experimental claimant count rate of Jobseeker's Allowance claimants decreased in all countries and English regions with the largest decrease in the North East, of -1.7%.
Total foreign exports of goods (measured by value) decreased from all UK countries between 2013 and 2014. The largest decrease was in Wales (-10.1%). For all countries this was due to roughly equal decreases in exports to both EU and non-EU countries, with the exception of Northern Ireland which slightly increased exports to the EU. At the regional level total exports increased for the North East (7.6%), West Midlands (6.3%) and South West (1.0%) and decreased for the remaining 6 English regions. The largest decrease was in London (-12.1%).
Back to table of contents5. Regional (NUTS1) GDHI estimates
Table 2: UK NUTS1 gross disposable household income, 20141
| NUTS1 Regions | GDHI per head (£) | GDHI per head growth on 2013 (percentage) | GDHI per head index (UK=100) | Total GDHI2 (£ million) | Total GDHI growth on 2013 (percentage) | Share of UK total GDHI2 (percentage) | |||
| United Kingdom | 17,965 | 0.5 | 100.0 | 1,160,485 | 1.3 | 100.0 | |||
| North East | 15,189 | 0.6 | 84.5 | 39,775 | 0.9 | 3.4 | |||
| North West | 15,776 | -0.1 | 87.8 | 112,528 | 0.3 | 9.7 | |||
| Yorkshire and The Humber | 15,498 | 0.4 | 86.3 | 83,068 | 0.9 | 7.2 | |||
| East Midlands | 16,217 | 0.8 | 90.3 | 75,207 | 1.6 | 6.5 | |||
| West Midlands | 15,611 | -0.5 | 86.9 | 89,189 | 0.2 | 7.7 | |||
| East of England | 18,897 | 0.2 | 105.2 | 113,729 | 1.3 | 9.8 | |||
| London | 23,607 | 1.9 | 131.4 | 201,574 | 3.4 | 17.4 | |||
| South East | 20,434 | 0.1 | 113.7 | 181,329 | 1.0 | 15.6 | |||
| South West | 18,144 | 0.7 | 101.0 | 98,399 | 1.6 | 8.5 | |||
| Wales | 15,302 | -0.1 | 85.2 | 47,316 | 0.3 | 4.1 | |||
| Scotland | 17,095 | 0.2 | 95.2 | 91,419 | 0.6 | 7.9 | |||
| Northern Ireland | 14,645 | -0.3 | 81.5 | 26,953 | 0.2 | 2.3 | |||
| Source: Office for National Statistics | |||||||||
| Notes: | |||||||||
| 1. 2014 estimates are provisional. | |||||||||
| 2. Figures may not sum to totals as a result of rounding. | |||||||||
Download this table Table 2: UK NUTS1 gross disposable household income, 2014^1^
.xls (27.6 kB)
Figure 2: UK NUTS1 gross disposable household income per head growth on previous year, 2010 to 2014
Source: Office for National Statistics
Download this chart Figure 2: UK NUTS1 gross disposable household income per head growth on previous year, 2010 to 2014
Image .csv .xlsIn 2014, gross disposable household income (GDHI) per head increased in 8 of the 12 NUTS1 regions. The highest growth in GDHI per head was in London at 1.9%, followed by the East Midlands at 0.8%. The largest decrease in GDHI per head was in the West Midlands at -0.5%, followed by Northern Ireland at -0.3%.
Figure 2 shows that following the economic downturn in 2009 GDHI per head growth has varied, with 2010 and 2012 showing stronger growth than 2011, 2013 and 2014. Growth prior to the economic downturn was typically more like growth seen in 2010 and 2012.
Setting the UK per head value to be 100 allows us to index regions against that average. Index values allow a direct comparison within any given period. Values below 100 indicate a region has less disposable income than the UK average, whereas values over 100 indicate a region has more disposable income than the UK average.
Figure 3: Countries of the UK gross disposable household income per head index comparison with UK average, 1997 to 2014
Source: Office for National Statistics
Download this chart Figure 3: Countries of the UK gross disposable household income per head index comparison with UK average, 1997 to 2014
Image .csv .xls
Figure 4: NUTS1 English regions gross disposable household income per head index comparison with UK average, 1997 to 2014
Source: Office for National Statistics
Download this chart Figure 4: NUTS1 English regions gross disposable household income per head index comparison with UK average, 1997 to 2014
Image .csv .xlsOver the time series from 1997 to 2014, only two regions increased their index values when compared with the UK average:
- London, from 122.1 in 1997 to 131.4 in 2014
- Scotland, from 94.5 to 95.2
Northern Ireland had an index value of 81.5 in both 1997 and 2014, despite rising to a value of 88.2 in 2007.
The largest decreases over this period were in:
- the West Midlands, from 91.0 in 1997 to 86.9 in 2014
- Yorkshire and The Humber, from 90.2 to 86.3
- the North West, from 91.3 to 87.8
Total GDHI (in millions of pounds instead of pounds per head) increased in all NUTS1 regions in 2014. The strongest increase was in London, with a rise of 3.4%, followed by the East Midlands and the South West, both with a 1.6% increase. The smallest increases were in the West Midlands and Northern Ireland, both with 0.2%.
Back to table of contents6. Sub-regional (NUTS2) GDHI estimates
Table 3: UK NUTS2 top 5 and bottom 51 gross disposable household income per head, 20142
| NUTS2 Sub-regions | GDHI per head (£) | GDHI per head growth on 2013 (percentage) | GDHI per head index (UK=100) | Total GDHI3 (£ million) | Total GDHI growth on 2013 (percentage) | ||||||||
| United Kingdom | 17,965 | 0.5 | 100.0 | 1,160,485 | 1.3 | ||||||||
| Top 5 GDHI per head | |||||||||||||
| Inner London - West | 41,393 | 2.3 | 230.4 | 46,481 | 3.6 | ||||||||
| Outer London - West and North West | 22,461 | 1.6 | 125.0 | 45,722 | 2.8 | ||||||||
| Surrey, East and West Sussex | 22,027 | -0.5 | 122.6 | 61,907 | 0.4 | ||||||||
| Outer London - South | 21,723 | -0.1 | 120.9 | 27,564 | 0.9 | ||||||||
| Berkshire, Buckinghamshire and Oxfordshire | 21,038 | -0.4 | 117.1 | 49,216 | 0.6 | ||||||||
| Bottom 5 GDHI per head | |||||||||||||
| West Wales and The Valleys | 14,933 | 0.5 | 83.1 | 29,085 | 0.7 | ||||||||
| Tees Valley and Durham | 14,817 | 0.7 | 82.5 | 17,544 | 1.0 | ||||||||
| South Yorkshire | 14,707 | 1.1 | 81.9 | 20,088 | 1.7 | ||||||||
| Northern Ireland | 14,645 | -0.3 | 81.5 | 26,953 | 0.2 | ||||||||
| West Midlands | 14,139 | 0.3 | 78.7 | 39,707 | 1.2 | ||||||||
| Source: Office for National Statistics | |||||||||||||
| Notes: | |||||||||||||
| 1. Data for all NUTS2 sub-regions are included in reference table 2. | |||||||||||||
| 2. 2014 estimates are provisional. | |||||||||||||
| 3. Figures may not sum to totals as a result of rounding. | |||||||||||||
Download this table Table 3: UK NUTS2 top 5 and bottom 5^1^ gross disposable household income per head, 2014^2^
.xls (28.2 kB)At the sub-regional level, the highest GDHI per head in 2014 was in Inner London – West at £41,393. This was followed by:
- Outer London – West and North West at £22,461
- Surrey, East and West Sussex at £22,027
- Outer London – South at £21,723
The lowest GDHI per head figures in 2014 were in:
- the West Midlands at £14,139
- Northern Ireland at £14,645
- South Yorkshire at £14,707
Northern Ireland is the same geographic area at both NUTS1 and NUTS2 levels. The West Midlands covers a different geographic area at NUTS1 and NUTS2 levels.
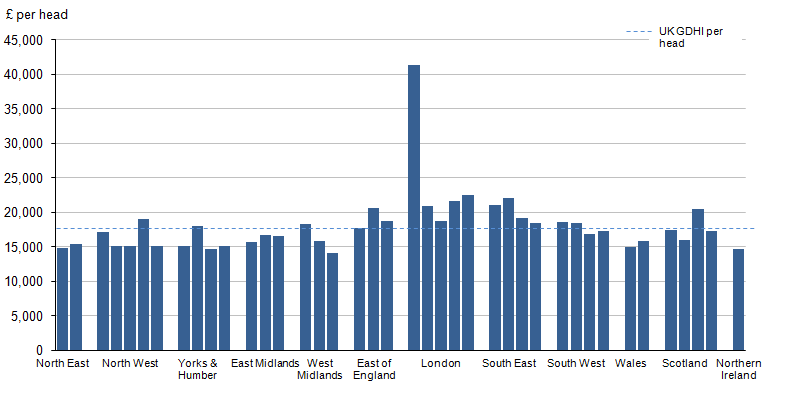
Figure 5: UK NUTS2 gross disposable household income per head grouped by NUTS1 region, 2014
Source: Office for National Statistics
Download this image Figure 5: UK NUTS2 gross disposable household income per head grouped by NUTS1 region, 2014
.png (21.5 kB) .xlsx (74.2 kB)
In 2014, of the 40 NUTS2 sub-regions, 17 were above the UK average GDHI per head of £17,965. In each of the NUTS2 sub-regions within London and the South East, GDHI per head was above the UK average. In each of the NUTS2 sub-regions within the North East, East Midlands, Wales and Northern Ireland, GDHI per head was below the UK average.
When compared with 2013, in 2014 26 sub-regions saw growth in GDHI per head, while 14 sub-regions saw decreases in GDHI per head. The highest increases were in:
- Inner London – East at 2.7%
- Outer London – East and North East at 2.3%
- Inner London – West 2.3%
- Hampshire and Isle of Wight at 1.9%
The largest decreases in sub-regions’ GDHI per head were in:
- North Yorkshire at -2.7%
- Shropshire and Staffordshire at -1.7%
- Merseyside at -1.4%
7. Local area (NUTS3) GDHI estimates
Table 4: UK NUTS3 top 10 and bottom 101 gross disposable household income per head, 20142
| NUTS3 Areas | GDHI per head (£) | GDHI per head growth on 2013 (percentage) | GDHI per head index (UK=100) | Total GDHI3 (£ million) | Total GDHI growth on 2013 (percentage) | ||||||||
| United Kingdom | 17,965 | 0.5 | 100.0 | 1,160,485 | 1.3 | ||||||||
| Top 10 GDHI per head | |||||||||||||
| Kensington & Chelsea and Hammersmith & Fulham | 45,988 | 4.7 | 256.0 | 15,385 | 4.8 | ||||||||
| Camden and City of London | 43,735 | 1.5 | 243.4 | 10,624 | 3.8 | ||||||||
| Westminster | 43,616 | -1.0 | 242.8 | 10,175 | 1.8 | ||||||||
| Wandsworth | 32,985 | 2.6 | 183.6 | 10,296 | 3.2 | ||||||||
| East Surrey | 25,229 | -1.8 | 140.4 | 9,916 | -0.8 | ||||||||
| West Surrey | 25,073 | -1.6 | 139.6 | 19,262 | -0.9 | ||||||||
| Hounslow and Richmond upon Thames | 23,897 | 0.9 | 133.0 | 10,973 | 2.1 | ||||||||
| Barnet | 23,886 | -0.0 | 133.0 | 8,955 | 1.6 | ||||||||
| Buckinghamshire CC | 23,778 | 0.3 | 132.4 | 12,410 | 1.4 | ||||||||
| Haringey and Islington | 23,602 | 0.6 | 131.4 | 11,531 | 2.6 | ||||||||
| Bottom 10 GDHI per head | |||||||||||||
| Luton | 13,775 | -2.7 | 76.7 | 2,906 | -1.3 | ||||||||
| Manchester | 13,746 | -0.5 | 76.5 | 7,151 | 0.6 | ||||||||
| Wolverhampton | 13,414 | -0.6 | 74.7 | 3,394 | 0.0 | ||||||||
| Coventry | 13,397 | -4.3 | 74.6 | 4,521 | -2.0 | ||||||||
| West and South of Northern Ireland | 13,350 | -1.0 | 74.3 | 5,641 | -0.2 | ||||||||
| Kingston upon Hull, City of | 12,781 | 1.0 | 71.1 | 3,294 | 1.1 | ||||||||
| Nottingham | 12,702 | 4.3 | 70.7 | 3,992 | 5.4 | ||||||||
| Sandwell | 12,505 | -0.8 | 69.6 | 3,961 | -0.1 | ||||||||
| Blackburn with Darwen | 12,096 | 0.3 | 67.3 | 1,775 | -0.1 | ||||||||
| Leicester | 12,071 | -1.4 | 67.2 | 4,076 | -0.3 | ||||||||
| Source: Office for National Statistics | |||||||||||||
| Notes: | |||||||||||||
| 1. Data for all NUTS3 local areas are included in reference table 2. | |||||||||||||
| 2. 2014 estimates are provisional. | |||||||||||||
| 3. Figures may not sum to totals as a result of rounding. | |||||||||||||
Download this table Table 4: UK NUTS3 top 10 and bottom 10^1^ gross disposable household income per head, 2014^2^
.xls (29.7 kB)
Figure 6: Distribution of NUTS3 areas gross disposable household income per head, 2014
Source: Office for National Statistics
Download this chart Figure 6: Distribution of NUTS3 areas gross disposable household income per head, 2014
Image .csv .xlsIn 2014, 3 of the 173 NUTS3 areas had GDHI per head more than double that of the UK average of £17,965. These were:
- Kensington & Chelsea and Hammersmith & Fulham at £45,988
- Camden and City of London at £43,735
- Westminster at £43,616
The NUTS3 areas with the lowest GDHI per head were Leicester, at £12,071, followed by Blackburn with Darwen, at £12,096.
All of the 10 areas with the highest GDHI per head were within London and the South East NUTS1 regions. However, 4 of these 10 areas saw a decrease in GDHI per head in 2014:
- East Surrey at -1.8%
- West Surrey at -1.6%
- Westminster at -1.0%
- Barnet at -0.0% (actual figure -0.01%)
Of the 10 NUTS3 areas with the lowest GDHI per head, 3 areas showed growth, the strongest being Nottingham with 4.3%. There were 7 areas which decreased, of these the largest decreases were in Coventry at -4.3% and Luton at -2.7%.
Of the 173 areas, the largest percentage decreases in GDHI per head in 2014 were in Coventry, with -4.3%, and East Dunbartonshire, West Dunbartonshire and Helensburgh & Lomond, with -3.8%. The largest percentage increases were in:
- Lewisham and Southwark, with 5.3%
- East Ayrshire and North Ayrshire mainland, with 4.8%
- Kensington & Chelsea and Hammersmith & Fulham, with 4.7%
When indexed to UK=100 we can see how NUTS3 local areas compare with the UK average. Over the course of the time series from 1997 to 2014, Kensington & Chelsea and Hammersmith & Fulham had the largest increase in index points, from 193.1 to 256.0. Westminster had the second largest increase, from 203.2 to 242.8. Manchester had the largest decrease in index points across the time series, from 91.8 to 76.5, diverging further from the UK average.
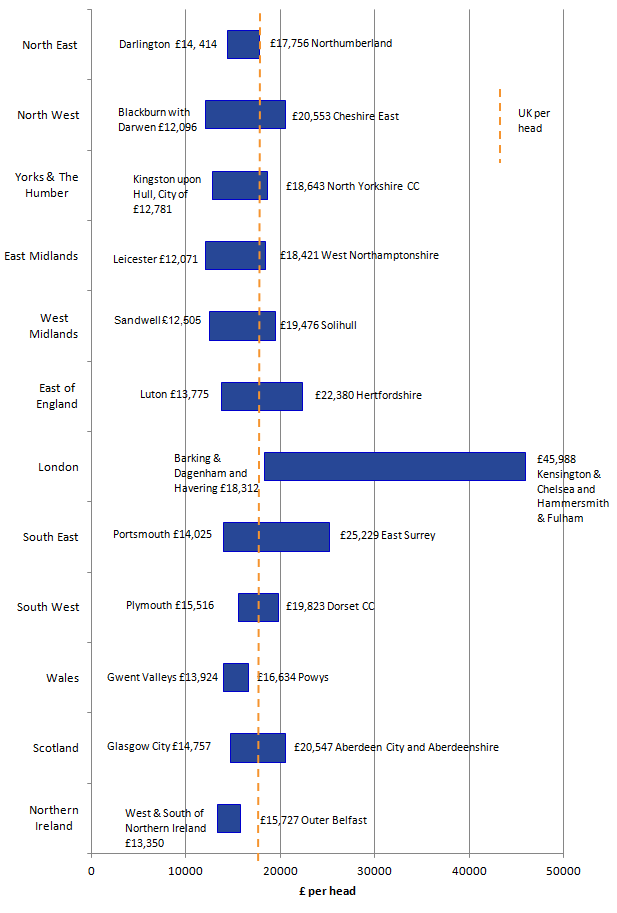
Figure 7: NUTS3 gross disposable household income per head highest and lowest NUTS3 area within each NUTS1 region, 2014
Source: Office for National Statistics
Download this image Figure 7: NUTS3 gross disposable household income per head highest and lowest NUTS3 area within each NUTS1 region, 2014
.png (35.0 kB) .xlsx (105.4 kB)
There is considerable variation in the range of GDHI per head within NUTS1 regions of the UK. Variation in 2014 is illustrated in Figure 7. The NUTS3 local areas with the highest and lowest GDHI per head within a NUTS1 region determine the range of GDHI per head within that region.
In 2014, Northern Ireland had the least amount of variation between its constituent local areas, from £13,350 in West and South of Northern Ireland to £15,727 in Outer Belfast. London had the greatest amount of variation, from £18,312 in Barking & Dagenham and Havering to £45,988 in Kensington & Chelsea and Hammersmith & Fulham.
Back to table of contents8. Main components of GDHI
In 2014, total gross disposable household income (GDHI) for the UK as a whole was £1,160 billion. GDHI is calculated as the money earned or received by the household and non-profit institutions serving households (NPISH) economic sector (resources, or incomings), less the money paid out by households and institutions associated to income (uses, or outgoings).
For more information about concepts discussed in this section, please see the ‘About this release’ section.
All data referenced in this section can be found in reference table 6.
Resources, or incomings, of the household and NPISH sector include:
- operating surplus, for example, imputed rental
- mixed income, for example, self employment income
- compensation of employees, for example, wages and salaries
- property income received, for example, interest earned on savings
- social contributions and benefits received, for example, Jobseekers Allowance, State Pension
- other current transfers received, for example, settlements of accident insurance, monetary gifts
In 2014, the total incomings of the household and NPISH sector was £1,723 billion, with compensation of employees being the largest component, accounting for £893 billion of the total. Figure 8 looks at how the different incomings of the household and NPISH sector vary by region.
Figure 8: NUTS1 incomings of the household and NPISH sector, 2014
Source: Office for National Statistics
Download this chart Figure 8: NUTS1 incomings of the household and NPISH sector, 2014
Image .csv .xlsCompensation of employees was by far the largest component of total incomings across all NUTS1 regions in 2014. It accounted for the largest share of total incomings in Scotland, at 54.7%, followed by London, at 54.3%. The South West received the smallest share of total incomings from compensation of employees, at 47.6%. This could be explained by the larger retired population living in this region; with the South West having the largest proportion of people aged 65 and over of all NUTS1 regions, at 21.1% in 2014.
The second largest incoming of the household and NPISH sector for all NUTS1 regions was social benefits and social contributions received. This was largest in Wales, at 24.1% of total incomings. It was smallest in London, at 12.6% of total incomings.
Uses, or outgoings, of the household and NPISH sector include:
- interest paid, for example, interest paid on loans and mortgages
- taxes on income, for example, income tax
- social contributions paid, for example, national insurance and pension contributions
- other current transfers paid, for example, premiums paid on non-life insurance policies
In 2014, the total outgoings of the household and NPISH sector was £563 billion, with social contributions and social benefits paid being the largest component, accounting for £290 billion of the total. Figure 9 looks at how the different outgoings of the household and NPISH sector differ by region.
Figure 9: NUTS1 outgoings of the household and NPISH sector, 2014
Source: Office for National Statistics
Download this chart Figure 9: NUTS1 outgoings of the household and NPISH sector, 2014
Image .csv .xlsSocial contributions and benefits paid was the largest component of outgoings across all NUTS1 regions in 2014. This includes contributions to National Insurance and pension funds by both employers and employees. It accounted for the largest share of total outgoings in Yorkshire and The Humber, at 55.4%, followed by Wales, at 55.2%. London paid the smallest share of total outgoings from social contributions and social benefits, at 46.2%.
The second largest outgoing of the household and NPISH sector for all NUTS1 regions was taxes on income. This was largest in London, at 43.5% of total outgoings. It was smallest in Northern Ireland, at 27.7% of total outgoings.
Back to table of contents9. Domestic (UK) use of regional GDHI estimates
These statistics provide an overview of economic diversity and social welfare at regional, sub-regional and local area levels. They supply information about the availability of disposable income throughout the UK. Disposable income is a concept which can be used to approximate the ‘material welfare’ within the household sector, although the term ‘welfare’ is commonly used in ways that go beyond financial wealth and, as such, cannot be measured by a single statistic.
These estimates are used by the UK government and the devolved administrations of Northern Ireland, Scotland and Wales to formulate and monitor economic policy and allocate resources.
The Scottish Government use these statistics as the basis for quarterly estimates of GDHI and the households and NPISH sector savings ratio within the Quarterly National Accounts Scotland release. The resulting statistics are widely used by economic commentators and academics in Scotland. The Scottish Government also use GDHI as one of a range of key economic indicators of economic performance, for example in Scotland's Economic Strategy (March 2015).
In Wales, the Well-being of Future Generations Act 2015 was introduced to improve the social, economic, environmental and cultural well-being of Wales. The Act puts in place seven well-being goals for Wales. These are for a more equal, prosperous, resilient, healthier and globally responsible Wales, with cohesive communities and a vibrant culture and thriving Welsh language. One of the indicators used to monitor progress is GDHI per head. As an indicator under the Act it must be referred to in the analyses of local well-being produced by public services boards when they are analysing the state of economic, social, environmental and cultural well-being in their areas. In addition, GDHI and primary income are also indicators used in ‘Welsh Economy in Numbers’, a publication on the Welsh Government website, which monitors key indicators of the Welsh economy.
The Northern Ireland Executive uses these statistics in conjunction with other economic measures and surveys to give an overall picture of the economy.
Local authorities use these statistics to facilitate evidence-based policy-making.
They are used in the House of Commons library to answer enquiries from MPs about regional differences in the income of households.
These statistics also inform the general public and provide insight into the relative socio-economic picture of the UK.
The ONS Regional Accounts team also receives general enquiries relating to these estimates from a diverse range of bodies including the Bank of England, other government departments, local authorities, business analysts, consultancy firms, financial institutions, economists, academics and the media (local and national).
Back to table of contents10. European use of disposable household income estimates
The production of regional disposable income of households is a legal requirement under the European System of Accounts (ESA2010). Whereas gross disposable household income is compiled for UK domestic use, the estimates provided to Eurostat (the statistical department of the European Commission) are net of consumption of fixed capital (see the ‘About this release’ section) at the NUTS2 level.
Consumption of fixed capital (CFC) is included in the operating surplus/mixed income (OS/MI) components of the primary income account. The CFC element is estimated and removed from the regional OS/MI, to derive the net disposable household income (NDHI) estimates.
The European Union (EU) uses these NDHI estimates to inform regional policy and analysis, and to identify disparities in regional welfare across the member states.
Member states provide estimates of NDHI in their national currencies. Eurostat then converts these using specific purchasing power standards for final consumption expenditure, called purchasing power consumption standards (PPCS). This process enables meaningful comparisons to be made between the member states.
The following chart illustrates the range of disposable income across EU NUTS2 sub-regions in 2013 (the most recent year for which member states' NDHI are available from Eurostat). The NUTS2 sub-regions with the highest and lowest disposable income per inhabitant (in purchasing power standards (PPS)) are displayed for each EU country. Some EU countries are represented by a single line as they only have 1 constituent NUTS2 sub-region, for example, Latvia.
Figure 10: Disposable income of private households per inhabitant (in PPCS), highest and lowest NUTS2 region within each country, 2013 1,2
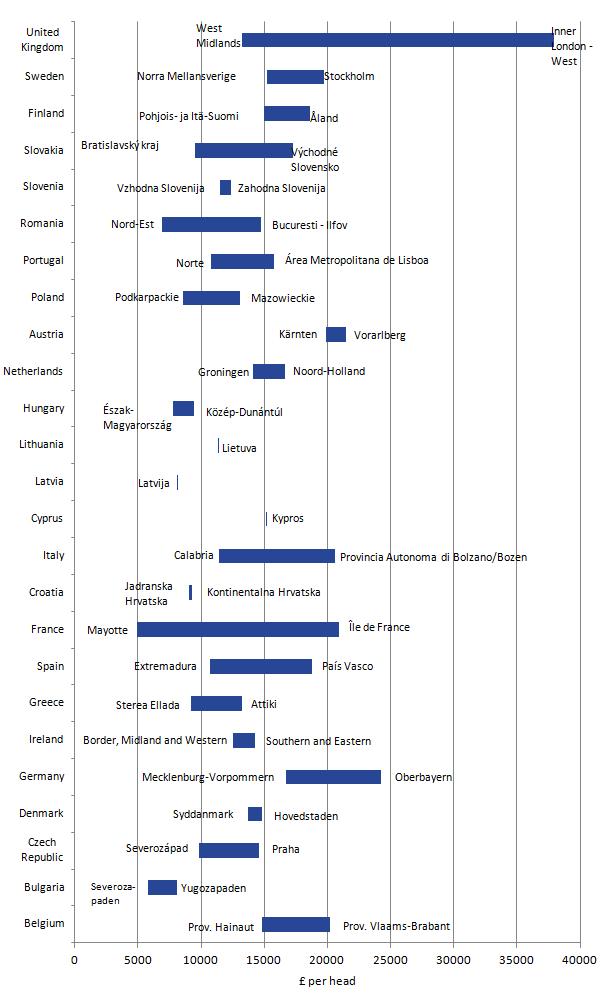
Source: Eurostat
Notes:
- Estonia, Luxembourg and Malta data not available
- Figures are shown in Purchasing Power Standards (PPS) (based on final consumption) per inhabitant
Download this image Figure 10: Disposable income of private households per inhabitant (in PPCS), highest and lowest NUTS2 region within each country, 2013 ^1,2^
.png (32.6 kB) .xlsx (72.6 kB)
Of the NUTS2 sub-regions shown on the chart, Inner London - West in the UK had the highest disposable income in 2013, followed by Oberbayern in Germany and Vorarlberg in Austria. The sub-region with the lowest disposable income in 2013 was Mayotte in France, followed by Severozapaden in Bulgaria and Nord-Est in Romania. The UK had the largest difference in disposable income of NUTS2 regions in 2013, followed by France.
Back to table of contents11. Recent methodological changes
The UK, along with all other European Union member states, has a programme of work to introduce the changes to data and methods required by the new European System of Accounts (ESA2010). There was one ESA2010 change in Blue Book 2015 which affected this GDHI publication. The change was to reflect Cross-Border Property Income (CBPI) relating to the ownership of second homes, including those in the UK owned by foreign nationals and those owned by UK residents but located in other countries.The activity has two components: property income (import and export) and housing services (import and export); which feature in both regional gross value added (GVA) and gross disposable household income (GDHI) as a part of rental income. Regional GDHI is only affected by the element of second homes abroad by UK residents. For the regional allocation of this, we have used data from Council Tax records and the 2001 and 2011 censuses, with gaps in coverage filled by modelling using overall housing stock. This is consistent with the method we used to regionalise CBPI in regional GVA in December. No further ESA2010 changes have required a specific regional methods change in the production of these estimates.
There has been a change in the average house prices used to calculate the regional allocation of imputed rental of owner-occupied dwellings. This change has been necessary because the former data source (provided by the Department for Communities and Local Government) is no longer available. The new data use median house prices from ONS instead of mean house prices, which reduces the impact of the most expensive houses and improves the consistency of estimates over time. This change is consistent with the new methodology used in regional GVA in December, with the exception of Northern Ireland: for GVA mean house prices were used for Northern Ireland as median house prices were unavailable, however we have now been able to source median house price data for Northern Ireland consistent with the rest of the UK regions and countries.
Last year we introduced a methodological change to the way we calculate the provisional year's estimates of compensation of employees, taxes and social contributions and social benefits to make use of additional data. The main data source for these components is administrative Pay-As-You-Earn (PAYE) data provided by HM Revenue and Customs (HMRC), which suffer a 1 year lag in timeliness. We made use of ONS survey data from the Labour Force Survey (LFS) and Annual Survey of Hours and Earnings (ASHE) survey to calculate annual growth in earnings for each local area, and applied these growth rates to the latest available PAYE data. During production of this year’s estimates of regional GDHI, last years' 2013 projection has been replaced with actual PAYE data from HMRC and we have used LFS and ASHE data to project estimates for 2014.
For regions that previously underwent boundary changes that were implemented in regional GDHI in 2015, there have been some revisions. Some of the administrative data that we receive from HMRC have now been supplied in-line with these boundary changes, so we have realigned our previous estimates for these regions with the actual values from HMRC.
In the reference tables we have previously published combined estimates for 'operating surplus/mixed income'. This year we have split out these estimates and published separate estimates of 'operating surplus' and 'mixed income'. Please see reference tables 6 to 10.
Back to table of contents12. Future work plans
Looking to the coming year, the regular work for the ONS Regional Accounts team will include the following:
We plan to produce gross disposable household income (GDHI) estimates for the Local Enterprise Partnership areas of England in summer 2016. These estimates will be consistent with the data in this publication.
The publication of regional GDHI estimates for the period 1997 to 2015 is currently planned for spring 2017.
We plan to publish estimates of regional, sub-regional and local gross value added compiled using the income approach (GVA(I)) for 1997 to 2015, in December 2016.
We plan to publish experimental estimates of real regional and sub-regional gross value added compiled using the production approach (GVA(P)) for 1998 to 2014, in December 2016.
There are a number of developments arising as a result of the devolution agenda and as recommended by the Independent Review of UK Economic Statistics. These developments are discussed in the article ‘Supporting Devolution: Developments in Regional and Local Statistics’.
Back to table of contents