Table of contents
- Main points
- Summary
- About this release
- Economic background for 2014
- Regional (NUTS1) GVA estimates
- Sub-regional (NUTS2) GVA estimates
- Local area (NUTS3) GVA estimates
- Industrial analysis
- Recent methodological changes
- Future work plans
- Domestic use of regional, sub-regional and local GVA estimates
- European Union use of UK sub-regional GVA estimates
- Background notes
- Methodology
1. Main points
In 2014 Gross Value Added (GVA) per head of population increased in all NUTS1 regions. The highest annual growth was in London at 5.3% and the lowest annual growth was in Northern Ireland at 1.9%
An interactive map showing GVA per head of population is available, along with an article discussing GVA for the main UK cities (see summary for links)
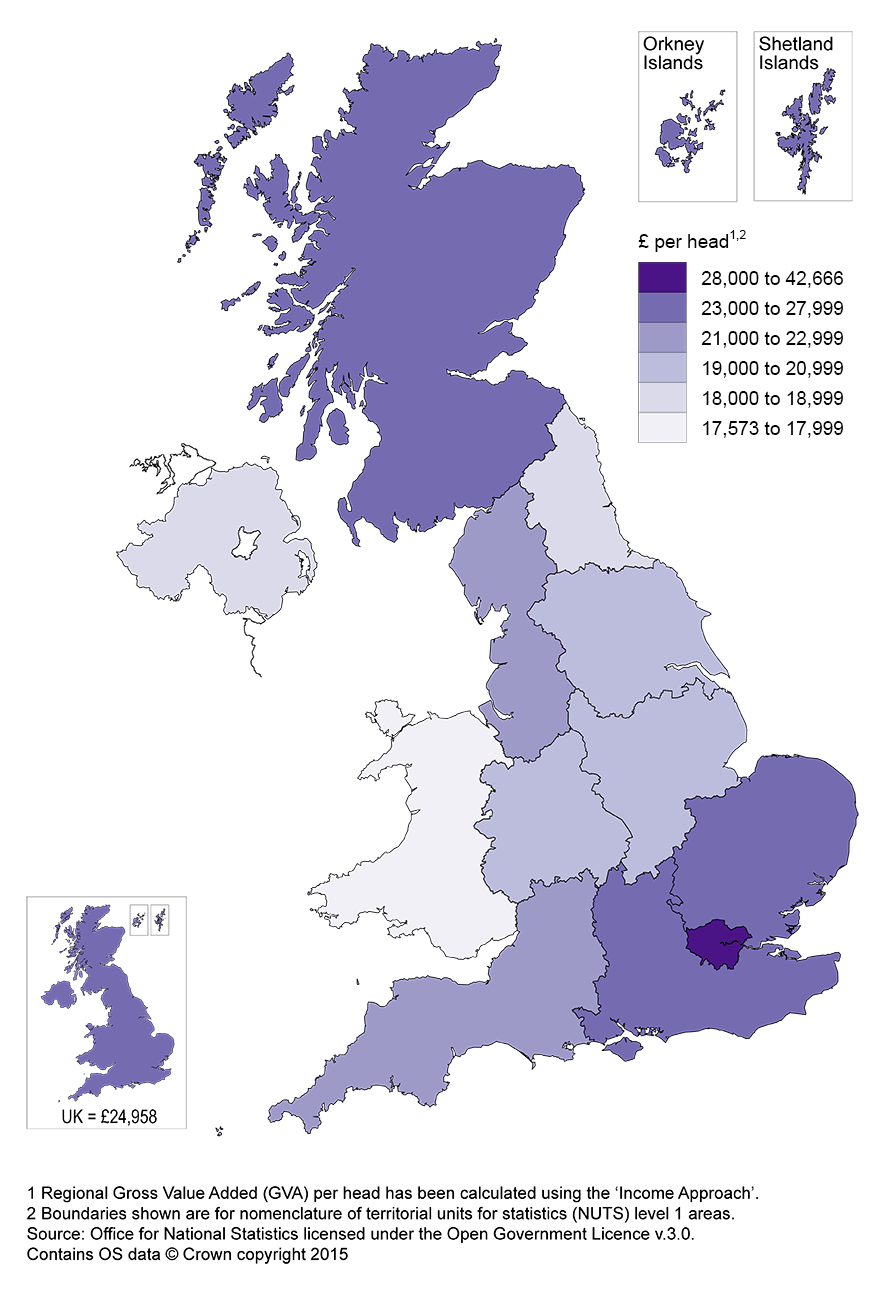
At the regional level, in 2014 London had the highest GVA per head at £42,666, while Wales had the lowest at £17,573
In 2014 at the sub-regional level, Inner London West and Outer London South both had the highest annual growth in GVA per head at 7.4%, while Cornwall and Isles of Scilly was the only sub-region to see a decrease in GVA per head, falling by 0.1%
At the local area level in 2014, Croydon had the highest annual growth in GVA per head at 9.3%. Tower Hamlets had the greatest decrease in GVA per head, falling by 2.6%
The North East shows the least amount of variation in levels of GVA per head within a region, with a difference of £8,766 between the highest and lowest local areas. London shows the highest amount of variation, with a difference of £281,620 in 2014
2. Summary
Gross Value Added (GVA) is a measure of the increase in the value of the economy due to the production of goods and services. It is measured at current basic prices, which include the effect of inflation, excluding taxes (less subsidies) on products (for example, Value Added Tax). GVA plus taxes (less subsidies) on products is equivalent to Gross Domestic Product (GDP).
These regional estimates of GVA are measured using the income approach, which involves adding up the income generated by resident individuals or corporations in the production of goods and services. ONS also publishes experimental estimates of GVA measured using the production approach, with the effect of inflation removed.
Total GVA estimates in millions of pounds (£m) are divided by the resident population of a region to give GVA per head in pounds (£). This can be a useful way of comparing regions of different sizes, provided there are no large commuting flows into or out of the region (background note 4).
The UK per head figure in 2014 was £24,958. With Extra-Regio and the Statistical Discrepancy excluded, the UK per head figure was £24,616. Of the four UK countries, only England had a higher GVA per head value at £25,367. Wales had the lowest GVA per head at £17,573. The largest growth in GVA per head between 2013 and 2014 was in Scotland at 4.2%, while the lowest growth was in Northern Ireland at 1.9%.
Table 1: UK Countries GVA[1,2], 2014[3]
| GVA per head (£)2 | GVA per head growth on 2013 (%) | GVA per head index (UK=100) | Total GVA (£m)2 | Total GVA growth on 2013 (%) | |
| United Kingdom4 | 24,616 | 3.6 | 100.0 | 1,618,346 | 4.6 |
| England | 25,367 | 3.7 | 103.1 | 1,377,851 | 4.6 |
| Wales | 17,573 | 2.1 | 71.4 | 54,336 | 2.4 |
| Scotland | 23,102 | 4.2 | 93.9 | 123,543 | 4.6 |
| Northern Ireland | 18,682 | 1.9 | 75.9 | 34,384 | 2.5 |
| Source: Office for National Statistics Notes: 1. GVA at current basic prices on workplace basis (background note 3). 2. Figures may not sum due to rounding in totals; per head (£) figures are rounded to the nearest pound. 3. 2014 estimates are provisional. 4. Per head and per head index figures exclude the statistical discrepancy and Extra-Regio: the off-shore contribution to GVA that cannot be assigned to any region (background note 1). These are included in the total GVA figure. | |||||
Download this table Table 1: UK Countries GVA[1,2], 2014[3]
.xls (26.6 kB)Regional figures for the UK are presented for areas according to the Nomenclature of Units for Territorial Statistics (NUTS) (background note 1 has more information).
In 2014 GVA per head was highest in London, at £42,666, and lowest in Wales, at £17,573. Map 1 shows the variation in GVA per head across the UK. ONS has also published an Interactive Map and an article on the major cities to accompany this release.
Map 1: Regional GVA per head by NUTS 1 area, United Kingdom, 2014
Source: Office for National Statistics
Download this image Map 1: Regional GVA per head by NUTS 1 area, United Kingdom, 2014
.png (335.3 kB)
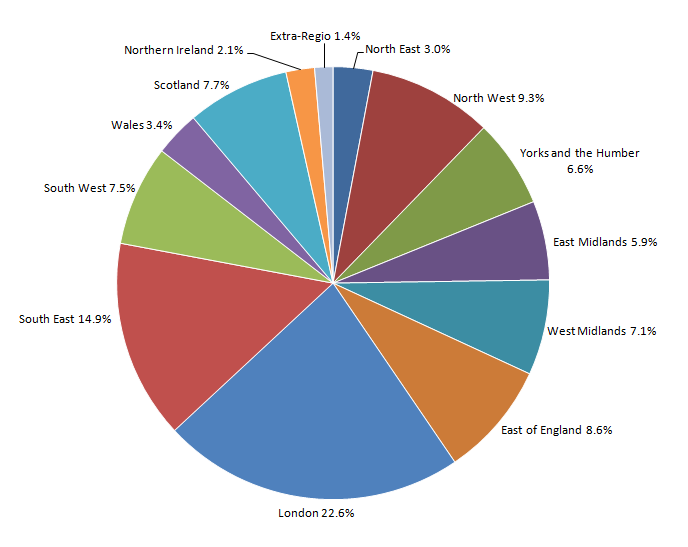
In 2014 London had the highest share of UK GVA, with 22.6%, followed by the South East with 14.9%. The lowest share after Extra-Regio was Northern Ireland, with 2.1%, followed by the North East with 3.0%.
Since the start of the time series in 1997 London has increased its share by 3.7 percentage points. The South East has also increased, by 0.3 percentage points. All other regions decreased, with the West Midlands decreasing the most, by 0.9 percentage points.
Figure 1: Regional share of total GVA, 2014
Source: Office for National Statistics
Download this image Figure 1: Regional share of total GVA, 2014
.png (52.9 kB) .xls (70.7 kB)
3. About this release
These regional estimates of Gross Value Added are measured using the income approach. This involves adding up the income generated by resident individuals or corporations in the production of goods and services. It is calculated gross of deductions for consumption of fixed capital, which is the amount of fixed assets used up in the process of production in any period.
A more detailed breakdown of the components of income has also been published for the first time in the reference tables and via the ONS Data Explorer tool. This comprises regional estimates of Compensation of Employees; Mixed Income; Rental Income; Non-Market Capital Consumption; Holding Gains; Gross Trading Profits; Gross Trading Surplus; and Taxes on Production. More information on these components can be found in the Regional Accounts Methodology Guide (498.7 Kb Pdf) .
These estimates are consistent with the National Accounts Blue Book 2015. National aggregates for the components of GVA are allocated to regions using the most appropriate regional indicator available. These estimates are produced at current prices, which include the effect of inflation.
GVA estimates in this bulletin are available at three geographical levels, in accordance with the NUTS classification. These estimates are published for the first time using new NUTS boundaries from the 2013 review, which came into force on 1 January 2015 (see background note 1).
GVA per head of population is a useful way of comparing regions of different sizes and is an important indicator for both domestic and European policy purposes. It is calculated using the entire population (including the economically inactive).
These regional GVA estimates update those published in December 2014 for the period 1997-2013. Additionally, provisional estimates for the year 2014 are released for the first time. These figures are provisional as national estimates have not been through Supply and Use balancing at the time of this publication.
Industry estimates are also published at t-1 (where t is the current year) for all levels of geography for the first time (previously only available at t-2) (see background note 6).
Regional GVA(I) data are now available via the ONS Data Explorer tool. The data previously published via the Timeseries section of the ONS website will no longer be updated from this release and henceforth, although old versions of the figures may remain for some time.
4. Economic background for 2014
The UK economy (3.73 Mb Excel sheet) grew in real terms by an estimated 2.9% in 2014, displaying the strongest annual economic growth since 2005. During 2014 the expansion in Gross Domestic Product (GDP) was relatively consistent on a quarterly basis, with growth of 0.6% during quarter 1 (Jan to March) and quarter 3 (July to Sept), 0.9% during quarter 2 (April to June) and 0.8% during quarter 4 (Oct to Dec).
The increase in GDP during 2014 was supported by growth in household final consumption expenditure (1 Mb Excel sheet) of 2.7% year-on-year. There was also a positive contribution to GDP growth from an improvement in the UK’s net trade balance during the year. Gross fixed capital formation, with a 7.5% year-on-year increase, and Government Expenditure (up 1.9%) also positively impacted on GDP. The Bank of England base rate remained at 0.5% throughout 2014. During the year inflation stayed below the 2% target. The Consumer Price Index (CPI) annual average rate for 2014 stood at 1.5%, decreasing from the 2.6% in 2013.
In 2014 business demography figures for the UK show a total business birth rate of 13.7% and a death rate of 9.6%. These rates imply an increase of around 102,000 active businesses compared to 2013. The business birth rate exceeded the death rate in all UK countries. At regional level, London had the highest business birth rate at 17.7%, followed by the North East (14.0%) and the North West (13.7%). The lowest birth rate was recorded for Northern Ireland, at 8.7%.
Workforce jobs increased in all UK regions except Northern Ireland between the fourth quarter of 2013 (Oct to Dec) and the corresponding period in 2014. The largest percentage increase was in the North West, with 4.1%, followed by London with 3.8%, while Northern Ireland decreased by 0.6%. During the same period, employment rates increased in all regions except Wales, which decreased by 1.5%. The highest increases were in the North East (2.5%) and the North West (2.2%).
The unemployment rate (73 Kb Excel sheet) also declined in all UK regions over the same period. The largest contractions in unemployment rates were in Yorkshire and The Humber (-2.4%), the West Midlands (-2.2%) and East Midlands (-2.0%). The smallest declines in the rates were in Wales (-0.3%) and the South East (-0.5%).
Total foreign export of goods decreased from all UK countries between 2013 and 2014. However, at the regional level total exports increased from the North East (7.6%), West Midlands (6.2%) and the South West (1.0%). The North East and the West Midlands increased their export towards both EU and non-EU destinations. The total increase in the South West was instead due to EU export growth that compensated a slight decline in non-EU exports. An increase of export towards EU countries was also recorded for Northern Ireland, but this was not sufficient to offset the contraction to other destinations.
Back to table of contents5. Regional (NUTS1) GVA estimates
Table 2: NUTS1 regional GVA [1,2], 2014 [3]
| NUTS1 regions | GVA per head (£)2 | GVA per head growth on 2013 (%) | GVA per head index (UK=100) | Total GVA (£m)2 | Total GVA growth on 2013 (%) | Share of UK total GVA (%)4 |
| United Kingdom5 | 24,616 | 3.6 | 100.0 | 1,618,346 | 4.6 | 100.0 |
| North East | 18,216 | 2.9 | 74.0 | 47,702 | 3.3 | 3.0 |
| North West | 21,011 | 2.7 | 85.4 | 149,869 | 3.1 | 9.3 |
| Yorkshire and The Humber | 19,863 | 2.8 | 80.7 | 106,467 | 3.3 | 6.6 |
| East Midlands | 20,524 | 3.1 | 83.4 | 95,178 | 4.0 | 5.9 |
| West Midlands | 20,086 | 2.3 | 81.6 | 114,755 | 3.0 | 7.1 |
| East of England | 23,063 | 4.2 | 93.7 | 138,801 | 5.3 | 8.6 |
| London | 42,666 | 5.3 | 173.3 | 364,310 | 6.8 | 22.6 |
| South East | 27,012 | 2.8 | 109.7 | 239,698 | 3.7 | 14.9 |
| South West | 22,324 | 3.1 | 90.7 | 121,070 | 4.0 | 7.5 |
| England | 25,367 | 3.7 | 103.1 | 1,377,851 | 4.6 | 85.5 |
| Wales | 17,573 | 2.1 | 71.4 | 54,336 | 2.4 | 3.4 |
| Scotland | 23,102 | 4.2 | 93.9 | 123,543 | 4.6 | 7.7 |
| Northern Ireland | 18,682 | 1.9 | 75.9 | 34,384 | 2.5 | 2.1 |
| Extra-Regio | n/a | n/a | n/a | 22,097 | -9.5 | 1.4 |
| Source: Office for National Statistics Notes: 1. GVA at current basic prices on workplace basis (background note 3). 2. Figures may not sum due to rounding in totals; per head (£) figures are rounded to the nearest pound. 3. 2014 estimates are provisional. 4. Shares have been calculated as the regions’ proportions of the UK total excluding statistical discrepancy. 5. Per head and per head index figures exclude the statistical discrepancy and Extra-Regio: the off-shore contribution to GVA that cannot be assigned to any region (background note 1). These are included in the total GVA figure. | ||||||
Download this table Table 2: NUTS1 regional GVA [1,2], 2014 [3]
.xls (29.2 kB)In 2014 GVA per head of population increased in all NUTS1 regions. The largest percentage increase was in London at 5.3%, over 1 percentage point ahead of the next two regions, Scotland and East of England, both at 4.2%. Northern Ireland had the smallest percentage increase at 1.9%, followed by Wales at 2.1%. All other regions had increases of between 2.3% and 3.1%.
Figure 2 shows the annual growth in GVA per head for each UK region in 2012, 2013 and 2014. The North East, Yorkshire and The Humber, East of England and London are the only regions that have shown increasing growth in each of these years.
Figure 2: NUTS1 GVA per head growth, 2012, 2013 and 2014
Source: Office for National Statistics
Download this chart Figure 2: NUTS1 GVA per head growth, 2012, 2013 and 2014
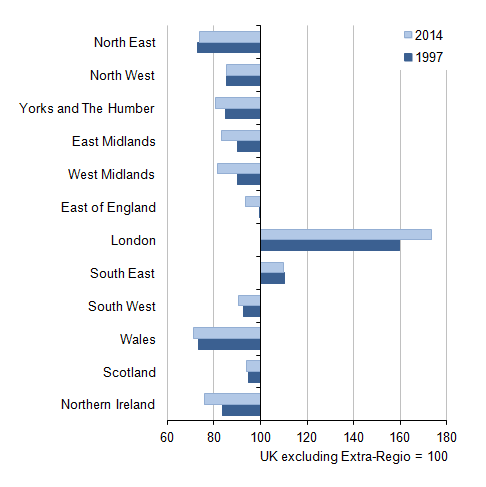
Image .csv .xlsGVA per head indices show how a region compares with the UK average (where the UK is equal to 100). When compared with the UK average, in 1997 and 2014 respectively, only London and the South East had per head indices above the UK value. During this period only two regions’ per head indices increased compared with the UK average:
London, which increased 13.5 points to 173.3
North East, which increased 0.9 points to 74.0
All other regions decreased compared to the UK average. The largest decrease was in the West Midlands, which fell 8.6 points to 81.6, followed by Northern Ireland, which fell 7.7 points to 75.9. Figure 3 illustrates each region’s GVA per head indices compared with the UK average of 100 for the years 1997 and 2014.
Figure 3: NUTS1 GVA per head indices, 1997 and 2014
Source: Office for National Statistics
Download this image Figure 3: NUTS1 GVA per head indices, 1997 and 2014
.png (19.9 kB) .xls (69.1 kB)
6. Sub-regional (NUTS2) GVA estimates
Table 3: NUTS2 top 5 and bottom 5 sub-regions [1] by GVA [2] per head, 2014 [3]
| NUTS2 sub-regions | GVA per head (£) | GVA per head growth on 2013 (%) | GVA per head index (UK=100) | Total GVA (£m) | Total GVA growth on 2013 (%) |
| United Kingdom4 | 24,616 | 3.6 | 100.0 | 1,618,346 | 4.6 |
| Top five GVA per head | |||||
| Inner London - West | 134,961 | 7.4 | 548.3 | 151,549 | 8.8 |
| Inner London - East | 41,529 | 1.8 | 168.7 | 94,385 | 4.0 |
| North Eastern Scotland | 37,460 | 2.9 | 152.2 | 18,336 | 3.9 |
| Berkshire, Buckinghamshire and Oxfordshire | 34,230 | 3.1 | 139.1 | 80,076 | 4.1 |
| Cheshire | 28,267 | 2.8 | 114.8 | 25,803 | 3.3 |
| Bottom five GVA per head | |||||
| Lincolnshire | 18,496 | 2.1 | 75.1 | 13,530 | 3.1 |
| South Yorkshire | 17,462 | 3.8 | 70.9 | 23,850 | 4.4 |
| Cornwall and Isles of Scilly | 17,278 | -0.1 | 70.2 | 9,462 | 0.6 |
| Tees Valley and Durham | 17,055 | 2.8 | 69.3 | 20,194 | 3.0 |
| West Wales and The Valleys | 15,745 | 2.5 | 64.0 | 30,666 | 2.8 |
| Source: Office for National Statistics | |||||
| 1. Data for all NUTS2 sub-regions are included in reference tables 1 to 5. | |||||
| 2. GVA at current basic prices on workplace basis (background note 3). | |||||
| 3. 2014 estimates are provisional. | |||||
| 4. Per head and per head index figures exclude the statistical discrepancy and Extra-Regio: the off-shore contribution to GVA that cannot be assigned to any region (background note 1). These are included in the total GVA figure. | |||||
Download this table Table 3: NUTS2 top 5 and bottom 5 sub-regions [1] by GVA [2] per head, 2014 [3]
.xls (27.6 kB)The NUTS 2015 boundary changes (see background note 1) have increased the number of NUTS2 sub-regions from 37 to 40. The change was to increase the number of London sub-regions from two to five.
In 2014 GVA per head increased in 39 of the 40 NUTS2 sub-regions. The largest percentage increases were in:
Inner London West, 7.4%
Outer London South, 7.4%
South Western Scotland, 5.1%
Outer London - East and North East, 4.9%.
The only sub-region not to increase was Cornwall and Isles of Scilly, where GVA per head decreased by 0.1%.
Ten sub-regions had GVA per head higher than the UK average of £24,616, with four sub-regions having a GVA per head of above £30,000:
Inner London – West, £134,961
Inner London – East, £41,529
North Eastern Scotland, £37,460
Berkshire, Buckinghamshire and Oxfordshire, £34,230
West Wales and The Valleys had the lowest GVA per head with £15,745.
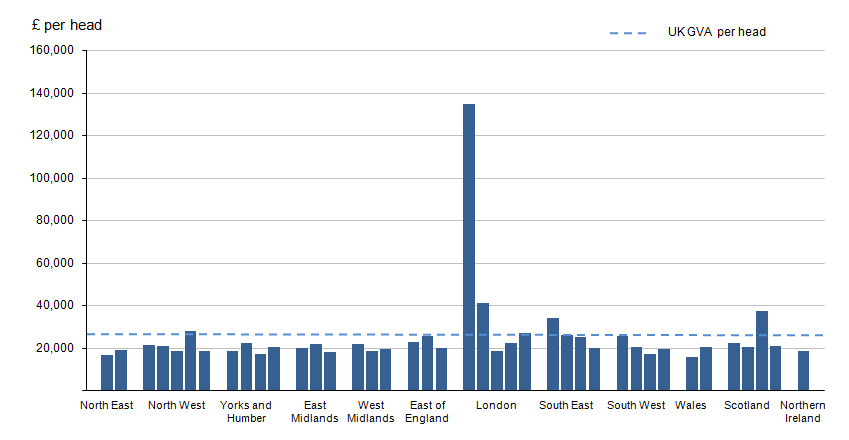
Figure 4 shows each NUTS2 region grouped into its parent NUTS1 region, with the horizontal line representing the UK average GVA per head.
Figure 4: NUTS2 GVA per head grouped by NUTS1 region, 2014
Source: Office for National Statistics
Download this image Figure 4: NUTS2 GVA per head grouped by NUTS1 region, 2014
.png (11.2 kB) .xls (75.3 kB)
7. Local area (NUTS3) GVA estimates
Table 4: NUTS3 top 10 and bottom 10 local areas [1] by GVA [2] per head, 2014 [3]
| NUTS3 local areas | GVA per head (£) | GVA per head growth on 2013 (%) | GVA per head index (UK=100) | Total GVA (£m) | Total GVA growth on 2013 (%) |
| United Kingdom4 | 24,616 | 3.6 | 100.0 | 1,618,346 | 4.6 |
| Top ten GVA per head | |||||
| Camden and City of London | 298,520 | 8.9 | 1,212.7 | 72,516 | 11.4 |
| Westminster | 218,788 | 3.4 | 888.8 | 51,042 | 6.3 |
| Tower Hamlets | 97,306 | -2.6 | 395.3 | 27,636 | 1.4 |
| Kensington & Chelsea and Hammersmith & Fulham | 57,650 | 6.7 | 234.2 | 19,287 | 6.8 |
| Haringey and Islington | 44,957 | 1.5 | 182.6 | 21,965 | 3.5 |
| Milton Keynes | 39,709 | 4.4 | 161.3 | 10,294 | 5.8 |
| Berkshire | 38,961 | 1.9 | 158.3 | 34,506 | 2.8 |
| Aberdeen City and Aberdeenshire | 37,460 | 2.9 | 152.2 | 18,336 | 3.9 |
| Edinburgh, City of | 35,779 | 2.3 | 145.4 | 17,628 | 3.4 |
| Belfast | 34,583 | 0.7 | 140.5 | 9,793 | 1.3 |
| Bottom ten GVA per head | |||||
| Dudley | 14,980 | 1.9 | 60.9 | 4,731 | 2.4 |
| Northumberland | 14,979 | 2.6 | 60.8 | 4,733 | 2.6 |
| Blackpool | 14,907 | 0.8 | 60.6 | 2,094 | 0.1 |
| Sefton | 14,742 | 3.7 | 59.9 | 4,032 | 3.8 |
| East Dunbartonshire, West Dunbartonshire and Helensburgh & Lomond | 14,532 | 0.8 | 59.0 | 3,235 | 1.2 |
| North of Northern Ireland | 14,349 | 2.2 | 58.3 | 4,183 | 2.6 |
| Wirral | 13,589 | 2.0 | 55.2 | 4,361 | 2.2 |
| East Ayrshire and North Ayrshire mainland | 13,546 | 3.9 | 55.0 | 3,422 | 3.6 |
| Gwent Valleys | 13,479 | 1.3 | 54.8 | 4,599 | 1.5 |
| Isle of Anglesey | 13,162 | 3.1 | 53.5 | 924 | 3.4 |
| Source: Office for National Statistics | |||||
| Correction: 13 July 2016.Processing errors affecting the compilation of this release have been discovered. These errors have now been corrected and the impact was to change estimates of the rental income component at the NUTS3 level for a number of industries, therefore also affecting estimates of total gross value added at the NUTS3 level for a number of industries. There are larger changes to some of the NUTS3 regions within the North West, East of England, London and the South East regions. Other NUTS3 areas are affected to a lesser extent. This correction does not impact NUTS1 or NUTS2 figures. | |||||
| 1. Data for all NUTS3 local areas are included in reference tables 1 to 5. | |||||
| 2. GVA at current basic prices on workplace basis (background note 3). | |||||
| 3. 2014 estimates are provisional. | |||||
| 4. Per head and per head index figures exclude the statistical discrepancy and Extra-Regio: the off-shore contribution to GVA that cannot be assigned to any region (background note 1). These are included in the total GVA figure. | |||||
Download this table Table 4: NUTS3 top 10 and bottom 10 local areas [1] by GVA [2] per head, 2014 [3]
.xls (29.7 kB)The NUTS 2015 boundary changes (see background note 1) have increased the number of NUTS3 local areas from 139 to 173. Key changes occurred in London and Manchester.
In 2014 GVA per head increased in 168 of the 173 NUTS3 local areas. The largest percentage increases were in:
Croydon, 9.3%
Darlington, 8.9%
Camden and City of London, 8.9%
GVA per head decreased in five local areas. The decreases were in:
- Tower Hamlets, -2.6%
- Swindon, -0.6%
- York, -0.6%
- Cornwall and Isles of Scilly, -0.1%
- Durham CC, -0.0% (actual figure -0.01%)
There were 45 local areas that had GVA per head higher than the UK average of £24,616 in 2014, the top five of which were within London. These were followed by Milton Keynes, Berkshire, and Aberdeen City and Aberdeenshire.
The two local areas with the lowest GVA per head were in Wales, Isle of Anglesey with £13,162 and Gwent Valleys with £13,479.
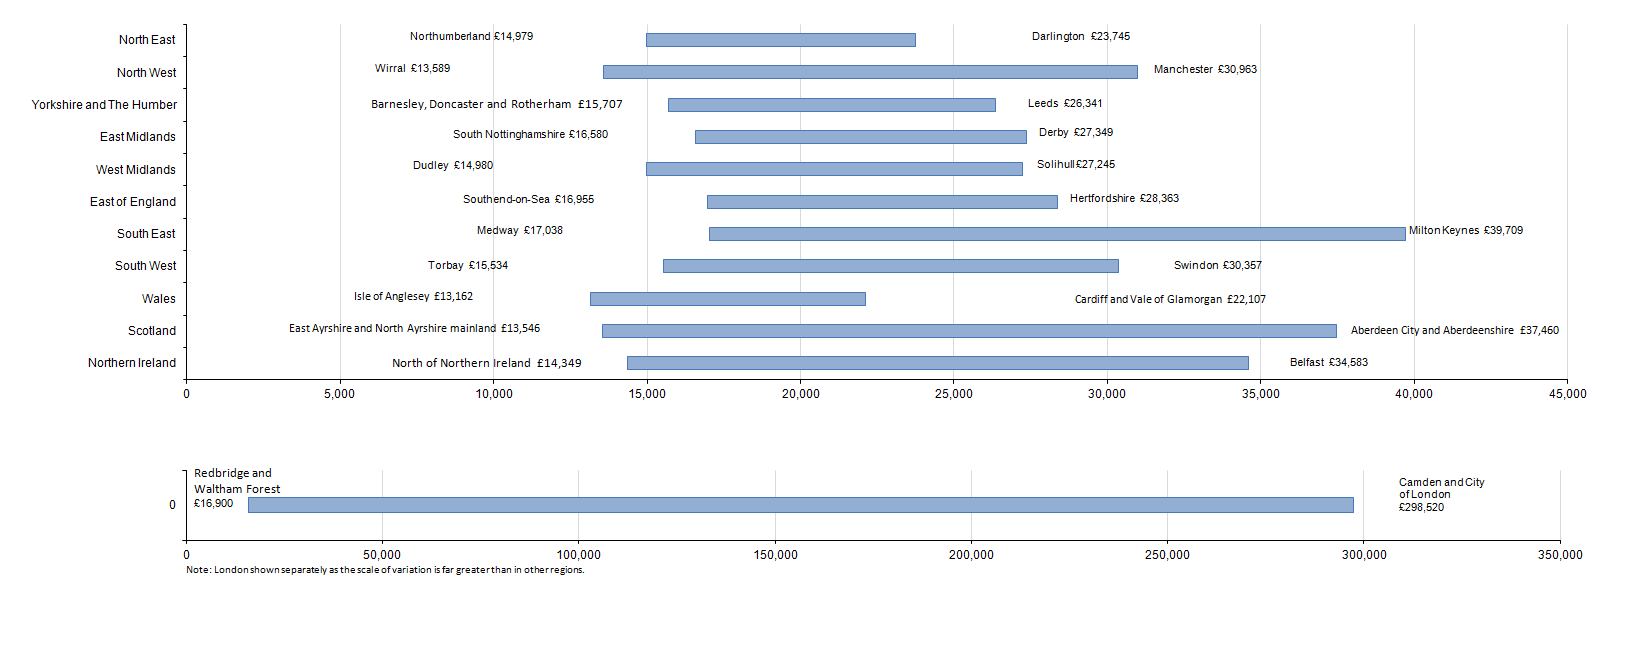
There is considerable variation in the range of GVA per head within NUTS1 regions of the UK. Variation in 2014 is illustrated in Figure 5. The NUTS3 local areas with the highest and lowest GVA per head within a NUTS1 region determine the range of GVA per head within that region.
In 2014 the North East had the least amount of variation between its constituent local areas, from £14,979 in Northumberland to £23,745 in Darlington. London had the greatest amount of variation, from £16,900 in Redbridge and Waltham Forest to £298,520 in Camden and City of London.
Figure 5: NUTS3 GVA per head variation within NUTS1 regions, 2014
Source: Office for National Statistics
Download this image Figure 5: NUTS3 GVA per head variation within NUTS1 regions, 2014
.png (37.0 kB) .xls (188.4 kB)
8. Industrial analysis
In this release, industry estimates for the years 2013 and 2014 have been published for the first time. Industry estimates were previously only available at t-2 (where t is the current year). It should be noted that all 2014 data in this release are provisional as they are based on national data that have not been through the Supply and Use balancing process. The provisional industry estimates compiled using the income approach will not match those published in the UK National Accounts, compiled using the output approach. The difference is shown in the statistical discrepancy that can be found in the reference tables released with this bulletin.
Figure 6 shows the industrial composition of total GVA for each country in 2014. Looking at the growth between 2013 and 2014:
at the UK level the strongest annual growth in 2014 was seen in the construction industry (9.2%). Construction was the strongest growing industry in all countries except Northern Ireland, where it was second only to recreation and other services
the lowest annual growth in 2014 at the UK level was in agriculture, mining and the utilities (electricity, gas and water), which decreased by 4.5%. It was also the lowest growing industry in all four countries
at the UK level the public services industry also showed little growth in 2014, growing by only 1.0%. There were some differences around the countries, however, with England and Northern Ireland growing by 0.7% and 1.7% respectively, Wales decreasing by 0.8%, and Scotland showing relatively strong growth at 4.2%
Figure 6: Industrial variation in total GVA in the UK countries, 2014
Source: Office for National Statistics
Download this chart Figure 6: Industrial variation in total GVA in the UK countries, 2014
Image .csv .xlsFigure 7 shows the industrial composition of total GVA for each NUTS1 region of England in 2014. Looking at the growth between 2013 and 2014:
In 2014 construction was the strongest growing industry in the East of England (13.2%), East Midlands (12.1%), South East (9.7%) and South West (9.4%), and the second strongest in Yorkshire and The Humber (12.5%) behind finance (12.9%).
Agriculture, mining and the utilities (electricity, gas and water) decreased in 2014 in all regions except the East of England and South East, where it grew by 0.8%.
In 2014 the public services industry also showed little growth across most of the regions of England, ranging from -1.4% in the South East to 1.9% in the East Midlands. London was the exception with a slightly stronger annual growth of 3.3%.
Figure 7: Industrial variation in total GVA in English NUTS1 regions, 2014
Source: Office for National Statistics
Download this chart Figure 7: Industrial variation in total GVA in English NUTS1 regions, 2014
Image .csv .xls9. Recent methodological changes
This year has seen a big change to the treatment of household rental income, with three separate changes occurring simultaneously. The first of these is a change in the average house prices used to calculate the regional allocation of imputed rental of owner-occupied dwellings. This change has been necessary because the former data source (provided by the Department for Communities and Local Government) is no longer available. The new data use median house prices from ONS instead of mean house prices, which reduces the impact of the most expensive houses and improves the consistency of estimates over time. The estimates of dwelling stock used have also been changed to build up from Local Authority/Council level data, providing a coherent and consistent framework for use across the Regional Accounts at all NUTS levels. This change has had a considerable impact on GVA estimates for London, Scotland and Northern Ireland in particular.
The second change to household rental income only affects the NUTS2 and NUTS3 areas. Here we have improved the regional allocation of rental income by separating the household sector from other sectors and allocating the household part using housing stock and average house prices (so the change at 1 above also impacts here). This has improved the distribution of rental income at the lower levels of geography, where the housing market was previously regionalised using compensation of employees. This change has had a very wide impact across the NUTS2 and NUTS3 areas.
In keeping with the UK National Accounts commitment to meeting the European Commission definition of Gross National Income and the new European System of Accounts (ESA2010), we have made changes to regional GVA to reflect cross-border income relating to the ownership of second homes, including those in the UK owned by foreign nationals and those owned by UK residents but located in other countries. The activity has two components: property income (import and export), which will feature in the next release of regional Gross Disposable Household Income (GDHI); and housing services (import and export), which features in both regional GVA and GDHI as a part of rental income (the third change to rental income this year). For the regional allocation of second homes we have used data from Council Tax records and the 2001 and 2011 Censuses, with gaps in coverage filled by modelling using overall housing stock. Differences in regional house prices have also been accounted for in the regional indicator for foreign-owned second homes in the UK. No further ESA2010 changes have required a specific regional methods change in the production of these estimates.
All other changes made to the UK National Accounts measure of GVA, to satisfy the requirements of Gross National Income or ESA2010, impact upon the regional GVA estimates in the form of different national totals for the various components of income, even where no explicit changes to the regional allocation have been needed. Of these, changes to the treatment of non-profit institutions serving households (NPISH) (185.9 Kb Pdf) and exhaustiveness (225.9 Kb Pdf) have resulted in the greatest impact on the national figures.
Since the early 1990s adjustments have been applied to GVA estimates for areas of Scotland in order to address a perceived bias in the earnings and employment data that were used to calculate compensation of employees. Following a review and user consultation we have concluded that the data and methods used are now of sufficient quality that the adjustment is no longer needed. The adjustments have been removed from the entire time series and have mostly affected the GVA estimates for the Highlands and Islands and parts of Eastern Scotland.
We have carried out a review of the way we measure the agriculture, forestry and fishing industry (SIC Section A) in regional GVA and have made some changes to improve consistency and coherence with other data sources. The new methods exclusively use data from the Department for Environment, Food and Rural Affairs (Defra) agricultural accounts for the agriculture industry, with other sources (mostly ONS surveys) being used to measure the forestry and fishing industries.
We have made a change to the mining and quarrying industry (SIC Section B) to exclude oil and gas extraction from the Annual Business Survey (ABS) data used to allocate corporate profits to regions. This activity, which mostly belongs in the Extra-Regio category (see background note 1), represents a large part of the mining and quarrying industry as a whole and its presence in the dataset used to allocate the remainder of the industry was causing distortions. These have now been corrected.
Finally, improved data have been used to measure the compensation of employees allocated to armed forces personnel both in the UK and posted overseas, to include Ministry of Defence civilian personnel in support roles. This has resulted in a considerable change to the Extra-Regio estimate for public administration and defence (SIC Section O), and a small corresponding impact on all other regions
10. Future work plans
On 16 December 2015 ONS Regional Accounts will again publish experimental estimates of regional real Gross Value Added, compiled using the production approach (GVA(P)). They are in constant prices, deflated to remove the effect of inflation. ONS delivered real GVA growth rates to Eurostat for the first time in December 2014, three years ahead of schedule. GVA(P) will remain experimental and GVA(I) will continue to be the lead National Statistic. In the longer term (2016-17), a regional GVA balancing project will consider the viability of producing a single balanced measure of regional GVA.
ONS plans to publish estimates of regional Gross Value Added using the income approach (GVA(I)) for 1997 to 2015, in December 2016.
The publication of regional Gross Disposable Household Income (GDHI) estimates, for the period 1997 to 2014, is currently planned for spring 2016.
The Regional Accounts team are always looking for ways to continuously improve the data used in the calculation of regional GVA(I). If you have any comments, suggestions or feedback, please contact regionalaccounts@ons.gov.uk.
11. Domestic use of regional, sub-regional and local GVA estimates
These statistics provide an overview of economic performance at regional and sub-regional level, allowing comparison between the countries and regions of the UK. They provide information about regional economic diversity and the relative importance of different industries to regional economies.
They are used by the UK Government and the Devolved Administrations of Northern Ireland, Scotland and Wales to formulate and monitor economic policy and allocate resources.
These statistics are used in the compilation of business survey statistics in Northern Ireland. They are also used in the production of the Northern Ireland Composite Economic Index (NICEI) – a short-term output measure of the Northern Ireland economy which is used to inform the Economic Strategy and Northern Ireland Budget. The Regional Accounts estimates are also currently used in the development of experimental Supply and Use tables which form a key basis for economic statistics for Northern Ireland.
The Scottish Government uses regional GVA estimates in the production of Supply and Use tables and other related economic statistics, including Quarterly National Accounts Scotland. Regional GVA per head is also used by the Scottish Government to monitor the relative economic performance of countries and regions over time.
Regional GVA estimates are one of the Welsh Government’s eight key indicators in measuring the Welsh economy.
The Department for Business, Innovation and Skills (BIS) uses regional and sub-regional GVA estimates in monitoring regional economic performance.
Local authorities and regional observatories use these statistics to facilitate evidence-based policy making and economic intervention, for example assisting Local Enterprise Partnership (LEP) applications and regional growth funding bids. These figures also provide local authorities with a context for their economic strategies and lobbying activities.
The House of Commons Library produces a standard note about these statistics and they are frequently the subject of parliamentary questions raised by Members of Parliament.
These statistics inform the general public about the state of the economy and provide insight into the relative economic positions of local areas and issues.
The ONS Regional Accounts team also receives general enquiries relating to these estimates from a diverse range of bodies including the Bank of England, other government departments, local authorities, business analysts, consultancy firms, financial institutions, economists, academics and the media (local and national).
Back to table of contents12. European Union use of UK sub-regional GVA estimates
The production of regional GVA is a legal requirement under the European System of Accounts. The sub-regional (NUTS2) estimates are used to inform European Union (EU) structural funding decisions. GDP is calculated in the currencies of the Member States and converted initially into Euros and then into an artificial common currency, called the Purchasing Power Standard (PPS). This makes it possible to compare the purchasing power of different national currencies.
The resulting GDP per inhabitant estimates (expressed in terms of PPS), provide a measure of the total economic activity in a region and may be used to monitor and compare the economic development of regions over time.
The purpose of EU structural funding is to redress regional imbalances, by supporting the development of regional economies. Convergence funding provided by the European Regional Development Fund (ERDF) and the European Social Fund (ESF) is allocated within the current round of funding (covering the period 2014 to 2020), to promote growth-enhancing conditions and factors leading to economic convergence for the least developed EU Member States and regions.
Where the average GDP per inhabitant of a region (in PPS), over an agreed three year period, falls below 75% of the average for the 28 EU Member States (EU-28), full convergence funding is allocated to promote economic development. A transitional element of the current funding process is allocated to regions with GDP per inhabitant between 75% and 90% of the EU-28 average. Under the current allocation, determined in 2012 on the basis of statistics covering the years 2007-2009, the UK receives full convergence assistance for Cornwall and the Isles of Scilly and West Wales and The Valleys, while a further 11 NUTS2 regions receive transitional support.
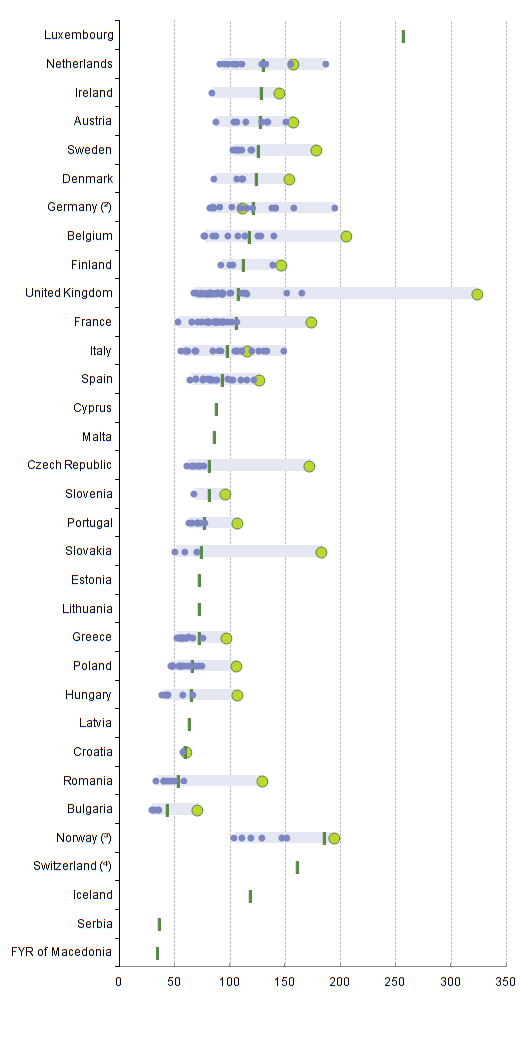
The most recent Eurostat GDP per inhabitant estimates published in May 2015 (expressed in PPS), show the EU-28 average for 2013 at 26,600 PPS, up from 26,500 PPS in 2012. Figure 8 illustrates the variation in the range of GDP per inhabitant (expressed in PPS) within the EU Member States, at NUTS2 level, in 2013. Inner London had the highest GDP per inhabitant (PPS) of the NUTS2 regions within the EU, at 86,400 PPS.
The estimates published by Eurostat were based on the NUTS boundaries implemented in January 2012, so there are differences between these and the regional GVA estimates being discussed in other parts of this Statistical Bulletin.
There were three UK NUTS2 regions under 75% of the EU average in 2013:
Tees Valley and Durham (73%)
Cornwall and Isles of Scilly (70%)
West Wales and The Valleys (67%)
A further 16 UK NUTS2 regions were between 75% and 90% of the EU average.
The allocation of structural funding will be reviewed in 2016, on the basis of statistics for the years 2012 to 2014. This review may affect the funding for 2017 to 2020.
Figure 8 shows the differences across the NUTS2 sub-regions of the EU countries:
the light purple shaded bar shows the range of the highest to lowest region for each country
the dark green bar shows the national average
the green circle shows the capital city region
the dark purple circles show the other NUTS2 regions
The greatest variation in GDP per inhabitant is seen in the UK, however the national average figure is similar to that of the EU average.
Figure 8: Regional disparities in gross domestic product (GDP) per inhabitant, in purchasing power standard (PPS), by NUTS level 2 region, 2013¹
(% of the EU-28 average, EU-28 = 100)

Source: Eurostat
Notes:
- Consistent with the May 2015 Regional GDP Eurostat publication.
- Only available for NUTS level 1 regions.
- Only available at national level.
- 2012.