Table of contents
- Other pages in this release
- Main points
- September 2020 publication date
- The impact of the coronavirus on the public finances
- Government measures to address the impact of the coronavirus pandemic
- Borrowing in July 2020
- Central government net cash requirement
- Debt
- Revisions
- Developments in public sector finance statistics planned for September 2020
- Public sector finances data
- Glossary
- Measuring the data
- Strengths and limitations
- Related links
1. Other pages in this release
Other commentary from the latest public sector finances data can be found on the following pages:
Challenges of measuring the effects of the coronavirus pandemic on tax receipts
Recent and upcoming changes to public sector finance statistics
2. Main points
Debt (public sector net debt excluding public sector banks, PSND ex) has exceeded £2 trillion for the first time; at the end of July 2020, debt was £2,004.0 billion, £227.6 billion more than at the same point last year.
Debt at the end of July 2020 was 100.5% of gross domestic product (GDP), an increase of 20.4 percentage points compared with the same point last year and the first time it has been above 100% since the financial year ending (FYE) March 1961; our monthly GDP estimates for recent periods are based on official projections and are subject to revision.
Borrowing (public sector net borrowing excluding public sector banks, PSNB ex) in July 2020 is estimated to have been £26.7 billion, £28.3 billion more than in July 2019 and the fourth highest borrowing in any month on record (records began in 1993).
Self-assessed Income Tax receipts were £4.8 billion in July 2020, £4.5 billion less than in July 2019, because of the government’s deferral policy; in the light of this policy, it is advisable to look at combined self-assessed Income Tax receipts across the whole financial year when drawing conclusions from year-on-year comparisons.
Borrowing in the first four months of this financial year (April to July 2020) is estimated to have been £150.5 billion, £128.4 billion more than in the same period last year and the highest borrowing in any April to July period on record (records began in 1993), with each of the months from April to July being records.
Borrowing estimates are subject to greater than usual uncertainty; borrowing in June 2020 was revised down by £6.0 billion to £29.5 billion, largely because of stronger than previously estimated tax receipts and National Insurance contributions.
Tax receipts recorded on a national accounts (or accruals) basis are partially based on official forecast data; this month, we have updated our tax estimates to reflect the latest official expectations set out in the Office for Budget Responsibility’s (OBR’s) July 2020 Fiscal sustainability report central scenario monthly profiles – 14 July 2020.
Central government net cash requirement (excluding UK Asset Resolution Ltd, Network Rail and the Covid Corporate Financing Facility) in July 2020 was £25.5 billion, £33.6 billion more than in July 2019 and the highest cash requirement in any July on record (records began in 1984).
Central government net cash requirement in the current financial year-to-date (April to July 2020) was £199.5 billion, £187.2 billion more than in the same period last year and the highest cash requirement in any April to July period on record (records began in 1984).
3. September 2020 publication date
Each September, we take the opportunity to introduce methodology and data changes to public sector finance statistics. These changes can affect estimates of our headline measures of public sector net borrowing excluding public sector banks (PSNB ex), public sector net debt excluding public sector banks (PSND ex) and public sector net financial liabilities excluding public sector banks (PSNFL ex).
Because of the additional quality assurance required in publishing these changes and reflecting the additional pressures faced in compiling the monthly dataset during these unprecedented times, Public sector finances, UK: August 2020, will be released on Friday 25 September 2020, rather than on Tuesday 22 September 2020 as previously announced. Our release calendar was updated in July to reflect this announcement.
Section 10 of this bulletin lists the methodology and data changes to be introduced in our next public sector finances statistical bulletin and presents their expected impact on PSNB ex.
Our regular article Recent and upcoming changes to public sector finance statistics has been updated to include further details of these changes and their estimated impact on further fiscal aggregates.
Back to table of contents4. The impact of the coronavirus on the public finances
The coronavirus (COVID-19) pandemic has had an unprecedented impact on borrowing. Provisional estimates indicate that the £150.5 billion borrowed in the first four months of the current financial year (April to July 2020) was almost three times the £56.6 billion borrowed in the whole of the latest full financial year (April 2019 to March 2020).
These estimates of borrowing on an accrued (or national accounts) basis depend partly on tax receipt forecasts for future months and currently reflect the latest expectations published by the Office For Budget Responsibility (OBR).
Figures published in the OBR’s July 2020 Fiscal sustainability report central scenario monthly profiles – 14 July 2020 (XLS, 121KB) suggest that borrowing in the current financial year (April 2020 to March 2021) could reach £322.0 billion, around six times the amount borrowed in the financial year ending (FYE) March 2020.
Figure 1: Figures published by the Office for Budget Responsibility¹ suggest borrowing could increase to £322.0 billion for the financial year ending March 2021
Public sector net borrowing excluding public sector banks, UK, cumulative financial year-to-date (April to July 2020) compared with official borrowing estimates for the financial year ending March 2021 (April 2020 to March 2021)
Source: Office for National Statistics – Public Sector Finances
Notes:
- This chart uses the OBR July 2020 Fiscal sustainability report central scenario monthly profiles - published 14 July 2020.
Download this chart Figure 1: Figures published by the Office for Budget Responsibility¹ suggest borrowing could increase to £322.0 billion for the financial year ending March 2021
Image .csv .xlsThe extra funding required to support the government’s coronavirus relief schemes combined with reduced cash receipts and a fall in gross domestic product (GDP) has pushed public net debt at the end of July 2020 to 100.5 % of GDP, the highest debt ratio since FYE March 1961.
Figure 2: Debt expressed as a percentage of GDP has reached levels last seen in the early 1960s
Public sector net debt excluding public sector banks, UK, financial year ending March 1921 to July 2020
Source: Office for National Statistics – Public Sector Finances
Notes:
- This chart uses historical data published in the Public finances databank 2020 to 2021.
Download this chart Figure 2: Debt expressed as a percentage of GDP has reached levels last seen in the early 1960s
Image .csv .xlsAlthough the impact of the pandemic on the public finances is becoming clearer, its effects are not fully captured in this release, meaning that estimates of accrued tax receipts (on a national accounts basis), borrowing and GDP in particular are subject to greater than usual uncertainty. Given this uncertainty and consistent with our approach in recent months, we place a greater emphasis than usual on our leading cash measure, the central government net cash requirement (CGNCR), the amount of cash needed immediately for the UK Government to meet its obligations.
Back to table of contents6. Borrowing in July 2020
In July 2020, the public sector spent more money than it received in taxes and other income. Over this period, the public sector borrowed £26.7 billion, £28.3 billion more than it borrowed in July 2019. Borrowing in the month of July tends to be low because of the receipt of self-assessed Income Tax, however the substantial increases in borrowing in recent months reflect the emerging effects of government coronavirus (COVID-19) policies.
Figure 3: Borrowing in the current financial year-to-date is substantially higher than in the same period last year
Public sector net borrowing excluding public sector banks, UK, the current financial year-to-date (April to July 2020) compared with the financial year ending March 2020 (April 2019 to March 2020)
Source: Office for National Statistics – Public sector finances
Download this chart Figure 3: Borrowing in the current financial year-to-date is substantially higher than in the same period last year
Image .csv .xlsEstimates of accrued receipts (on a national accounts basis), expenditure and borrowing for the latest month of every release contain some forecast data. The initial outturn estimates for the early months of the financial year also contain more forecast data than other months, as profiles of tax receipts, along with departmental and local government spending are still provisional. The degree of provisionality has been amplified by the uncertainty of the full impact of the coronavirus, meaning that the data for these months are even more prone to revision than other months and can be subject to sizeable revisions in later months.
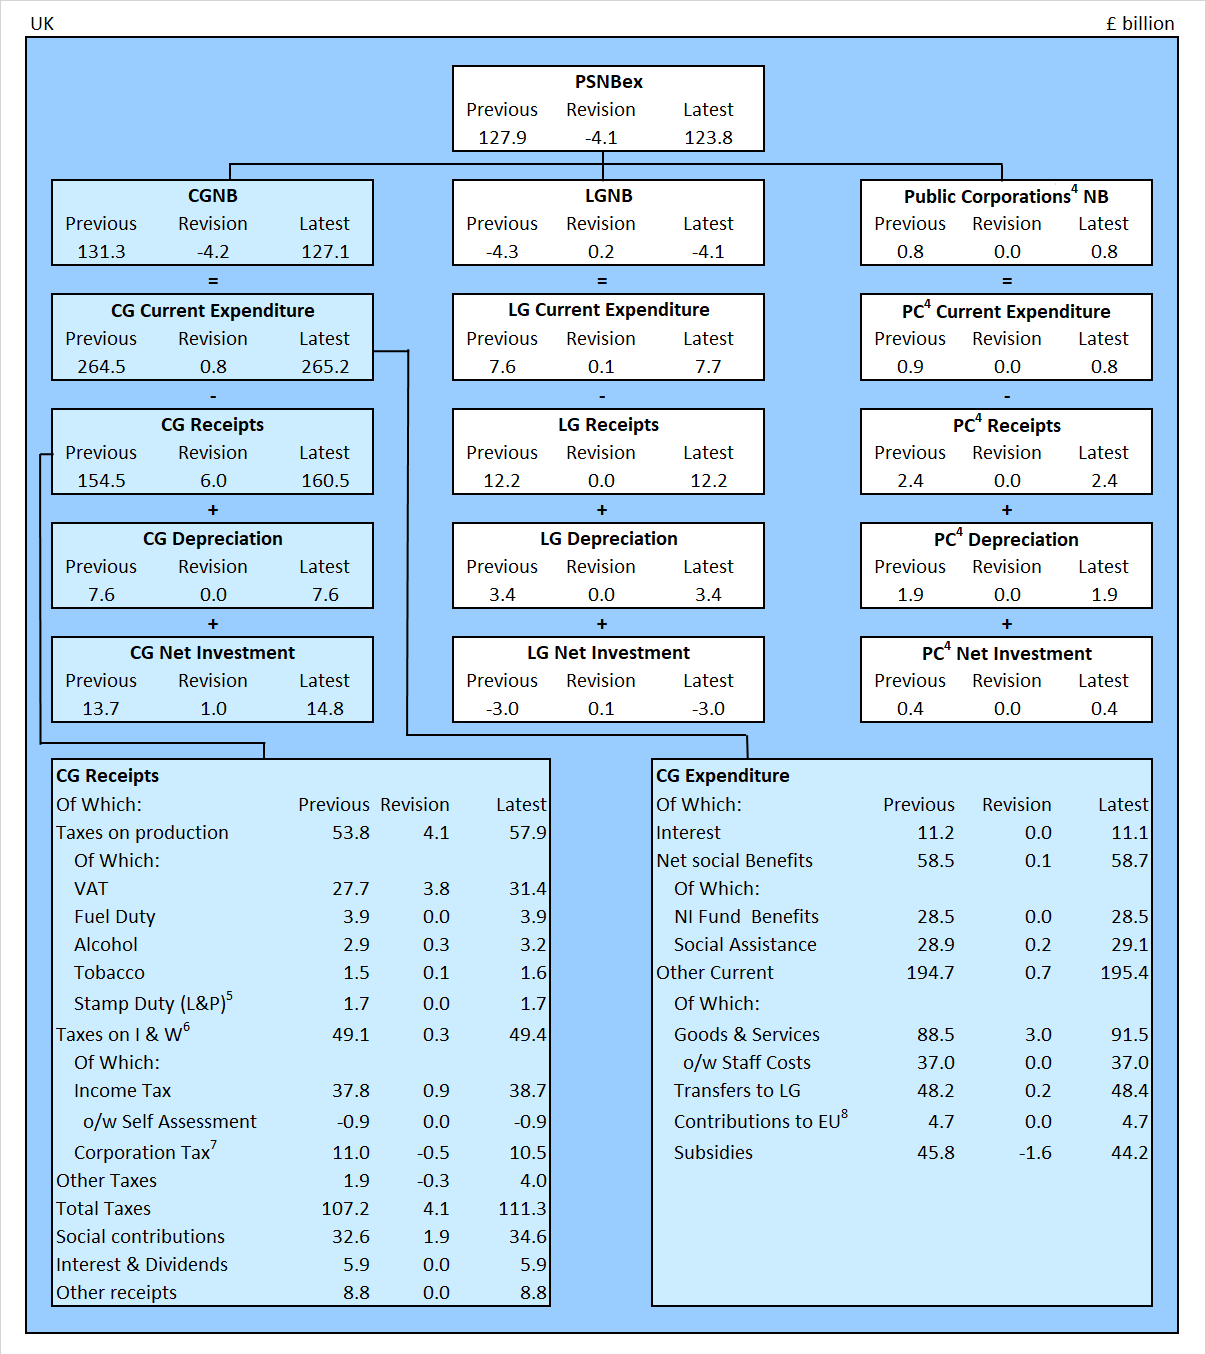
Figure 4 summarises how each of the five sub-sectors (central government, local government, non-financial public corporations, public sector pensions and the Bank of England (BoE)) contribute to the overall growth in monthly borrowing in July 2020 and compares this with the equivalent measures in the same month a year earlier (July 2019).
Figure 4: How each sector contributes to the growth in monthly borrowing
Public sector net borrowing by sub-sector, UK, July 2020, compared with July 2019
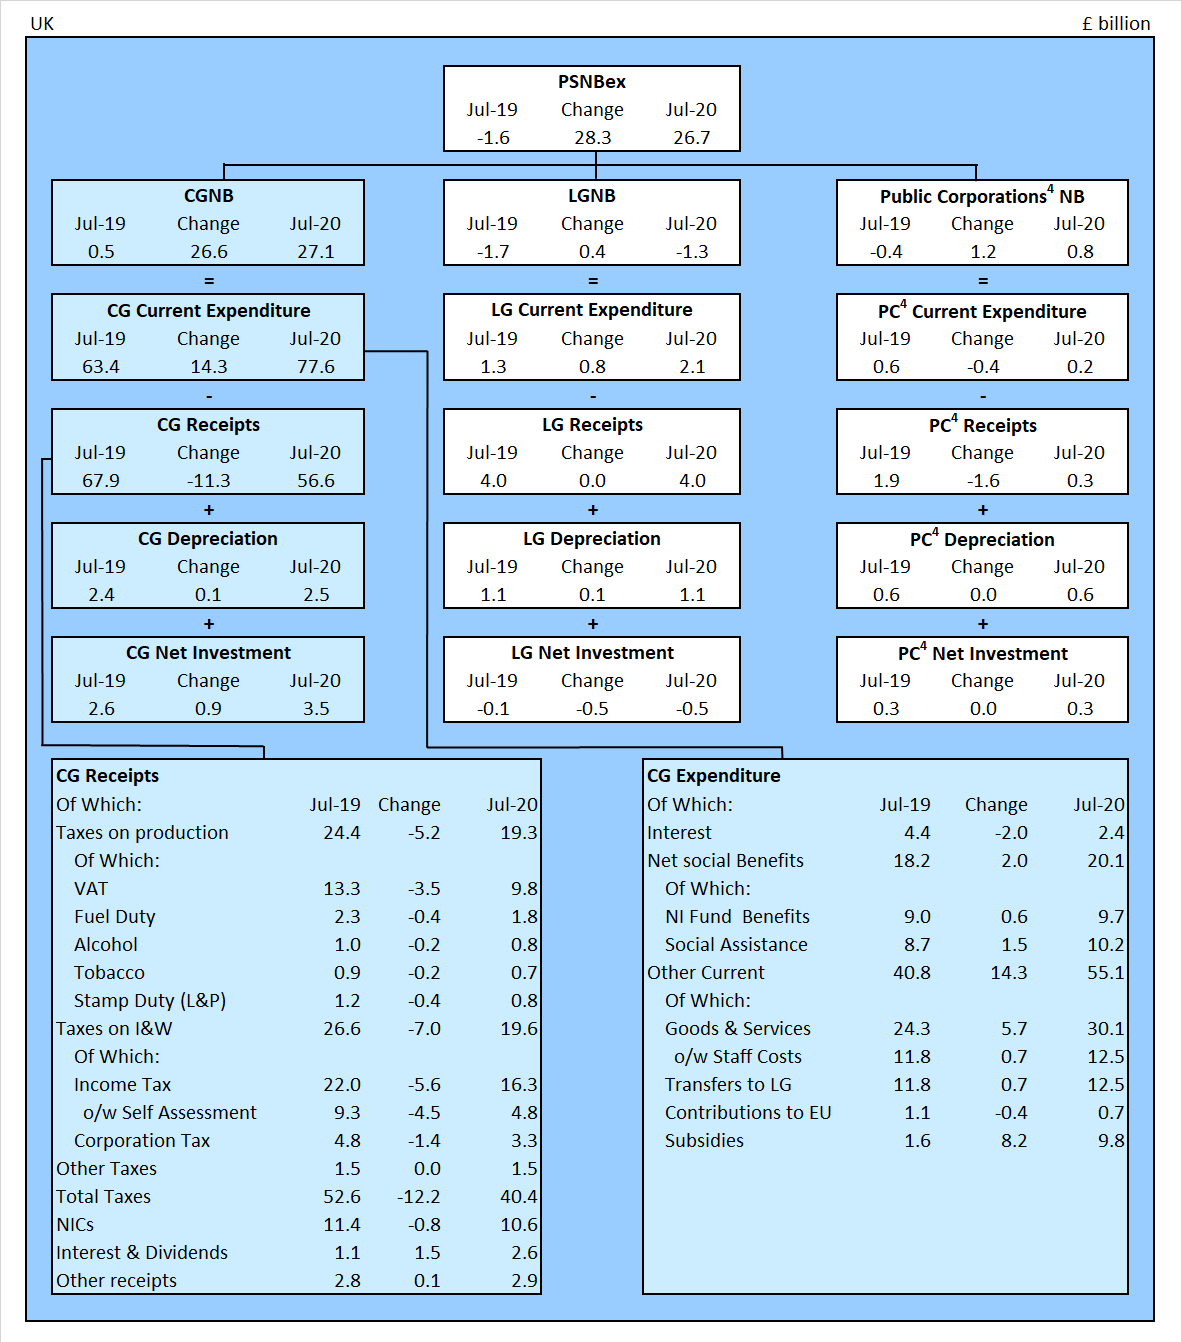
Source: Office for National Statistics – Public sector finances
Notes:
- PSNBex – Public sector net borrowing excluding public sector banks.
- CGNB – Central government net borrowing.
- LGNB – Local government net borrowing.
- Public corporations include public sector pensions, Bank of England, and non-financial public corporations.
- L&P – Land and property.
- I & W – Income and wealth.
- Contributions to EU – UK VAT, GNI and abatement contributions to the EU budget.
- Mainly national insurance contributions (NICs)
- o/w – Of which.
Download this image Figure 4: How each sector contributes to the growth in monthly borrowing
.png (90.5 kB) .xls (84.5 kB)
Central government receipts
In July 2020, central government receipts are estimated to have fallen by 16.7% compared with July 2019 to £56.6 billion, including £40.4 billion in taxes.
This month, tax revenue on a national accounts basis fell by 23.1% compared with July last year, with Value Added Tax (VAT), Corporation Tax and Pay As You Earn (PAYE) Income Tax receipts falling by 26.2%, 29.8% and 6.2% respectively.
These figures are always subject to some uncertainty, as many taxes such as VAT, Corporation Tax and PAYE Income Tax contain some forecast cash receipts data and are liable to revision when actual cash receipts data are received. There is a greater degree of uncertainty at present because the full impact of the coronavirus is unknown.
Figure 5: Central government receipts continue to fall compared with the same period last year
Central government current receipts, UK, the current financial year-to-date (April to July 2020) compared with the financial year ending March 2020 (April 2019 to March 2020)
Source: Office for National Statistics – Public sector finances
Download this chart Figure 5: Central government receipts continue to fall compared with the same period last year
Image .csv .xlsSelf-assessed tax receipts
In July (and January), accrued receipts are usually high owing to receipts from self-assessed taxes. This month self-assessed Income Tax receipts were £4.8 billion, £4.5 billion less than in July 2019, though higher than anticipated given the government’s deferral policy.
On 15 May 2020, the government announced that individuals would have an option to defer their July self-assessment payment to January 2021 because of the coronavirus, without incurring late payment charges, however these latest figures suggest that less self-assessed Income Tax was deferred than initially expected.
In their July 2020 Fiscal sustainability report central scenario monthly profiles – 14 July 2020, the Office for Budget Responsibility (OBR) estimated that only £1.0 billion of self-assessed Income Tax would be collected in July 2020, with a substantial portion deferred to January 2020.
As well as primarily affecting July receipts, the revenue raised through self-assessed taxes also tends to lead to higher receipts in August, although to a lesser degree.
In the light of the government’s deferral policy, it is advisable to look at the combined self-assessed Income Tax receipts across the whole financial year when drawing conclusions from year-on-year comparisons.
Bank of England Asset Purchase Facility Fund
In July 2020, there was a £2.1 billion dividend transfer from the Bank of England Asset Purchase Facility Fund (BEAPFF) to HM Treasury. As with other such transfers, central government net borrowing is reduced by the transfer, while the net borrowing of the Bank of England is increased by an equal and offsetting amount. There is no impact at the public sector level.
Central government expenditure
In July 2020, central government bodies spent £81.1 billion, an increase of 22.9% on July 2019.
Of this, £77.6 billion was spent on its day-to-day activities (often referred to as current expenditure), such as:
- providing services and grants (for example, related to education, defence, and health and social care) – including £7.1 billion of expenditure on the current job furlough schemes: Coronavirus Job Retention Scheme (CJRS) and Self Employment Income Support Scheme (SEISS)
- paying social benefits (such as pensions, unemployment payments, Child Benefit and Statutory Maternity Pay)
- paying interest on the government’s outstanding debt
with the remaining £3.5 billion being spent on capital investment such as infrastructure.
Figure 6: Central government current expenditure continues to rise substantially compared with the same period last year
Central government current expenditure, UK, the current financial year-to-date (April to July 2020) compared with the financial year ending March 2020 (April 2019 to March 2020)
Source: Office for National Statistics – Public sector finances
Download this chart Figure 6: Central government current expenditure continues to rise substantially compared with the same period last year
Image .csv .xlsDepartmental expenditure on goods and services
Departmental expenditure on goods and services in July 2020 increased by £5.7 billion compared with July 2019, including a £4.7 billion increase in the purchase of goods and services and a £0.7 billion increase in expenditure on staff costs.
This increase in pay and procurement partially reflects expenditure by the Department of Health and Social Care (DHSC) to respond to the coronavirus pandemic.
Subsidies paid by central government
In July 2020, subsidies paid by central government include both the Coronavirus Job Retention Scheme (CJRS) and Self Employment Income Support Scheme (SEISS).
These temporary schemes are designed to help employers pay wages and salaries to those employees who would otherwise be made redundant and to support self-employed workers.
In July 2020, central government subsidy expenditure was £9.8 billion, of which £6.9 billion were CJRS payments and £0.2 billion were SEISS payments.
Estimates of CJRS payments on an accrued (or national accounts) basis for the period March to June 2020 are based on HM Revenue and Customs (HMRC) estimates, while those for July 2020 are based on Office for Budget Responsibility projections. SEISS payments are currently recorded on a cash basis, reflecting HMRC’s coronavirus (COVID-19) statistics.
Interest payments on the government’s outstanding debt
Interest payments on the government’s outstanding debt in July 2020 were £2.4 billion, a £2.0 billion decrease compared with July 2019. Changes in debt interest are largely a result of movements in the Retail Prices Index to which index-linked bonds are pegged.
Local government and public corporations data
Both local government and public corporations data for July 2020 are initial estimates, largely based on the OBR’s Coronavirus Reference Scenario (14 July 2020) and Fiscal Sustainability Report (July 2020).
Subsidies paid out to businesses as part of the Coronavirus Small Business Grant Fund, the Coronavirus Retail, Hospitality and Leisure Grant Fund, the Coronavirus Local Authority Discretionary Grants, and similar schemes in devolved administrations, are included based on administrative data published by the Ministry of Housing, Communities and Local Government and by the Scottish and Welsh Governments.
Current and capital transfers between these sub-sectors and central government are based on administrative data supplied by HM Treasury and have no impact at the public sector level.
Borrowing in the current financial year-to-date
In the current financial year-to-date (April to July 2020), the public sector borrowed £150.5 billion, £128.4 billion more than in the same period last year. This unprecedented increase largely reflects the impact of the pandemic on the public finances, with the furlough schemes (CJRS and SEISS) adding £45.2 billion to borrowing alone as subsidies paid by central government to the private sector.
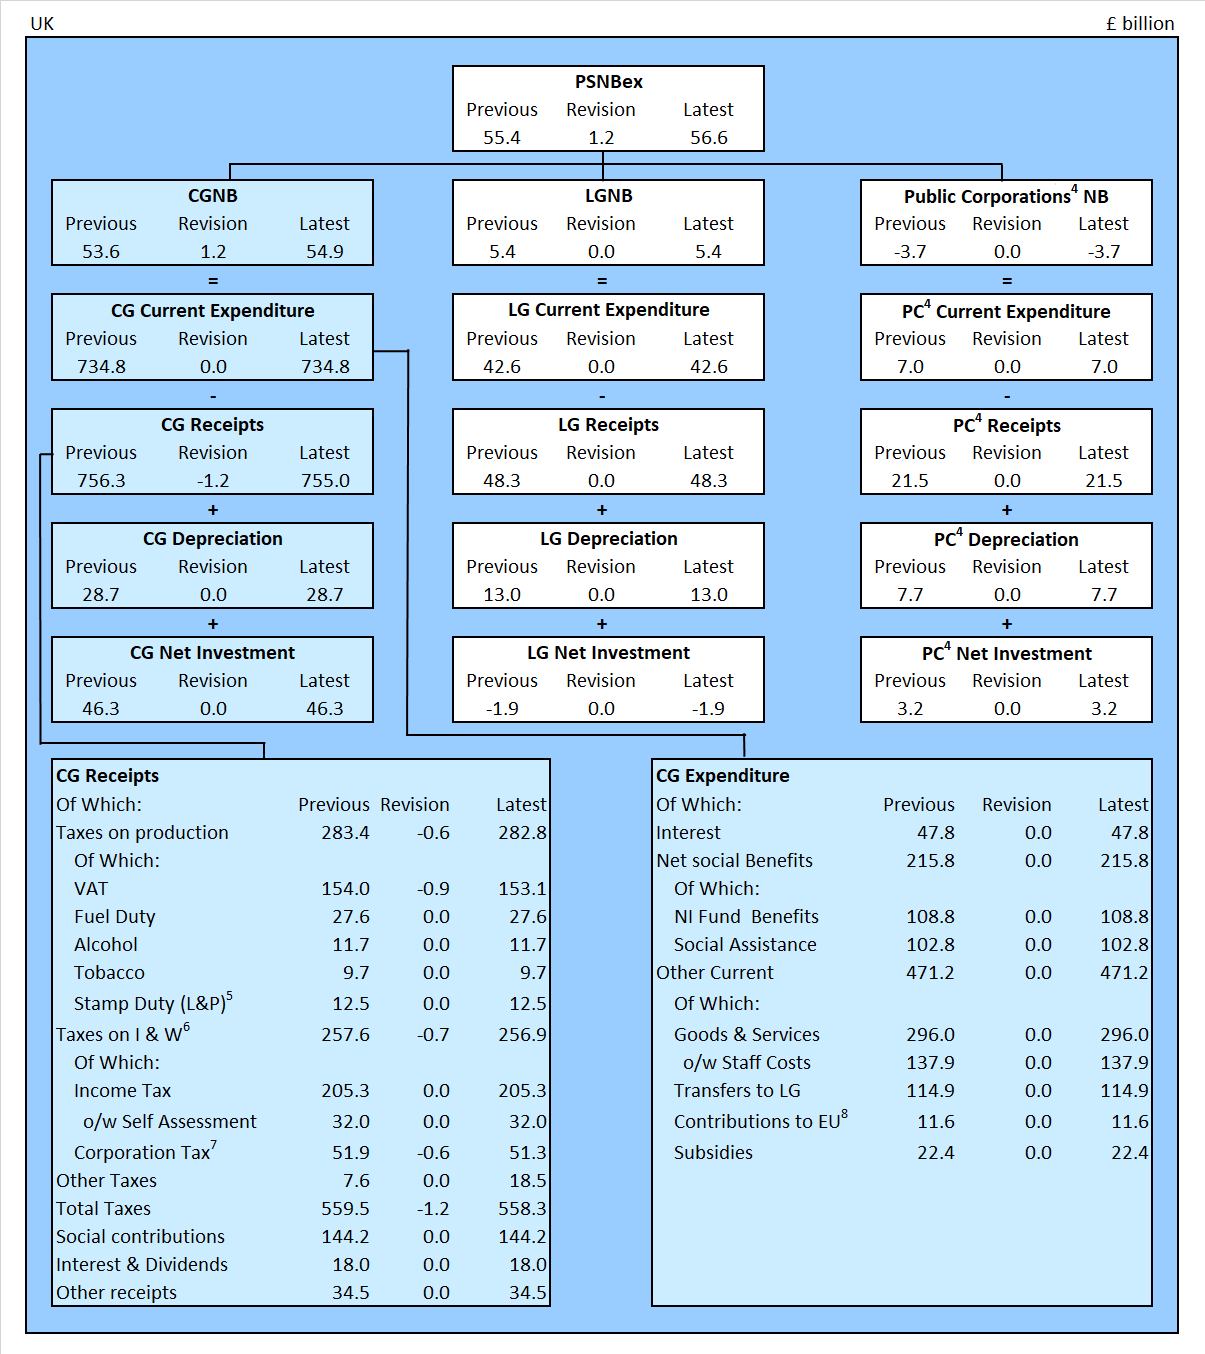
Figure 7 summarises how each of the five sub-sectors (central government, local government, non-financial public corporations, public sector pensions and the Bank of England (BoE)) contribute to the overall growth in monthly public sector net borrowing excluding public sector banks (PSNB ex) in the latest financial year-to-date (April to July 2020) and compares this with the equivalent measures in the same period a year earlier.
Figure 7: How each sector contributes to the growth in borrowing
Public sector net borrowing by sub-sector, UK, current financial year-to-date (April 2020 to July 2020) compared with the same period a year earlier
Source: Office for National Statistics – Public sector finances
Notes:
- PSNBex – Public sector net borrowing excluding public sector banks.
- CGNB – Central government net borrowing.
- LGNB – Local government net borrowing.
- Public corporations include public sector pensions, Bank of England, and non-financial public corporations.
- L&P – Land and property.
- I & W – Income and wealth.
- Contributions to EU – UK VAT, GNI and abatement contributions to the EU budget.
- Mainly national insurance contributions (NICs)
- o/w – Of which.
Download this image Figure 7: How each sector contributes to the growth in borrowing
.png (97.2 kB) .xls (92.7 kB)
Borrowing in the latest full financial year
This month we publish the fifth estimate of borrowing for the full financial year ending (FYE) March 2020. Since the first estimate published on 23 April 2020, we have revised borrowing upwards by £7.9 billion from £48.7 billion to £56.6 billion. This revision reflects the provisional nature of the data under normal circumstances as provisional data estimates are replaced by improved forecasts (and eventually outturn data). More notably this revision reflects updated data being made available as the effects of the coronavirus pandemic on the public finances become clearer.
Borrowing had generally been falling since its peak in FYE March 2010. However, borrowing in the latest full financial year (April 2019 to March 2020) was £16.1 billion more than in the previous financial year, largely because of the impact of the pandemic in March.
Figure 8: Borrowing in the latest financial year was around one-third (35.8%) of the amount borrowed in the financial year ending March 2010
Public sector net borrowing excluding public sector banks, UK, April 1993 to July 2020
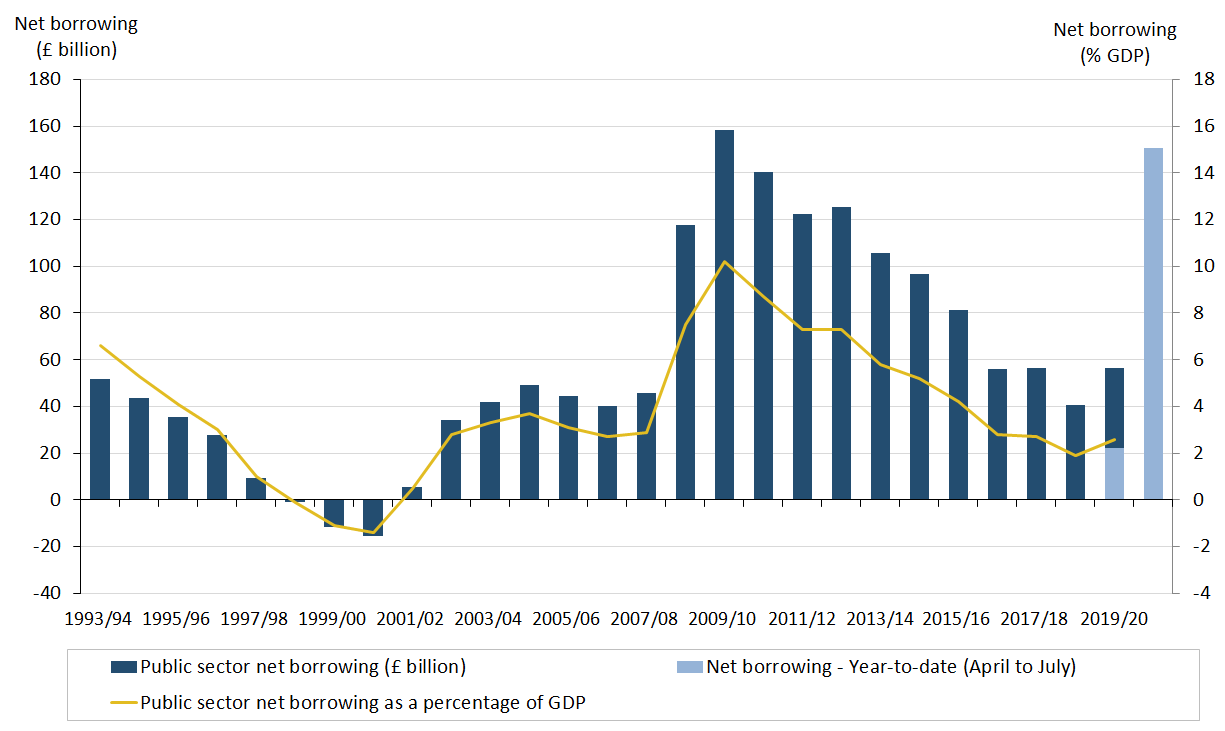
Source: Office for National Statistics – Public sector finances
Notes:
- Financial year 2019 to 2020 represents the FYE 2020 (April 2019 to March 2020).
- Financial year-to-date represents April to July.
Download this image Figure 8: Borrowing in the latest financial year was around one-third (35.8%) of the amount borrowed in the financial year ending March 2010
.png (38.2 kB) .xls (69.1 kB)
7. Central government net cash requirement
The central government net cash requirement excluding UK Asset Resolution Ltd, Network Rail and Covid Corporate Facility Fund (CGNCR ex) is the amount of cash needed immediately for the UK Government to meet its obligations. To obtain cash, the UK Government sells financial instruments, gilts or Treasury Bills.
The amount of cash required will be affected by changes in the timing of tax payments by individuals and businesses but does not depend on forecast tax receipts in the same way as our accrued (or national accounts) based measures.
The CGNCR consequently contains the most timely information and is less susceptible to revision. However, as for any cash measure, the CGNCR does not reflect the overall amount for which government is liable or the point at which any liability is incurred – it only reflects when cash is received and spent.
Table 1 demonstrates how central government’s net cash requirement is calculated from its cash receipts and cash outlays. This presentation focuses on the central government’s own account and excludes cash payments to both local government and public non-financial corporations.
On 20 March 2020, the government introduced a Value Added Tax (VAT) payment deferral policy to support UK business during the coronavirus (COVID-19) pandemic by enabling them to pay Value Added Tax (VAT) due between 20 March 2020 and 30 June 2020 at a later date (though before 31 March 2021). This policy has substantially lowered VAT cash receipts over this four-month period.
On 8 July 2020, the government announced that it would introduce a temporary 5% reduction of VAT rate in certain hospitality sectors from 15 July 2020 to 12 January 2021. This policy change was not included in the most recent Office for Budget Responsibility (OBR) projections. This policy may lower VAT cash receipts over this six-month period, though to what extent is currently unknown.
| July | Financial year-to-date¹³ | |||||||
|---|---|---|---|---|---|---|---|---|
| 2019 | 2020 | Change | % change | 2019/20 | 2020/21 | Change | % change | |
| Total paid over¹ | 65.8 | 50.8 | -15.0 | -22.8 | 204.8 | 141.2 | -63.6 | -31.0 |
| Of which: Income tax² | 22.8 | 18.5 | -4.3 | -19.0 | 67.6 | 57.3 | -10.3 | -15.3 |
| NICs³ | 13.6 | 13.5 | -0.1 | -0.8 | 48.9 | 45.0 | -3.9 | -8.1 |
| VAT⁴ | 13.6 | 10.8 | -2.8 | -20.7 | 45.7 | 10.3 | -35.4 | -77.4 |
| Corporation tax⁵ | 9.6 | 3.0 | -6.6 | -69.2 | 22.3 | 12.3 | -10.0 | -44.8 |
| Interest & dividends | 1.1 | 2.7 | 1.5 | 133.9 | 7.2 | 8.7 | 1.5 | 20.8 |
| Other Receipts⁶ | 3.0 | 4.1 | 1.1 | 37.1 | 7.4 | 5.1 | -2.3 | -31.4 |
| Total cash receipts | 70.0 | 57.6 | -12.4 | -17.7 | 219.5 | 155.0 | -64.4 | -29.4 |
| Interest payments | 4.5 | 4.3 | -0.2 | -3.8 | 11.4 | 21.1 | 9.7 | 85.6 |
| Net acquisition of company securities⁷ | 0.0 | 0.0 | 0.0 | 100.0 | -4.3 | 0.0 | 4.3 | 100.0 |
| Net department outlays⁸ | 57.0 | 78.9 | 21.9 | 38.3 | 222.7 | 333.5 | 110.7 | 49.7 |
| Of which: CJRS⁹ | 0.0 | 7.5 | 7.5 | - | 0.0 | 31.5 | 31.5 | - |
| Of which: SEISS¹⁰ | 0.0 | 0.2 | 0.2 | - | 0.0 | 7.6 | 7.6 | - |
| Total cash outlays | 61.5 | 83.2 | 21.7 | 35.3 | 229.8 | 354.5 | 124.8 | 54.3 |
| Own account NCR¹¹ | -8.5 | 25.6 | 34.1 | 402.8 | 10.3 | 199.5 | 189.2 | 1,833.4 |
| NRAM and B&B | -2.2 | -0.3 | 2.0 | 88.5 | 0.4 | -0.2 | -0.6 | -155.0 |
| Network Rail | 0.0 | 0.0 | 0.0 | 0.0 | -0.2 | -0.2 | 0.0 | 0.0 |
| COVID Corporate Facility Fund | 0.0 | -0.2 | -0.2 | - | 0.0 | 17.4 | 17.4 | - |
| Own account NCR¹² | -10.7 | 25.1 | 35.8 | 333.8 | 10.5 | 216.5 | 206.0 | 1,960.1 |
Download this table Table 1: Central government net cash requirement on own account
.xls .csvOn the same day as we release the public sector finances, HM Revenue and Customs (HMRC) publishes a Summary of HMRC tax receipts, National Insurance contributions (NICs), tax credit expenditure and Child Benefit for the UK containing a detailed list of cash receipts.
Back to table of contents8. Debt
Debt (public sector net debt excluding public sector banks, PSND ex) has exceeded £2 trillion for the first time.
At the end of July 2020, the amount of money owed by the public sector to the private sector was £2,004.0 billion, which equates to 100.5 % of gross domestic product (GDP).
Gilts make up the largest component of debt. At the end of July 2020 there were £1,681.2 billion of central government gilts in circulation (including those held by the Bank of England Asset Purchase Facility Fund). These gilts are auctioned by the Debt Management Office (DMO), on behalf of central government in accordance with its financing remit.
There has been a substantial month-on-month increase in gilts issuance (at nominal value) in the current financial year, partially reflecting the need for extra funding to support the government’s coronavirus relief schemes and to compensate for the fall in tax revenue.
The Bank of England’s contribution to debt
The Bank of England’s (BoE’s) contribution to debt is largely a result of its quantitative easing activities via the Bank of England Asset Purchase Facility Fund (APF), Term Funding Schemes (TFS) and Covid Corporate Financing Facility Fund (CCFF).
If we were to remove the temporary debt impact of these schemes along with the other transactions relating to the normal operations of BoE, PSND ex at the end of July 2020 would reduce by £194.8 billion (or 9.8 percentage points of GDP) to £1,809.3 billion (or 90.7% of GDP).
Figure 9: Debt as a percentage of gross domestic product (GDP) has been falling in recent financial years however the measures introduced to address the coronavirus pandemic have increased this ratio considerably
Public sector net debt excluding public sector banks, UK, March 1994 to the end of July 2020
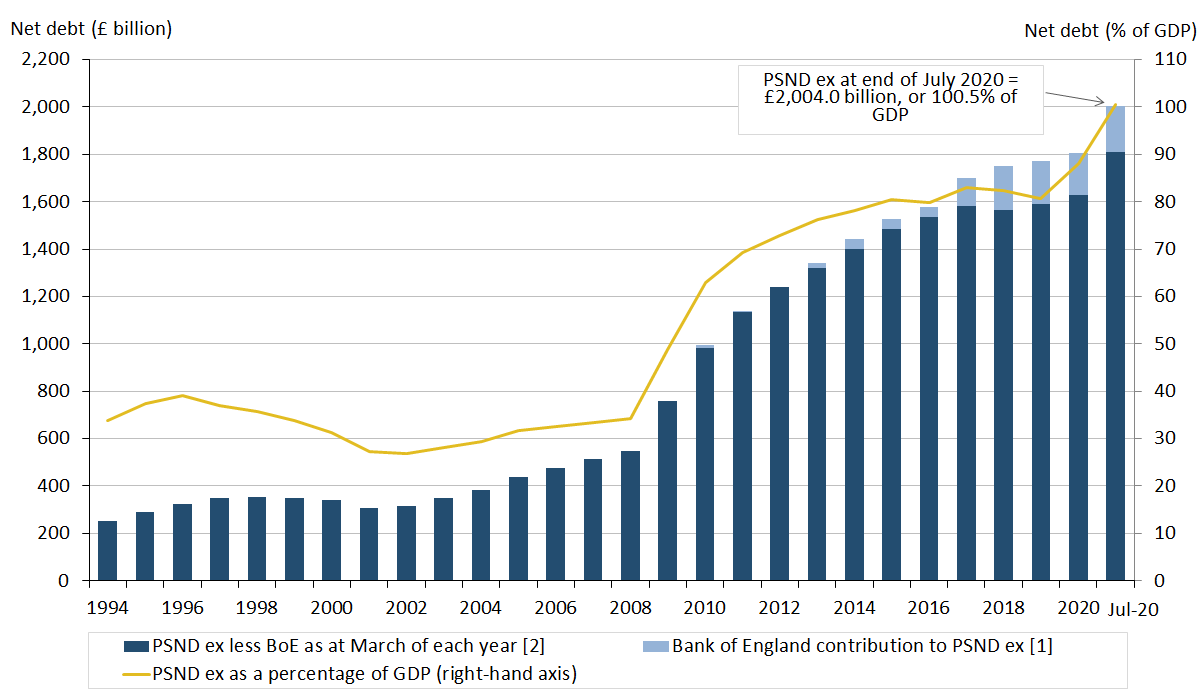
Source: Office for National Statistics – Public Sector Finances
Notes:
- Includes Asset Purchase Facility (APF) which includes the Term Funding Scheme (TFS) and TFS incentives for small and medium-sized enterprises (TFS SME).
- Public sector net debt excluding public sector banks (PSND ex) is the combination of PSND ex Bank of England (BoE) plus the BoE’s contribution to PSND ex.
- Public sector net debt excluding public sector banks (PSND ex) shown at the end of each financial year (March), unless otherwise stated.
Download this image Figure 9: Debt as a percentage of gross domestic product (GDP) has been falling in recent financial years however the measures introduced to address the coronavirus pandemic have increased this ratio considerably
.png (38.2 kB) .xls (74.8 kB)
Bank of England Asset Purchase Facility Fund
In March 2020, the Bank of England (BoE) announced the expansion of its Asset Purchase Facility Fund (APF) by £200 billion to a total of £645 billion. A further expansion of £100 billion was announced by BoE in June 2020, taking the total stock of asset purchases financed by central bank reserves to £745 billion (at nominal value).
At the end of July 2020, the gilt holdings of the APF were £539.2 billion (at nominal value), an increase of £20.4 billion compared with a month earlier. Over the same period, the net gilt issuance by the DMO was £22.8 billion, which implies that gilt holdings by bodies other than the APF have grown by £2.4 billion since June 2020.
As a result of these gilt holdings, the impact of the APF on public sector net debt stands at £115.8 billion, the difference between the nominal value of its gilt holdings and the market value it paid at the time of purchase. The final debt impact of the APF depends on the disposal of the gilts at the end of the scheme.
The estimated impact of the APF’s gilt holdings on public sector net debt currently stands at £98.4 billion, the difference between the nominal value of its gilt holdings and the market value it paid at the time of purchase. In addition to gilts, the APF currently holds £17.4 billion in corporate bonds and engages in many smaller cash transactions that also contribute to debt.
The final debt impact of the APF depends on the disposal of these financial instruments at the end of the scheme.
Term Funding Scheme and Term Funding Scheme with additional incentives for Small and Medium-sized Enterprises
In March 2020, the BoE announced the expansion of its Term Funding Scheme with the introduction of the Term Funding Scheme with additional incentives for Small and Medium-sized Enterprises (TFSME).
In July 2020, an additional £1.6 billion of loans were made under the TFSME scheme, however because of repayments, the total stock of loans under the TFS umbrella reduced by £3.6 billion compared with last month, to £107.3 billion and so adding an equivalent amount to public sector net debt.
If we were to remove the temporary debt impact of APF and TFS, public sector net debt (excluding public sector banks) at the end of July 2020 would reduce by £194.7 billion (or 9.8% percentage points of GDP) to £1,809.3 billion (or 90.7% of GDP).
COVID Corporate Financing Facility Fund
In April 2020, we recorded the Covid Corporate Financing Facility Fund (CCFF) for the first time. The CCFF is a scheme under which the BoE, acting for HM Treasury, buys commercial paper issued by larger, non-financial corporations, to help with their cashflow position. These purchases are financed by a loan to central government from BoE.
At the end of July 2020, the CCFF loan increased the level of central government debt by £17.4 billion, however this loan has an equal but opposite impact on BoE debt and so has no impact at a public sector level.
Our recording of the CCFF remains provisional and based on the information currently available.
Back to table of contents9. Revisions
The data for the latest months of every release contain a degree of forecasts; subsequently these are replaced by improved forecasts as further data are made available and finally outturn.
The coronavirus (COVID-19) pandemic has had an unprecedented impact on both tax receipts and expenditure. These impacts are likely to be revised further as the full effects of the coronavirus on the public finances continue to become clearer.
The revisions presented in this section are largely the result of new tax data received from our data suppliers. Table 2 shows the revisions to the headline statistics presented in this bulletin compared with those presented in the previous bulletin (published on 21 July 2020).
| £ billion¹ (not seasonally adjusted) | |||||||||
|---|---|---|---|---|---|---|---|---|---|
| Net borrowing | |||||||||
| Period | CG² | LG³ | NFPCs⁴ | PSP⁵ | BoE⁶ | PSNB ex⁷ | PSND ex⁸ | PSND % of GDP⁹ | PSNCR ex¹⁰ |
| 2018/19 | -0.1 | 0.0 | 0.0 | 0.0 | 0.0 | -0.1 | 0.0 | 0.0 | 0.0 |
| 2019/20¹¹ | 1.2 | 0.0 | 0.0 | 0.0 | 0.0 | 1.2 | 0.0 | -0.4 | 0.0 |
| 2020/21 YTD¹² | -4.2 | 0.2 | 0.0 | 0.0 | 0.0 | -4.1 | 0.0 | -0.5 | 0.1 |
| 2020 Apr | 0.7 | 1.1 | 0.0 | 0.0 | 0.0 | 1.8 | 0.0 | -0.4 | 0.0 |
| 2020 May | 0.1 | 0.0 | 0.0 | 0.0 | 0.0 | 0.1 | 0.0 | -0.4 | 0.0 |
| 2020 Jun | -5.0 | -1.0 | 0.0 | 0.0 | 0.0 | -6.0 | 0.0 | -0.5 | 0.1 |
Download this table Table 2: Revisions to main aggregates
.xls .csvFigures 10 and 11 show how each element of the public sector contributes to the revisions in borrowing for both the financial year-to-date (April to June 2020) and in the latest full financial year net borrowing.
Public sector net borrowing (excluding public sector banks)
This month, we have reduced our previous estimate of borrowing between April and June 2020 by £4.1 billion, largely because of an increase in the previous estimate of central government tax receipts and National Insurance contributions.
These revisions reflect the uncertainty of the impact of the coronavirus on future cash tax receipts. Further revisions are likely. We have published a short article explaining the Challenges of measuring the effects of the coronavirus pandemic on tax receipts, which we update each month to reflect the latest information.
To estimate borrowing, tax receipts and National Insurance contributions are recorded on an accrued (or national accounts) rather than on a cash receipt basis. In other words, we attempt to record receipts at the point where the liability arose, rather than when the tax is actually paid.
This process means many receipts are provisional for the latest period(s) as they depend on both actual cash payments and on projections of future tax receipts which are “accrued” (or time adjusted) back to the current month(s).
This month, we have updated our tax estimates to reflect the latest official expectations set out in the July 2020 Fiscal sustainability report central scenario monthly profiles – 14 July 2020 for the first time.
Central government
Central government is the largest component of the public sector. Of the £26.7 billion borrowed by the public sector (PSNB ex) in July 2020, £27.1 billion was borrowed by central government, with local government in (borrowing) surplus by £1.3 billion. Because of its size, revisions to central government data tend to be substantially larger than those of the other sub-sectors.
Table 3 shows the revisions to the main components of central government net borrowing presented in this bulletin compared with those presented in the previous bulletin (published on 21 July 2020).
| £ billion (not seasonally adjusted) | |||||
|---|---|---|---|---|---|
| Central government | |||||
| Period | Current Receipts | Current Expenditure | Current Budget Deficit | Net Investment | Net Borrowing |
| 2018/19 | 0.1 | 0.0 | -0.1 | 0.0 | -0.1 |
| 2019/20¹ | -1.2 | 0.0 | 1.2 | 0.0 | 1.2 |
| 2020/21 YTD² | 6.0 | 0.8 | -5.3 | 1.0 | -4.2 |
| 2020 Apr | 0.0 | 0.6 | 0.6 | 0.1 | 0.7 |
| 2020 May | 0.8 | 0.4 | -0.4 | 0.5 | 0.1 |
| 2020 Jun | 5.2 | -0.2 | -5.5 | 0.4 | -5.0 |
Download this table Table 3: Revisions to central government borrowing
.xls .csvCentral government tax receipts and National Insurance contributions for June 2020 have been increased by £3.3 billion and £1.9 billion respectively compared with those published in our previous bulletin (published 21 July 2020). Previous estimates of Value Added Tax (VAT) and Pay As You Earn (PAYE) Income Tax have increased by £2.4 billion and £0.9 billion since our previous publication, both because of updated data.
Alcohol Duty collected in June has increased by £0.3 billion (on a national accounts basis) compared with our previous estimate. A large proportion of this additional revenue relates to repayment of arrears of duty payments (or debt).
Central government current expenditure for June 2020 has decreased by £0.2 billion compared with that published in our previous bulletin (published 21 July 2020), largely because of updated Coronavirus Job Retention Scheme (CJRS) (decreasing by £0.9 billion) and central government procurement data (increasing by £0.6 billion).
We have updated our recording of the expenditure associated with the Coronavirus Job Retention Scheme (CJRS) to reflect the latest profiles. The CJRS expenditure recorded on an accrued (or national accounts) basis is now based on HMRC estimates for the period March to June 2020. As a result of these improvements, CJRS estimates in March, April and June 2020 have reduced by £0.4 billion, £0.7 billion and £0.9 billion respectively, while expenditure in May have increased by £0.1 billion.
Local government
This month we have reduced our previous estimate of local government borrowing in June 2020 by £1.0 billion. Our previous estimates (published 21 July 2020) of the purchase of goods and services by local government have increased by £0.8 billion, while our estimation of subsidies paid has decreased by £1.8 billion as we replace initial estimates with published information for the payment of coronavirus business support grants by local authorities and devolved administrations.
The degree of provisionality in our local government estimates has been amplified by the uncertainty of the full impact of the coronavirus, meaning that the data for these months are even more prone to revision than usual and may be subject to sizeable revisions in later months.
Figure 10: How each element of the public sector contributes to the revision in financial year-to-date (April to June 2020) net borrowing (PSNB ex)
Revisions to borrowing since the previous public sector finances bulletin (published on 21 July 2020), UK
Source: Office for National Statistics – Public sector finances
Notes:
- PSNBex – Public sector net borrowing excluding public sector banks.
- CGNB – Central government net borrowing.
- LGNB – Local government net borrowing.
- Public corporations include public sector pensions, Bank of England, and non-financial public corporations.
- L&P – Land and property.
- I & W – Income and wealth.
- Contributions to EU – UK VAT, GNI and abatement contributions to the EU budget.
- Mainly national insurance contributions (NICs)
- o/w – Of which.
Download this image Figure 10: How each element of the public sector contributes to the revision in financial year-to-date (April to June 2020) net borrowing (PSNB ex)
.png (90.2 kB) .xls (87.0 kB)
Figure 11: How each element of the public sector contributes to the revision in full financial year (April 2019 to March 2020) net borrowing (PSNB ex)
Revisions to borrowing since the previous public sector finances bulletin (published on 21 July 2020), UK
Source: Office for National Statistics – Public sector finances
Notes:
- PSNBex – Public sector net borrowing excluding public sector banks.
- CGNB – Central government net borrowing.
- LGNB – Local government net borrowing.
- Public corporations include public sector pensions, Bank of England, and non-financial public corporations.
- L&P – Land and property.
- I & W – Income and wealth.
- Contributions to EU – UK VAT, GNI and abatement contributions to the EU budget.
- Mainly national insurance contributions (NICs)
- o/w – Of which.
Download this image Figure 11: How each element of the public sector contributes to the revision in full financial year (April 2019 to March 2020) net borrowing (PSNB ex)
.png (90.0 kB) .xls (87.0 kB)
Gross domestic product
Estimates of gross domestic product (GDP) used to present debt and other headline measures are partly based on provisional and official forecast data. This month we have updated our GDP estimate for the second quarter of 2020 (April to June 2020) to reflect the latest published data and in doing so increased our estimate by £9.6 billion compared with our previous estimate based on the Office for Budget responsibility’s (OBR’s) July 2020 Fiscal sustainability report central scenario monthly profiles – 14 July 2020.
As a result of this increase in our GDP estimate, we have reduced our previous estimates of debt as a ratio of GDP from October 2019 to date by between 0.1 (in October 2019) and 0.5 (in June 2020) percentage points compared with those presented in the previous bulletin (published on 21 July 2020) .
Digital Services Tax
Introduced in April 2020, Digital Services Tax (DST) is the charge levied on the profits of businesses that provide social media services, search engines, or online marketplaces to UK users.
Pending a formal classification, in public sector finances we initially recorded DST along with corporation tax as a tax on income and wealth. The Office for National Statistics (ONS) has assessed the classification status of DST and has concluded that it should be recorded as a tax on production.
This month we have updated our recording of DST to reflect this classification. The implementation of this classification decision has no impact on public sector borrowing, debt or net financial liabilities.
Back to table of contents10. Developments in public sector finance statistics planned for September 2020
This section presents information on aspects of data or methodology that are planned for introduction in September 2020. Where available, we have presented our provisional estimates of the expected revisions to public sector net borrowing. These are not final figures and may be improved further before publication on 25 September 2020 as we continue with our quality assurance work.
Reclassification - Pool Re to the central government sub-sector
As previously announced, we have a completed classification assessment of Pool Reinsurance Company Limited (Pool Re) in the context of the internationally agreed statistical rules. We concluded that Pool Re should be classified to the central government sector with effect from 8 March 1993, the date it came into existence.
We estimate that this reclassification will reduce public sector borrowing (PSNB) by up to £0.4 billion in each of the 23 financial years between the financial year ending (FYE) March 1998 and FYE March 2020. Additionally, we expect both public sector net debt (PSND) to reduce by £1.6 billion and public sector net financial liabilities (PSNFL) to reduce by £6.0 billion at the end of March 2020.
Reclassification - London North Eastern Railway and Northern Rail to the central government sub-sector
From 24 June 2018, the government took over the running of East Coast Mainline train services, previously provided by the private sector company trading as Virgin Trains East Coast. This was followed, on 1 March 2020, by the transition of the Northern rail franchise into public ownership.
Having completed classification assessment of these companies in the context of the internationally agreed statistical rules, we have concluded that they should be classified as public non-financial corporations from the point the government took over their running.
This reclassification will have no direct impact on PSNB, PSND and PSNFL.
Reclassification - Home Office immigration charges
In the national accounts and fiscal statistics, government income is categorised by its type; the three main types being taxes, social contributions and fees. In 2019, we examined the statistical classification of visa charges and the Immigration Health Surcharges.
We established that compulsory charges for visas, citizenship and points-based applications (PBS) should be recorded as taxes, while the optional premium service charges are payments for a service (fees). We also determined that the Immigration Health Surcharges should be recorded as a social contribution.
This reclassification only affects the categorisation of revenue within central government but not its total amount and so will have no impact on PSNB, PSND and PSNFL.
Reclassification – Dartford Crossing tolls
We established that Dartford Crossing tolls should be recorded as taxes, and the revenue from fines as current transfers. As with Home Office immigration charges, this reclassification only affects the categorisation of revenue within central government but not its total amount and so will have no impact on PSNB, PSND and PSNFL.
Methodology change – an improvement to the accrued recording of corporation tax credits
HM Revenue and Customs (HMRC) have reviewed the methodology they use in time adjusting corporation tax credits. Previously, all reduced liability tax credits receipts were recorded within an “other tax credits” category and were all time adjusted according to the payment schedule for Slow QIPS (Quarterly Instalment Payments paid between four to six months in arrears). This review enabled HMRC to separate these tax credits into the relevant sectors, enabling them to be time-adjusted according to their actual payment schedule.
We estimate that this improvement will increase PSNB by up to £0.2 billion in each of the 11 financial years between the FYE March 2008 and the FYE March 2018. Data for the most recent two financial years is not yet available.
These improvements have no effect on the underlying cash data and there are no PSND or PSNFL impacts associated with this change.
Data change – funded public sector pensions
In September 2019, we changed the way in which we present funded public employment-related pension schemes in the PSF statistics. This year, we are including new data sources to reflect the composition of the pension schemes' balance sheets more accurately. We are also updating our estimate of the pension liability with the latest available data.
We are still quality assuring our pensions dataset and so estimates of the impact of these changes on PSNB, PSND and PSNFL are only available for the financial year ending March 2019. For this period, we estimate that this update will reduce PSNB by around £1.5 billion, reduce PSND by around £5 billion, and reduce the wider measure PSNFL by around £58 billion.
Data change – student loans
In September 2019, we changed the way in which we record student loans in the PSF statistics. Data underlying this recording is generally available annually, as new outturn and forecasts become available. In September 2020 we will update our previous estimates. Further updates outside of the annual cycle may occur after fiscal events or when new student loan policies are announced.
We estimate that this update will increase PSNB by up to £0.4 billion in each of the four financial years between the FYE March 2015 and the FYE March 2018. Data for the most recent two financial years is not yet available. Over the same period, we expect PSNFL to increase by up to £0.2 billion.
Loan assets are not captured under the measure PSND, therefore any updates to student loans data has no impact on PSND.
Data change – capital consumption
In September 2020, we will be updating our estimates of capital consumption to reflect the inclusion of terminal costs (the costs incurred to prevent environmental problems when production ceases) in central government along with other regular data updates.
Any updates to capital consumption are PSNB neutral, that is, any increase in capital consumption leads to an equivalent increase in current budget deficit and an equal and offsetting reduction in net investment. We estimate that the public sector current budget deficit will increase by up to £1.2 billion in each of the 23 financial years between FYE March 1997 and FYE March 2020, with an equal and offsetting reduction to net investment over the same period.
There is no impact on PSNB, PSND and PSNFL impacts associated with a change to capital consumption.
Data change – Vehicle Excise Duty
Vehicle Excise Duties are paid by both businesses (as taxes on production) and households (as other taxes). Each year we carry out an exercise to update and improve the proportions of duty allocated to each area based on our annual business survey.
There are no on PSNB, PSND and PSNFL impacts associated with this change.
Estimated impacts
Table 4 presents our current estimates of the impact of these and other smaller changes on public sector borrowing (excluding public sector banks). To illustrate the impact, we have applied these to our latest estimate of borrowing (July 2020) for FYEs March 1998 to March 2020.
| £ billion (not seasonally adjusted) unless otherwise stated | |||||||||
|---|---|---|---|---|---|---|---|---|---|
| Current basis | Methods change | New basis | |||||||
| Public sector net borrowing ex | Public sector net borrowing ex as a percentage of GDP | Public sector funded pension schemes¹ | Student loans² | Pool Re | Corporation Tax³ | Capital consumption⁴ | Public sector net borrowing ex | Public sector net borrowing ex as a percentage of GDP | |
| 1997/98 | 9.3 | 1.0 | - | 0.0 | -0.2 | 0.0 | 0.0 | 9.0 | 0.9 |
| 1998/99 | -1.0 | -0.1 | - | 0.0 | -0.1 | 0.0 | 0.0 | -1.2 | -0.1 |
| 1999/00 | -11.4 | -1.1 | - | 0.0 | 0.0 | 0.0 | 0.0 | -11.5 | -1.1 |
| 2000/01 | -15.7 | -1.4 | - | 0.0 | -0.1 | 0.0 | 0.0 | -15.8 | -1.4 |
| 2001/02 | 5.4 | 0.5 | - | 0.0 | -0.1 | 0.0 | 0.0 | 5.3 | 0.5 |
| 2002/03 | 34.1 | 2.8 | - | 0.0 | -0.2 | 0.0 | 0.0 | 34.0 | 2.8 |
| 2003/04 | 41.7 | 3.3 | - | 0.0 | -0.3 | 0.0 | 0.0 | 41.5 | 3.3 |
| 2004/05 | 49.2 | 3.7 | - | 0.0 | -0.3 | 0.0 | 0.0 | 48.8 | 3.7 |
| 2005/06 | 44.3 | 3.1 | - | 0.0 | -0.3 | 0.0 | 0.0 | 43.9 | 3.1 |
| 2006/07 | 40.0 | 2.7 | - | 0.0 | -0.4 | 0.0 | 0.0 | 39.7 | 2.7 |
| 2007/08 | 45.7 | 2.9 | - | 0.0 | -0.4 | 0.0 | 0.0 | 45.3 | 2.9 |
| 2008/09 | 117.9 | 7.5 | - | 0.0 | -0.4 | 0.0 | 0.0 | 117.4 | 7.5 |
| 2009/10 | 158.3 | 10.2 | - | 0.0 | -0.4 | 0.0 | 0.0 | 158.0 | 10.1 |
| 2010/11 | 140.4 | 8.7 | - | 0.0 | -0.4 | 0.0 | 0.0 | 140.1 | 8.6 |
| 2011/12 | 122.2 | 7.3 | - | 0.0 | -0.4 | 0.1 | 0.0 | 121.8 | 7.3 |
| 2012/13 | 125.4 | 7.3 | - | 0.0 | -0.4 | 0.1 | 0.0 | 125.1 | 7.2 |
| 2013/14 | 105.5 | 5.8 | - | 0.0 | -0.4 | 0.1 | 0.0 | 105.2 | 5.8 |
| 2014/15 | 96.9 | 5.2 | - | 0.1 | -0.4 | 0.2 | 0.0 | 96.7 | 5.2 |
| 2015/16 | 81.2 | 4.2 | - | 0.1 | -0.4 | 0.2 | 0.0 | 81.0 | 4.2 |
| 2016/17 | 56.0 | 2.8 | - | 0.3 | -0.3 | 0.2 | 0.0 | 56.1 | 2.8 |
| 2017/18 | 56.5 | 2.7 | - | 0.4 | -0.3 | 0.1 | 0.0 | 56.8 | 2.7 |
| 2018/19 | 40.5 | 1.9 | - | - | -0.3 | - | 0.0 | 40.2 | 1.9 |
| 2019/20 | 56.6 | 2.6 | - | - | -0.4 | - | 0.0 | 56.3 | 2.5 |
Download this table Table 4: Provisional impact of Pool Re and other expected classification, methodology and data changes on public sector net borrowing excluding public sector banks (PSNB ex), UK
.xls .csvOur regular article Recent and upcoming changes to public sector finance statistics has been updated to include further details of the changes. In addition we have published a set of tables, Impact of Pool Re and other classification, methodology and data changes expected to be introduced in September 2020: Appendix J, which presents our provisional estimates of the effect of these changes on our headline public sector measures.
Back to table of contents11. Public sector finances data
Public sector finances borrowing by sub-sector
Dataset | Released 21 August 2020
An extended breakdown of public sector borrowing in a matrix format and estimates of total managed expenditure (TME).
Public sector finances tables 1 to 10: Appendix A
Dataset | Released 21 August 2020
The data underlying the public sector finances statistical bulletin are presented in the tables PSA 1 to 10.
Public sector finances revisions analysis on main fiscal aggregates: Appendix C
Dataset | Released 21 August 2020
Revisions analysis for central government receipts, expenditure, net borrowing and net cash requirement statistics for the UK over the last five years.
Public sector current receipts: Appendix D
Dataset | Released 21 August 2020
A breakdown of UK public sector income by latest month, financial year-to-date and full financial year, with comparisons with the same period in the previous financial year.
International Monetary Fund’s Government Finance Statistics framework in the public sector finances: Appendix E
Dataset | Released 21 August 2020
Presents the balance sheet, statement of operations and statement of other economic flows for public sector compliant with the Government Finance Statistics Manual 2014: GFSM 2014 presentation.
Impact of Pool Re and other classification, methodology and data changes expected to be introduced in September 2020: Appendix J
Dataset | Released 21 August 2020
Presents the provisional impact of our planned classification, methodology and data changes to be introduced in September 2020 on our headline public sector measures.
HMRC tax receipts and National Insurance contributions for the UK
Dataset | Released 21 August 2020
Summary of HM Revenue and Customs tax receipts, National Insurance contributions, tax credit expenditure and Child Benefit for the UK on a cash basis.
All datasets related to this publication are available on our website.
12. Glossary
The public sector
In the UK, the public sector consists of six sub-sectors: central government, local government, public non-financial corporations, public sector pensions, the Bank of England and public financial corporations (or public sector banks).
Public sector current budget deficit
Public sector current budget is the difference between revenue (mainly from taxes) and current expenditure, on an accrued (or national accounts) basis; it is the gap between current expenditure and current receipts (having taken account of depreciation). The current budget is in surplus when receipts are greater than expenditure.
Public sector net investment
Net investment refers to the balance of acquisition less disposals of capital assets and liabilities.
Public sector net borrowing
Public sector net borrowing excluding public sector banks (PSNB ex) measures the gap between revenue raised (current receipts) and total spending (current expenditure plus net investment (capital spending less capital receipts)). Public sector net borrowing (PSNB) is often referred to by commentators as “the deficit”.
Public sector net cash requirement
The public sector net cash requirement (PSNCR) represents the cash needed to be raised from the financial markets over a period of time to finance the government’s activities. This can be close to the deficit for the same period; however, there are some transactions, for example, loans to the private sector, that need to be financed but do not contribute to the deficit. It is also close but not identical to the changes in the level of net debt between two points in time.
Public sector net debt
Public sector net debt excluding public sector banks (PSND ex) represents the amount of money the public sector owes to private sector organisations including overseas institutions, largely as a result of issuing gilts and Treasury Bills, minus the amount of cash and other short-term assets it holds. Public sector net debt (PSND) is often referred to by commentators as “the national debt”.
Debt interest to revenue ratio
The debt interest to revenue ratio (DIR) represents the proportion of net interest paid (gross interest paid less interest received) by the public sector (excluding public sector banks), compared with the non-interest receipts it receives in a given period.
Other important terms commonly used to describe public sector finances are listed in the Public sector finances glossary.
Back to table of contents13. Measuring the data
The Monthly statistics on the public sector finances: a methodological guide provides comprehensive contextual and methodological information concerning the monthly public sector finances statistical bulletin. The guide sets out the conceptual and fiscal policy context for the bulletin, identifies the main fiscal measures, and explains how these are derived and interrelated. Additionally, it details the data sources used to compile the monthly estimates of the fiscal position.
More quality and methodology information on strengths, limitations, appropriate uses, and how the data were created is available in the Public sector finances QMI.
The possible impact of the coronavirus on our publishing timetable
The coronavirus (COVID-19) pandemic presents a significant challenge. We are working hard to ensure the UK Government has the vital information needed to respond to the impact of this pandemic on our economy and society. But, inevitably, the disruption caused by the pandemic means we may need a little extra time to quality assure some of our data before publication.
We will review our publication dates and announce any future short delays in due course. We have released a public statement on COVID-19 and the production of statistics.
Comparisons with official forecasts
The independent Office for Budget Responsibility (OBR) is responsible for the production of official forecasts for the government. These forecasts are usually produced twice a year, in spring and autumn.
The most recent official forecasts, presented in the OBR’s Supplementary forecast (13 March 2020) were made before the full effects of the pandemic were apparent.
On 14 April 2020, OBR published an illustrative three-month lockdown scenario that assessed the potential impact of the coronavirus on the economy and public finances.
On 14 July 2020 they updated this analysis, presenting three scenarios in the Fiscal sustainability report. These reflected the economic and fiscal data up to 19 June 2020 and policy announcements up to 26 June 2020. In the Fiscal sustainability report, OBR explored three economic scenarios:
- Upside scenario: in effect an updated April reference scenario, with a sharp rebound in activity and no medium-term economic scarring
- Central scenario: activity recovers more slowly and incorporates some scarring to potential GDP
- Downside scenario: recovery is slower still and scarring is deeper
The expectations of future tax receipts and GDP used in this bulletin reflect those published OBR’s July 2020 Fiscal sustainability report central scenario monthly profiles – 14 July 2020.
Table 5 compares the headline public sector finance fiscal aggregates with the expectations published in OBR’s latest expectations.
| £ billion unless otherwise stated (not seasonally adjusted) | |||||||
|---|---|---|---|---|---|---|---|
| July | Financial year-to-date | ||||||
| Outturn July 2020 | OBR Scenario July 2020³ | Difference | Outturn year-to- date | OBR Scenario year-to- date³ | Difference | OBR Scenario full financial year 2020/21³ | |
| CG¹ Receipts | 56.6 | 52.3 | 4.3 | 217.1 | 200.9 | 16.2 | 673.9 |
| CG Current Expenditure | 77.6 | 77.8 | -0.2 | 342.9 | 361.2 | -18.3 | 907.7 |
| CG Current Budget Deficit | 23.6 | 25.5 | -1.9 | 135.9 | 160.3 | -24.4 | 233.8 |
| CG Net Investment | 3.5 | 5.6 | -2.1 | 18.3 | 28.2 | -9.9 | 73.1 |
| CG Net Borrowing | 27.1 | 31.0 | -3.9 | 154.2 | 188.6 | -34.4 | 306.9 |
| PS² Net Borrowing | 26.7 | 28.6 | -1.9 | 150.5 | 178.8 | -28.3 | 322.0 |
| PS Net Debt¹ | 2,004.0 | 2,044.1 | -40.1 | 2,004.0 | 2,044.1 | -40.1 | 2,205.0 |
| PS Net Debt¹ % of GDP | 100.5 | 103.1 | -2.6 | 100.5 | 103.1 | -2.6 | 104.1 |
Download this table Table 5: How the latest outturn public sector figures compare to official OBR forecasts for the financial year ending March 2020 and for the month July 2020, UK
.xls .csvGross domestic product (GDP)
Estimates of gross domestic product (GDP) used to present debt and other headline measures are partly based on provisional and official forecast data.
July 2020 requires data across five quarters of GDP. Of these, two are based on Office for National Statistics (ONS) published data and three are based on official estimates published by OBR:
- data up to and including the first quarter of 2020 (January to March 2020) are based on the published GDP quarterly national accounts, UK: January to March 2020
- the GDP for in the second quarter of 2020 (Apr to June 2020) are based on the published GDP first quarterly estimate, UK: April to June 2020
- estimates of GDP for the subsequent three quarters (July 2020 to March 2021) are based on expectations published in the Office for Budget responsibility’s (OBR’s) July 2020 Fiscal sustainability report central scenario monthly profiles – 14 July 2020.
On 6 May 2020, we published Coronavirus and the effects on UK GDP, which explains how the global pandemic and the wider containment efforts are expected to impact on UK GDP as well as some of the challenges that National Statistical Institutes (NSIs) are currently facing.
Departure from the EU
As the UK leaves the European Union (EU), it is important that our statistics continue to be of high quality and are internationally comparable. During the transition period, those UK statistics that align with EU practice and rules will continue to do so in the same way as before 31 January 2020.
These statistics, and our sector classification process, draw on the European System of Accounts (ESA) 2010, the Manual on Government Deficit and Debt, and associated guides.
After the transition period, we will continue to produce our public sector finance statistics in line with the UK Statistics Authority’s Code of Practice for Statistics and in accordance with internationally agreed statistical guidance and standards.
To ensure comparability with other countries, the statistical aggregates within the Public sector finances release will continue to be produced according to the existing definitions and standards until further notice or those standards are updated.
Back to table of contents14. Strengths and limitations
National Statistics status for public sector finances
On 20 June 2017, the UK Statistics Authority published a letter confirming the designation of the monthly Public Sector Finances bulletin as a National Statistic. This letter completes the 2015 assessment of public sector finances.
Local government
Local government data for the financial year ending (FYE) March 2020 are mainly based on budget data for England, Wales and Scotland, and estimates for Northern Ireland.
In recent years, planned expenditure initially reported in local authority budgets has been systematically higher than the final outturn expenditure reported in the audited accounts. We therefore include adjustments to reduce the amounts reported at the budget stage.
For FYE March 2020, we include a £2.0 billion downward adjustment to England’s current expenditure on goods and services, along with £0.7 billion, £0.6 billion and £0.2 billion adjustments to Scotland’s, England’s and Wales’ capital expenditure respectively. We apply a further £3.0 billion downward adjustment to current expenditure on benefits in FYE March 2020, to reflect the most recently available data for housing benefits. Further information on these and additional adjustments can be found in the Public sector finances QMI.
Local government data for FYE March 2021 are initial estimates, based on the Office for Budget Responsibility (OBR) forecasts. We have reflected our estimation of impact of the coronavirus (COVID-19) in these data.
Current and capital transfers between local and central government are based on administrative data supplied by HM Treasury.
Non-financial public corporations
Public corporations data for FYE March 2021 are initial estimates, based on OBR forecasts. Current and capital transfers between public corporations and central government are based on administrative data supplied by HM Treasury.
Public sector funded pensions
Pensions data for the March 2020 and 2021 are our estimates based on the latest available data. Some of these estimates rely on actuarial modelling; this is a complex process that most public sector schemes conduct every three to four years. Until such valuations become available, we forecast the change in pension liability using our knowledge of the economic climate. Pensions in the public sector finances: a methodological guide outlines both the theory and practice behind our calculation of pension scheme estimates.
Public sector banks
Unless otherwise stated, the figures quoted in this bulletin exclude public sector banks (that is, currently only Royal Bank of Scotland, RBS). The reported position of debt, and to a lesser extent borrowing, would be distorted by the inclusion of RBS’ balance sheet (and transactions). This is because the government does not need to borrow to fund the debt of RBS, nor would surpluses achieved by RBS be passed on to the government, other than through any dividends paid as a result of the government equity holdings.
Back to table of contents