1. Introduction
This publication contains estimates of public service healthcare productivity in the UK on a calendar year basis, along with analysis and brief guidance on the methods used and how to interpret the statistics. This release also includes a separate article analysing trends in public service healthcare productivity in England on a financial year basis and the annual statistical bulletin on total UK public service productivity estimates:
Back to table of contents2. Main points
Productivity grew by 2.5% in 2016, representing a return to the higher than average productivity growth observed between 2010 and 2014 after productivity experienced no change in 2015.
The average annual growth rate of UK public service healthcare productivity from 1995 to 2016 was 0.9% per year, as average annual output growth of 4.6% exceeded average annual input growth of 3.7%.
Output growth of 3.5% in 2016 was slower than the previous year, largely due to considerably slower growth in care purchased from non-NHS providers.
Inputs growth was 1.0% in 2016, slower than the previous year due to several elements of goods and services inputs, including purchases of care from non-NHS providers.
The quality adjustment added 0.2 percentage points to output growth in 2016, lower than the average quality growth, since its introduction in 2001, of 0.5 percentage points.
Non-quality adjusted productivity grew by 2.3% in 2016, in contrast with average annual non-quality adjusted productivity growth of 0.6% between 1995 and 2016.
3. Things you need to know about this release
This article introduces the concepts of productivity, gives an overview of the trends in UK public service healthcare productivity between 1995 and 2016, and provides more detail on composition of the output and input measures used in calculating productivity1.
Public service healthcare productivity is estimated by comparing growth in the total quantity of healthcare output provided (adjusted for quality) with growth in the total quantity of inputs used. If the growth rate of output exceeds the growth rate of inputs, productivity increases, meaning that more output is being produced for each unit of input. Conversely, if the growth rate of inputs exceeds the growth rate of output, then productivity will fall, indicating that less output is being produced for each unit of input.
Whilst these productivity estimates provide a measure of the amount of output that is produced for each unit of input, they do not measure value for money or the wider performance of public healthcare services. They do not indicate, for example, whether the inputs have been purchased at the lowest possible cost, or whether the desired outcomes are achieved through the output provided.
Healthcare output is the quantity of healthcare provided adjusted for the quality of delivery. The quantity of output is measured using the number of individual healthcare activities performed, weighted by the cost of each activity and can also be described as volume output. The quality of delivery is measured using a combination of indicators detailed in Section 7.
It should be noted that while the output data are also shared with the UK National Accounts, differences will arise from Office for National Statistics (ONS) public service productivity estimates operating an open revisions policy. This means that new data or improved methods can be incorporated with each release of the public service productivity articles and can be implemented for the entire time series of data. Revisions that have been made to this data will be incorporated in the UK National Accounts in the 2019 Blue Book.
Healthcare inputs are the resources available to produce healthcare services and are also measured on a quantity basis. Inputs comprise labour, goods and services, and consumption of fixed capital. The quantity, or volume, basis is used for measuring healthcare inputs to prevent inflation in input costs showing up as an apparent increase in the input resources available to the health service.
Further information on methods, including information about data used for the different constituent countries of the UK and how these are aggregated to form a UK index, is available in our sources and methods paper (PDF, 328.65KB).
These estimates form part of Public service productivity, total: 2016, which also provides details of productivity in other public service sectors.
Notes for: Things you need to know about this release
- Productivity estimates included in this article are multi-factor productivity estimates as opposed to labour productivity estimates, as they also include goods and services, and capital inputs, in addition to labour input. However, the public service productivity measures included in this article are not comparable with Office for National Statistics (ONS) market sector multi-factor productivity estimates due to differences in the definitions used. For more information on these differences, see the article on Comparing public service productivity estimates with other productivity estimates (PDF, 433KB).
4. Public service healthcare productivity overview
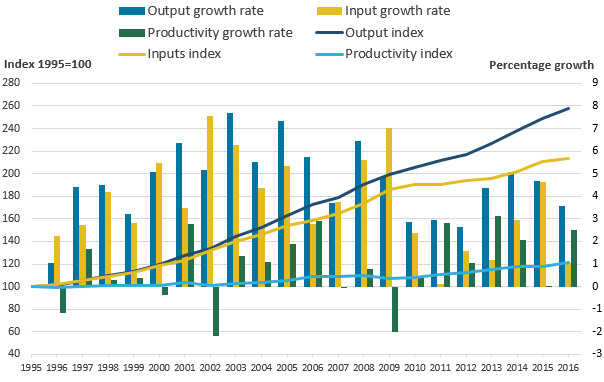
Figure 1a shows changes in the growth rate and trend of public service healthcare productivity over time, while Figure 1b shows how the productivity growth rate has been driven by changes in inputs and output. In these charts, annual growth rates are shown as bars (measured against the right axis) while the cumulative changes in each series since 1995 are shown by the lines (measured against the left axis and indexed to a level of 100 in 1995).
Figure 1a: Public service healthcare productivity index and growth rate
UK, 1995 to 2016
Source: Office for National Statistics
Download this chart Figure 1a: Public service healthcare productivity index and growth rate
Image .csv .xls
Figure 1b: Public service healthcare output, inputs and productivity indices and growth rates
UK, 1995 to 2016
Source: Office for National Statistics
Download this image Figure 1b: Public service healthcare output, inputs and productivity indices and growth rates
.PNG (34.6 kB) .xlsx (12.4 kB)
Figure 1a shows that public service healthcare productivity rose by 2.5% in 20161. Decomposing this productivity increase into changes in inputs and output, Figure 1b shows this productivity increase was caused by output growing at 3.5%, while inputs grew at a lower rate of 1.0%2.
Following a year of zero productivity change in 2015, productivity growth in 2016 saw a return to the trend observed between 2010 and 2014 of productivity growth faster than the average for the series. Inputs growth of 1.0% in 2016 was also markedly different from that observed the previous year (4.6%) and reflects a return to the lower than average inputs growth observed between 2009 and 2014.
Notes for: Public service healthcare productivity overview
Growth rates for a single year are given as the growth between the stated year and previous year. For example, the growth figure for 2016 is the growth measured between 2015 and 2016. Growth rates for a period of more than one year are given as the growth between the first and the last year in that period. For example, growth between 2014 and 2016 represents growth between the level of a series in 2014 and its level in 2016.
While productivity growth is calculated using the difference between output and input growth, productivity growth is calculated using unrounded data and therefore the productivity growth figures in this article may differ from figures calculated using rounded output and input growth rates.
5. Inputs
Inputs in the public service healthcare productivity measure are broken down into three components:
labour – such as hospital consultants, registrars, nurses, technical staff, ambulance staff, support staff, general practitioners (GPs) and GP practice staff
goods and services – this includes the intermediate consumption of equipment used by healthcare providers, such as gloves and syringes; this component also includes GP-prescribed drugs, services provided by non-NHS organisations and agency staff costs
capital consumption – this is the consumption of fixed capital and covers the cost of depreciation of capital goods (items that are anticipated to be in use over several years, such as buildings and vehicles) over time
Estimates of labour inputs are based on direct measurement of the change in the number of full-time equivalent employees of the health service, weighted by their average earnings. Inputs for goods and services are estimated indirectly, by adjusting expenditure for each sub-component using appropriate measures of inflation, known as deflators. This removes the effects of price changes from current price expenditure and so produces a quantity input measure. Capital consumption is measured using the perpetual inventory method, as used in the UK National Accounts.
To produce the total inputs index, the growth rates of the three input components are weighted by their share of total expenditure and then combined. Goods and services inputs and labour inputs account for the largest shares of input expenditure and therefore have a greater weight and a greater effect on the overall inputs index than capital consumption, which accounts for only a small share of expenditure.
Figure 2a shows the growth rate for the two main inputs components before it is weighted by expenditure share. Figure 2b presents this information after weighting, showing how growth in each component contributes to the growth in overall inputs. These charts show that the rate of growth of total inputs slowed distinctly in 2016, growing at a rate of 1.0%, down from 4.6% the previous year.
Figure 2a: Public service healthcare inputs quantity growth by component
UK, 1996 to 2016
Source: Office for National Statistics
Notes:
- Capital consumption growth was not included in Figure 2a, due to its small expenditure weight, and therefore small impact on total inputs (see Figure 2b).
Download this chart Figure 2a: Public service healthcare inputs quantity growth by component
Image .csv .xls
Figure 2b: Contributions to public service healthcare inputs growth by component
UK, 1996 to 2016
Source: Office for National Statistics
Download this chart Figure 2b: Contributions to public service healthcare inputs growth by component
Image .csv .xlsThe slower growth in inputs in 2016 relative to 2015 was driven primarily by much slower growth in goods and services inputs.
The slower growth in goods and services inputs had four main causes:
slower growth in purchases of care from non-NHS providers
a fall in agency staff expenditure
slower growth in the intermediate consumption expenditure of NHS providers
stronger inflation in NHS input costs, which reduces the volume of inputs that can be purchased with any given amount of expenditure
Analysing these four causes in turn; firstly, growth in purchases of care from non-NHS providers slowed markedly in 2016 to 7.3%, following exceptionally strong growth in 2015 of 18.1%. As a lack of activity data for non-NHS services prevents the construction of direct measures of output, output for non-NHS services is estimated to be equal to inputs. Therefore, slower growth in non-NHS services in inputs will have an equivalent effect on output and this component will have minimal impact on the change in productivity in any given year.
Secondly, agency staff inputs, which are included in the goods and service input component, fell in 2016, following four consecutive years of rises. Agency staff inputs are measured using expenditure on agency staff deflated by a general healthcare labour deflator, and as a result are an estimate for agency staff volumes only. This fall follows the introduction of a cost-per-hour cap on agency staff introduced in the English NHS in November 2015 and extended to all staff categories in April 2016, although the lack of specific agency staff wage or cost data makes it difficult to determine if the cap was the cause of agency staff expenditure falling or there was also a fall in the number of agency staff used.
Thirdly, there was a slowdown in the growth in NHS intermediate consumption expenditure, the largest component of goods and services inputs. This category includes clinical supplies and services, which fell in England in the final year of the series.
Finally, inputs growth was further reduced by a faster rate of inflation for goods and services consumed by NHS providers. This inflation rate, measured using the Health Service Cost Index1 (HSCI), increased to 2.6% in financial year ending (FYE) 2017, up from negative 0.1% in FYE 2016. The 2.6% inflation rate for FYE 2017 was the highest since FYE 2012. This faster rate of input cost inflation results in the volume of goods and services inputs growing more slowly than current price expenditure on goods and services, as the purchasing power of each pound of spending declines.
Faster inflation in 2016 than 2015 was also seen in inflation measures produced by Office for National Statistics (ONS) for the general economy, such as the consumer price index and GDP deflator. However, the increase in inflation between the two years in the HSCI was slightly greater than the increase in these general inflation measures.
Input growth was further reduced by a fall in capital consumption, although as shown in Figure 2b the impact of changes in capital consumption on the measure is small.
However, overall input growth remained positive due to an increase in labour inputs, which grew by 1.6% in 2016, a similar rate to the previous two years, driven by an increase in a range of staff groups, including consultants. It should be noted that the labour data that we use do not include bank staff, who work flexible hours and are typically used as an alternative to agency staff contracted from private staffing agencies. Therefore, it is possible that the combination of the aforementioned agency staff pay cap and an NHS Professionals campaign, launched in 2016, to encourage nurses to join staff banks, may have increased total staff inputs by more than the data used in this series can measure.
The overall input growth in 2016 was in line with the period between 2010 and 2013, the only other part in the time series where inputs growth was comparably low. However, the causes of low input growth were different between 2010 and 2013, when slow input growth was attributable to small falls in labour input of an average of 0.5% per year. Goods and services input growth also slowed during the period between 2010 and 2013, but at an average rate of 3.0%, remained substantially higher than the 0.7% growth for 2016.
Notes for: Inputs
- The Health Service Cost Index (HSCI) was published by the Department of Health until 2017 and measures inflation in a basket of goods and services used in the health service. Caution should be taken in interpreting this index as a specific inflation rate for the NHS, as much of the price data are drawn from the general retail prices of goods and services used in the NHS, as opposed to the specific prices paid by NHS organisations. In addition, the index used in the inputs calculations differs from the overall published index, as we use a modified version of the index, which excludes elements that are considered to be capital inputs. Capital consumption inputs are calculated in volume terms in the national accounts and these volume data are used as inputs. As part of the direct calculation of capital consumption in volume terms in the national accounts, the same deflators used for gross fixed capital formation are used.
6. Output quantity
Healthcare output is measured as the quantity of healthcare delivered adjusted for changes in the quality of delivery. The quantity measure of output is estimated using a cost-weighted activity index and can alternatively be described as volume output. To produce the cost-weighted activity index, the growth rates for thousands of individual healthcare activities are calculated and then weighted by their proportion of total expenditure. As a result, growth in treatments that are high-volume and expensive has a greater effect on the output index than a similar rate of growth in treatments that are uncommon and low-cost.
The quantity of healthcare is estimated separately for each of the following sectors, which are weighted together to produce an overall quantity output series:
hospital and community health services (HCHS) – includes hospital inpatient, outpatient and day case episodes
family health services (FHS) – includes general practitioner (GP) and practice nurse consultations, publicly-funded dental treatment and sight tests
GP prescribing – includes all drugs prescribed by general practitioners
non-NHS provision1 – includes healthcare funded by the government but provided by the private or third sector
In 2016, public service healthcare quantity output (excluding quality adjustment) grew by 3.4%, following two years of quantity output growth of more than 4% per year. Much as with inputs, the overall growth rate of quantity output in 2016 was more similar to the relatively low growth rates observed between 2009 and 2012 than the faster growth between 2012 and 2015.
Figure 3a shows the quantity output growth by component before it is weighted by expenditure share. Figure 3b presents this information after weighting each of the four components together to show how much growth in each component contributes to the growth in overall output quantity.
Figure 3a: Public service healthcare quantity output growth by component
UK, 1995 to 2016
Source: Office for National Statistics
Notes:
HCHS – Hospital and Community Health Services.
FHS – Family Health Services.
Download this chart Figure 3a: Public service healthcare quantity output growth by component
Image .csv .xls
Figure 3b: Contributions to public service healthcare quantity output growth by component
UK, 1995 to 2016
Source: Office for National Statistics
Notes:
HCHS – Hospital and Community Health Services.
FHS – Family Health Services.
The sum of components of quantity output may not equal total output as the components and total output are independently splined to convert the data from financial to calendar year.
Download this chart Figure 3b: Contributions to public service healthcare quantity output growth by component
Image .csv .xlsFigure 3b shows the fall in quantity output in 2016 was mainly due to a slowdown in the growth of output from non-NHS providers. Due to a lack of activity data, the output for non-NHS services is assumed to be equal to inputs and so changes in growth in this element has minimal effect on productivity.
In recent years, the largest contribution of the four output components to healthcare output growth has come from hospital and community health services (HCHS), the category which accounts for the majority of healthcare expenditure. Growth in HCHS output in 2016 was 2.9%, down only marginally from 2015 when this component grew by 3.0%.
Growth in the quantity of healthcare provided should be seen in the context of healthcare demand and its drivers. One of these drivers is an ageing population: while the total UK population grew at an annual average rate of 0.6% over the period 1995 to 2016, the population aged 75 years and over grew at 1.4%. However, research by bodies such as the Organisation for Economic Co-operation and Development suggests that demographic effects, such as a larger population and an increasing number of people aged 75 years and over, have a relatively small impact on healthcare expenditure and output growth. Factors such as medical advances, healthcare institutions and public expectations are viewed as more significant factors in explaining increases in healthcare expenditure over time (see Public spending on health and long-term care: a new set of projections for more information).
Notes for: Output quantity
- Non-NHS provision is measured indirectly using expenditure and uses the “output-equals-inputs” convention, meaning implicit productivity for the non-NHS component is zero. This element of output in Figures 3a and 3b covers only that measured indirectly. Between financial year ending (FYE) 2003 and FYE 2011, a small proportion of non-NHS provided services were measured using activity data and are in included in the HCHS component.
7. Output quality
In line with the recommendations of the Atkinson Review (PDF, 1.08MB), a quality adjustment is applied to the estimate of healthcare quantity output1. The adjustment reflects two dimensions of quality.
The extent to which the service succeeds in delivering its intended outcomes
For hospital and community health services (HCHS), this is measured using short-term survival rates2 and health gain following treatment in hospital and changes in waiting times. For primary care, this is measured with a selection of measures from the general practitioner (GP) quality and outcomes framework, including measures for the percentage of certain groups of patients meeting target ranges for blood pressure.
The extent to which the service is responsive to users’ needs
National Patient Survey results are used to measure patient experience of hospital inpatient services, mental health services, primary care, outpatient, and accident and emergency services.
A positive quality adjustment indicates that the quality of healthcare services provided, as defined by the selection of indicators used in the quality adjustment, has improved. It should be noted that while the quality adjustment aims to cover a range of relevant aspects of healthcare quality, it cannot be taken as a comprehensive indicator of the quality or outcomes of all NHS services. More information on the quality adjustment can be found in Quality adjustment of public service health output: current method (PDF, 152KB).
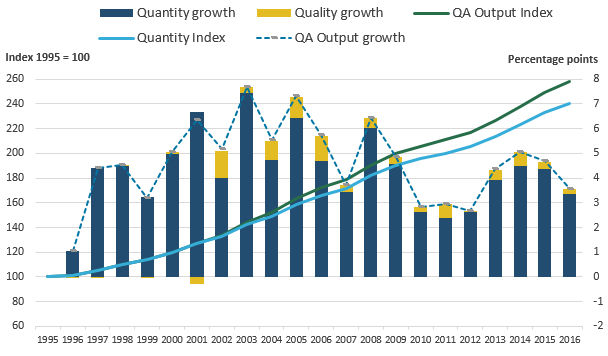
Figure 4 shows growth in the quantity and quality measures of healthcare output. It shows that the quality adjustment had positive effect, increasing output growth in all years, with the exception of 2001 (the year it was introduced) when the quality adjustment was slightly negative. In 2016, the quality adjustment added 0.2 percentage points to the output growth rate. This was a slight slowing of quality growth from 0.3 percentage points in 2015 and lower than the average adjustment for the series of 0.5 percentage points.
Figure 4: Public service healthcare quantity and quality adjusted output indices and growth rates
UK, 1995 to 2016
Source: Office for National Statistics
Notes:
QA - quality adjusted.
Sum of components of output may not equal total output due to the method for splining data from financial to calendar year.
While no quality adjustment data were available before the year 2001, a small quality adjustment effect may appear in the data for earlier years due to the “cubic splining” method used for converting financial year data into calendar year.
Download this image Figure 4: Public service healthcare quantity and quality adjusted output indices and growth rates
.PNG (33.5 kB) .xlsx (12.6 kB)
Effect of quality adjustment on productivity
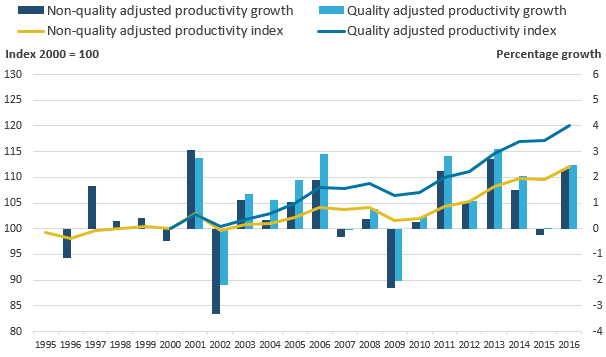
Figure 5 shows the growth of healthcare productivity with and without the quality adjustment applied, with total growth indexed to 2000, the year before the quality adjustment was introduced.
Figure 5: Public service healthcare quantity and quality adjusted productivity indices and growth rates
UK, 1995 to 2016
Source: Office for National Statistics
Download this image Figure 5: Public service healthcare quantity and quality adjusted productivity indices and growth rates
.PNG (23.1 kB) .xlsx (10.5 kB)
This shows that the quality adjustment has had a positive effect on productivity over the series and accounted for 40% of the overall increase in healthcare productivity between 2000 and 2016. The gap between quality adjusted and non-quality adjusted productivity has widened steadily over the period. This has occurred because, while the effect of quality adjustment on annual output growth has been small, the quality adjustment has been positive in every year except 2001.
Over the period 2000 to 2016, quality-adjusted productivity grew at an average rate of 1.1% and non-quality adjusted productivity grew at an average rate of 0.7%.
Notes for: Output quality
No quality adjustment is currently applied to non-NHS healthcare services.
The quality adjustment for short-term survival rates is calculated from data supplied by the University of York on a financial year basis. Between the years financial year ending (FYE) 2001 to FYE 2014 it was measured by the year-on-year change in 30-day post-operative mortality. However, these data are no longer available and so the short-term survival rate adjustment for the period FYE 2014 to FYE 2017 is measured using the change in in-hospital mortality rates.
8. Revisions
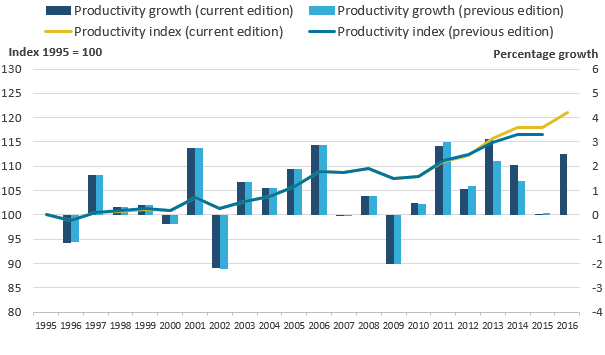
Figure 6 shows the effect of the revisions on the growth rate of productivity. The revisions largely apply to the period from 2010 to 2015. They largely result from:
the process used to convert financial year data into calendar years, which results in a change in the path of previous year’s growth rates when an additional year is added to the series
regular revisions to national accounts data used in the series
a change in the methodology for labour inputs to capture average full-time equivalent staff numbers over a year as opposed to taking staff numbers from one month in a year
No revision to productivity in 2015 is observed due to offsetting revisions in inputs and output.
Figure 6: Growth rate and index for public service healthcare productivity for current and previous publication
UK, 1995 to 2016
Source: Office for National Statistics
Download this image Figure 6: Growth rate and index for public service healthcare productivity for current and previous publication
.PNG (21.4 kB) .xlsx (11.3 kB)
Overall, the revisions have resulted in a small upward revision in healthcare productivity relative to the previous publication, leaving the productivity index 1.4 percentage points higher in 2015. Following these revisions, the average annual growth rate for healthcare productivity between 1995 and 2015 is unchanged relative to the previous publication at 0.8%.
Back to table of contents9. Comparisons with other measures of output and productivity
Other Office for National Statistics (ONS) output and productivity measures
It is important to recognise that the productivity statistics published in this article are based on a concept of output as measured by government consumption expenditure rather than government or state production. This follows from the submission of the estimates of the volume of government output that are used in this article (prior to any quality adjustment) to the gross domestic product (expenditure) (GDP (E)) side of the UK National Accounts. This means that we are using a measure of government-purchased output, regardless of what type of business unit produced the output. As with other aspects of the methodology employed in producing these statistics, this approach is consistent with that recommended by the Atkinson Review (PDF, 1.08MB).
In the case of healthcare, although most expenditure is used to fund state providers of healthcare services and its administration, there is a growing component of expenditure on private and third sector-provided healthcare services. This is included within government output in our articles, even though it is provided by business units that are classified as private businesses or non-profit institutions serving households (NPISH) in the UK National Accounts, and this is why the term “public service” is used instead of “public sector”.
Traditional measures of private sector or whole-economy productivity, including those published by Office for National Statistics (ONS), use a supply or production framework. These measures of productivity use Standard Industrial Classification (SIC 2007) categories of production as the measure of output and are on a gross value added (GVA) basis. Input measures count the labour (jobs or hours) used in the production of these goods and services to estimate labour productivity series such as those produced by ONS. We also produce Experimental Statistics on market sector multi-factor productivity, which include labour and capital services as inputs.
The interpretation of the expenditure-based productivity estimates presented in this article should therefore be taken as a measure of the productivity of government-funded healthcare services for individuals in the UK (from whatever type of business unit), and not necessarily government-provided services. Caution should be used when considering the differences between productivity measures published using the expenditure approach (which will include services purchased by government from the independent sector) and those using the traditional production approach (which will only include government-produced services).
More information on the difference between these two approaches is available in a paper we published in June 2015: Comparing public service productivity estimates.
Other healthcare output and productivity measures
The English financial year productivity figure is produced on a similar basis to an alternative healthcare productivity measure produced by the Centre for Health Economics at the University of York in the series Productivity of the English NHS (PDF, 3.24MB). Both series apply the Atkinson framework, and the largest element of the quality adjustment is produced by the University of York and used in both publications. However, the two series provide slightly different estimates of productivity growth.
For example, the productivity growth rate in the England ONS series of 0.6% in financial year ending (FYE) 2016 differs from the zero growth in the University of York series, while the average productivity growth rate over the period between FYE 2005 and FYE 2016 was 1.3% in the ONS series and 1.2% in the University of York series.
These differences arise from a number of differences in the source data used in the two publications including:
different sources and methods used in the calculation of output, including hospital and community health services (HCHS) output and the estimation of general practitioner (GP) activity
different data sources used in the calculation of inputs, particularly goods and services inputs and capital inputs
while the largest element of the quality adjustment is common between the two productivity measures, there are minor differences in some parts of the quality adjustment and their application to output data
No single productivity measure is definitive and productivity measures cannot alone provide a perfectly comprehensive view of service efficiency, as they do not indicate whether the inputs have been purchased at the lowest possible cost, or whether the desired outcomes are achieved through the output provided.
Back to table of contents10. Acknowledgements
The authors of this article are Narcisa Florea and James Lewis. The authors would like to thank Adriana Castelli, James Gaughan and Idaira Rodriguez Santana from the University of York for the provision of quality adjustment data and comments, and Sharon Allen, Alastair Brodlie, Julie Broughton, James Gordon, Barry McEvory, John Morris, Paudric Osborne, Bethan Sherwood and Joel Solway for the provision of output and input data and comments.
Back to table of contents11. Quality and methodology
The Public service productivity: healthcare Quality and Methodology Information report contains important information on:
the strengths and limitations of the data and how it compares with related data
uses and users of the data
how the output was created
the quality of the output, including the accuracy of the data
More detailed information on methods is available in the healthcare sources and methods paper (PDF, 328.65KB).
Back to table of contents