1. Disclaimer
These Research Outputs are not official statistics. Rather they are published as outputs from research into an Administrative Data Census approach. These outputs must not be reproduced without this disclaimer and warning note, and should not be used for policy- or decision-making.
Back to table of contents2. New analysis using administrative data
This is early research to demonstrate the new potential of an Administrative Data Census and the type of analysis that’s possible by linking different administrative datasets. A benefit of this approach is the ability to provide a unique insight into the characteristics of different population subgroups.
This research is working towards providing information around mothers’ incomes. It builds on our previous income publication and demonstrates the potential for multivariate analysis using information from other data sources.
The main data sources for this output are income and benefits data from Department for Work and Pensions (DWP) and HM Revenue and Customs (HMRC). Current data acquired by the Office for National Statistics (ONS) isn’t sufficient to develop a complete picture of income across the whole population. This is due to missing information from Self Assessment returns (which include self-employment information) and more detailed breakdowns, for example, whether income is from a pension or from employment.
More comprehensive income information would provide the opportunity to say more about women’s behaviour around childbearing and the type of income received. This may lead to better understanding around childbirth and women’s working patterns, an important policy area of interest.
This research provides information on women who had a live birth in England and Wales in the calendar year 2015 and who had income information available for the tax year ending 2014. These periods have been used due to the availability of the data. Although there are limitations to this, it clearly demonstrates the potential of using administrative data to produce new analysis. Currently, only income data at the individual level is available; therefore, income received by other members of the household, for example a partner, is not considered in this analysis.
We have produced analysis on the gross annual income of around 471,000 mothers in the tax year before they gave birth. We’ve done this by taking birth registrations data and linking it to HMRC and DWP Pay As You Earn (PAYE) and benefits data.
For more information on the PAYE and benefits data sources used in this analysis see the Administrative Data Source Reports. For information on the births registration data see the Births in England and Wales: 2015 release.
Back to table of contents3. Things you need to know about this release
These Research Outputs are not official statistics – they are published to demonstrate the type of analysis possible using administrative data.
“New mothers” in this report are women who had a live birth in 2015 in England and Wales, were aged 16 or over at the time of birth and received an income via Pay As You Earn (PAYE) and/or benefits in the tax year ending 20141.
The term “income” used throughout this output refers to income estimated from PAYE and benefits data only2.
Income from Child Benefit or recorded via Self Assessment (which includes income received from self-employment, property rental and investments) isn’t included in this analysis.
The outputs refer to individual gross income received during the tax year ending 2014 measured in nominal3 terms.
This analysis follows the Research Output: Income from PAYE and benefits for tax year ending 2014, which contains more information about how we produced estimates of income from PAYE and benefits data.
The 2015 birth registrations data is based on when the birth occurred and includes a small number of births from 2014 that were registered too late to be included in the previous year’s dataset – the number of late registrations in each annual dataset is noted in the User guide to birth statistics.
Notes for: Things you need to know about this release
“New mothers” in this report include first-time mothers and those who have had previous children but who became a mother again in 2015.
Benefits data includes National Benefit Database (Incapacity Benefit, Jobseeker’s Allowance, Carer’s Allowance, Income Support, Severe Disablement Allowance, Employment and Support Allowance, Widow’s benefits or bereavement benefits, Disability Living Allowance, Pension Credit, State Pensions and Attendance Allowance), Single Housing Benefit Extract and tax credits.
Nominal income is not adjusted for the effects of inflation.
4. How have we determined new mothers’ income?
Income data used in this analysis is the same as that used in the Research Outputs: Income from PAYE and benefits. This has been linked to births registrations data to identify mothers who had a live birth in 2015 in England and Wales.
The data used in this analysis includes mothers in the annual 2015 births registration dataset, who had a live birth, were aged 16 and over and received an income via Pay As You Earn (PAYE) and/or benefits in the tax year ending 2014 (Figure 1). Due to the data currently available, this analysis is limited. These periods were selected to analyse income of women before they gave birth in 2015. Access to more detailed income data covering a longer time period in the future would provide the opportunity for more complete analysis.
Figure 1: Data sources and reference years to identify new mothers’ income in the tax year before birth
| 2013 | 2014 | 2015 | |||||||||
| Jan | Apr | July | Oct | Jan | Apr | July | Oct | Jan | Apr | July | Oct |
| Income data, tax year ending 2014 | Birth registrations data, 2015 | ||||||||||
Birth registration data includes all live births in England and Wales during a calendar year. Therefore, mothers having multiple births (for example, twins or two births in the calendar year) appear multiple times in the original data. Mothers’ information was extracted and linked to the Customer Information System (CIS) where the CIS identifier was used to de-duplicate the data so that mothers appeared only once in the dataset. Using this methodology, there were approximately 698,0001 births to around 691,000 mothers in 2015.
As well as linkage to the CIS, mothers were also linked to the income dataset (as used in the Research Outputs: Income from PAYE and benefits). Records that had no income information available (including those with a recorded income of £0.00) were removed, as well as mothers aged under 16. This left 487,000 records (Figure 2). Therefore, this analysis presents a partial picture for new mothers’ income. For more information on those with no income information available see the published Income Research Output (section 6). More information about our matching methodology is available in a previous Beyond 2011 Matching Anonymous Data paper.
Lastly, the remaining records were linked to Statistical Population Dataset (SPD) V2.0 2015 and any records not present were dropped. An SPD is a single, coherent dataset that forms the basis for estimating the size of the resident population using administrative data. After linking to this SPD the final dataset contained 471,000 records. For more information on those who don’t appear on SPD V2.0 2015 see the published Methodology of Statistical Population Dataset V2.0 2015 report.
In summary, records not included in this dataset include those aged under 16, those not present on SPD V2.0 2015 and those who didn’t have income information available.
Figure 2: Methodology to determine new mothers' income
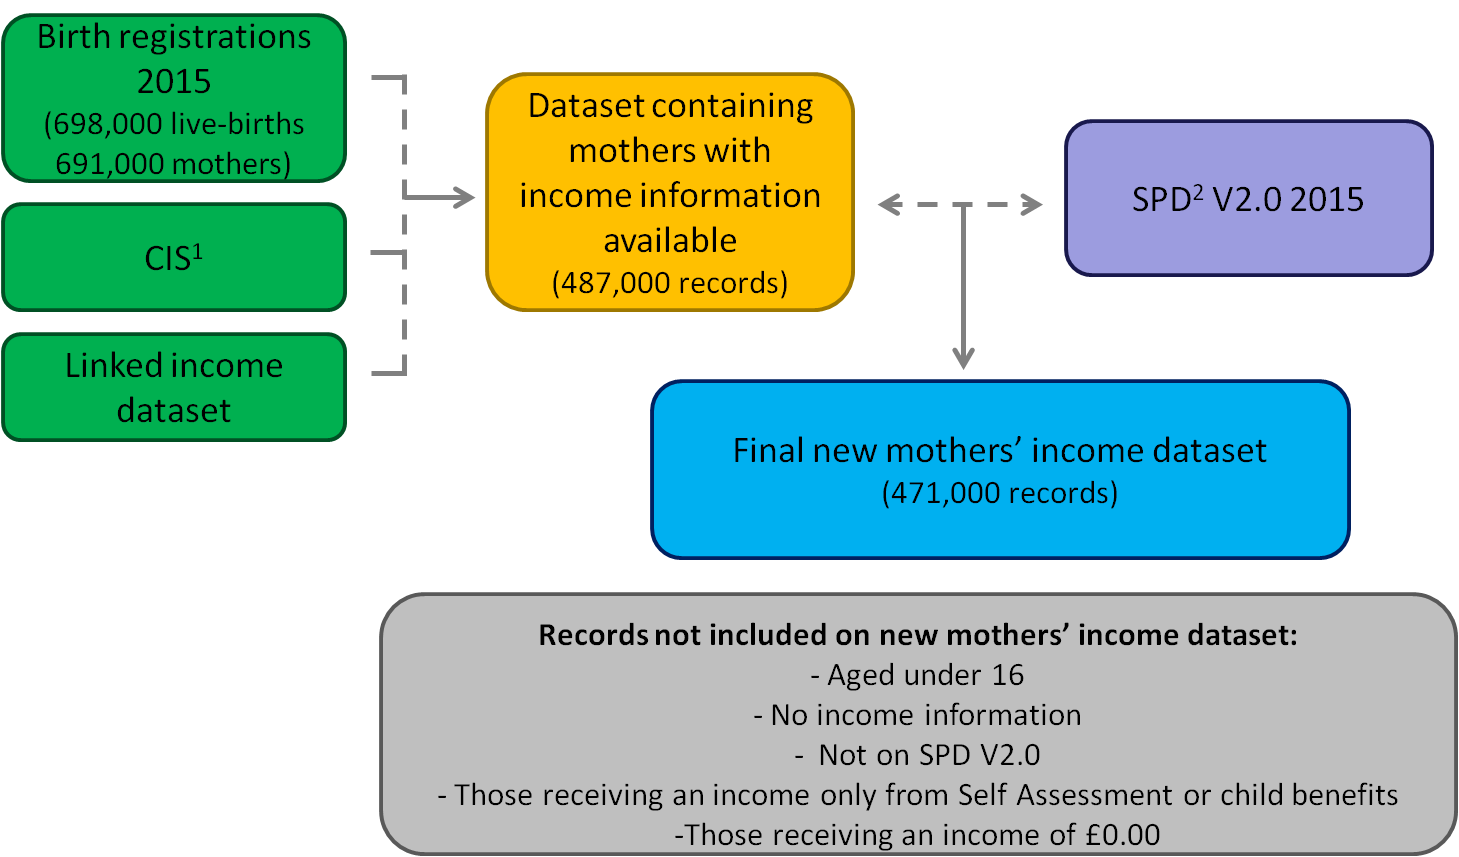
Source: Office for National Statistics
Notes:
- Customer Information System
- A Statistical Population Dataset (SPD) is a single, coherent dataset forms the basis for estimating the size of the resident population. It is produced by linking records across multiple administrative data sources and applying a set inclusion and distribution rules.
Download this image Figure 2: Methodology to determine new mothers' income
.png (61.1 kB)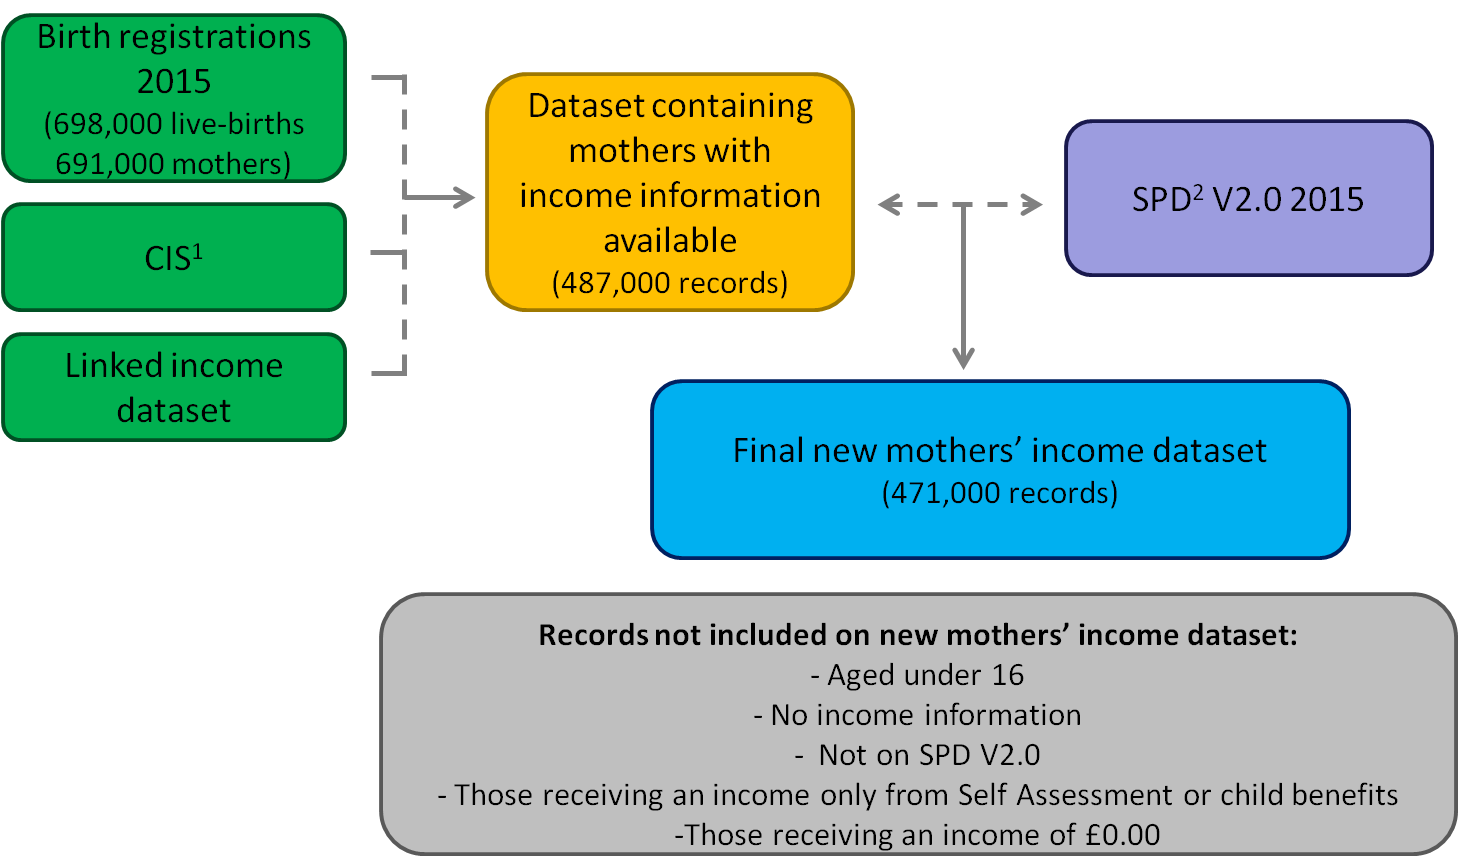
This analysis only provides income information at the individual level. Therefore, any income received from other members of the household isn’t considered. This may be income from a partner or the mother’s parents if she is living with them.
In addition to this, any income taxed via Self Assessment or received from Child Benefit isn’t included as this data isn’t currently available to us2. Therefore, some mothers in this analysis may have a higher income than reported here. For example, we may only have some information on the benefits a mother receives, but they may also receive income from self-employment, which isn’t included here. In addition, mothers who only received income from self-assessment won’t be included in this analysis.
Note for: How have we determined new mothers' income?
This figure is the same as that produced in the published births registrations data. Rounding has been implemented in this analysis.
For plans on Administrative Data Census data acquisition please see the 2017 Administrative Data Census: Annual Assessment.
5. What do the outputs show?
Distribution of income
Overall, the distribution of the income received for women who had a live birth in 2015 follows a similar trend to the distribution for all women1. Of those aged 16 to 29, around half received an income of less than £10,000.00 (Figure 3).
In the older age group there were slight differences. For women aged 30 and over, a higher proportion of women who had a live birth in 2015 (42%) received an income of over £20,000.00 compared with all women (25%).
Figure 3: Distribution of income by age
Income for tax year ending 2014 for women who had a live birth in 2015 and all women in 2015

Source: Office for National Statistics
Notes:
- These Research Outputs are not official statistics on mothers’ income.
- Data source: Births in England and Wales: 2015 from ONS, Pay As You Earn (PAYE) employment and pension data and tax credits data from HM Revenue and Customs; and benefits data from the Department for Work and Pensions. As the Research Outputs are limited to these data sources, a number of components of income are missing, for example, Self Assessment.
- The income measure includes most earnings from employment (excluding self-employment), most benefits and tax credits, and most occupational and personal pensions. For further information on what is and isn’t included in the income measure see the previous Income Research Outputs.
- Information on Child Benefit and income recorded via Self Assessment (which includes income received from self-employment, property rental and investments) isn’t included in this analysis.
Download this image Figure 3: Distribution of income by age
.png (12.5 kB) .xls (39.4 kB)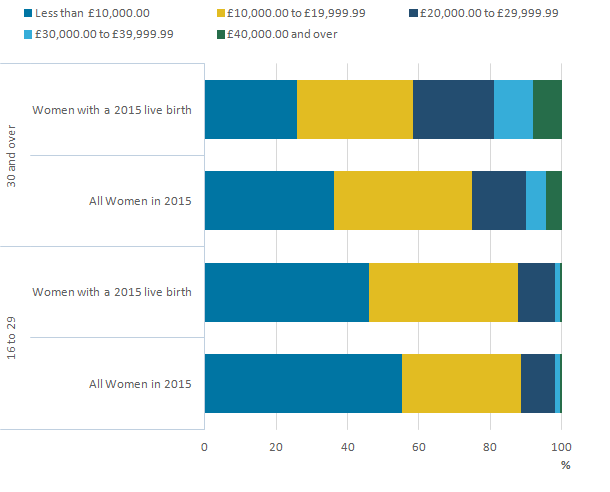
Distribution of income by previous children
The birth registrations data provides information on the number of previous live-born children a mother has had at the time of the current birth.
There are known quality issues with the recording of previous number of children as outlined in the Births Quality and Methodology Information document. There’s no separate source of data against which we are able to verify information on the number of previous children. The Vital Statistics Outputs Branch is working with the General Register Office (GRO) to ensure the accuracy of information on previous children. A very small proportion of women (0.38%) were missing information on number of previous children; therefore they’ve been removed from this part of the analysis.
For women who had a live birth in 2015 and had income information for the tax year ending 2014, 34% were having their first child. This is similar to the published birth registration data where 39% of all births in 2015 were a first birth.
A higher proportion (75%) of women having a subsequent child received an income of less than £20,000.00 compared with those who were having their first child (64%). The opposite is seen in the higher income groups where 36% of mothers having their first child received £20,000.00 or over compared with 25% of women having a subsequent child (Figure 4). It might be expected that a greater proportion of mothers having their first child would be in the higher income groups as they may be more likely to be working full-time in the tax year before the birth.
Figure 4: Distribution of income by number of previous children
Income for tax year ending in 2014 for women who had a live birth in 2015
Source: Office for National Statistics
Notes:
- These Research Outputs are not official statistics on mothers’ income.
- Data source: Births in England and Wales: 2015 from ONS, Pay As You Earn (PAYE) employment and pension data and tax credits data from HM Revenue and Customs; and benefits data from the Department for Work and Pensions. As the Research Outputs are limited to these data sources, a number of components of income are missing, for example, Self Assessment.
- The income measure includes most earnings from employment (excluding self-employment), most benefits and tax credits, and most occupational and personal pensions. For further information on what is and is not included in the income measure see the previous Income Research Outputs.
- Information on Child Benefit and income recorded via Self Assessment (which includes income received from self-employment, property rental and investments) isn’t included in this analysis.
Download this chart Figure 4: Distribution of income by number of previous children
Image .csv .xlsFor women aged 16 to 29 who had a live birth in 2015, the distribution of income was broadly similar, with small differences for those having their first or subsequent child (Figure 5). A slightly higher proportion of mothers who had a subsequent child (44%) received an income between £10,000.00 and £19,999.99 compared with those who had their first child (38%). Conversely, a slightly higher proportion of mothers having their first child in 2015 (16%) received an income over £20,000.00 compared with those having a subsequent child (10%).
Figure 5: Distribution of income by number of previous children: women who had a live birth in 2015 aged 16 to 29
Income for tax year ending 2014 for women who had a live birth in 2015
Source: Office for National Statistics
Notes:
- These Research Outputs are not official statistics on mothers’ income.
- Data source: Births in England and Wales: 2015 from ONS, Pay As You Earn (PAYE) employment and pension data and tax credits data from HM Revenue and Customs; and benefits data from the Department for Work and Pensions. As the Research Outputs are limited to these data sources, a number of components of income are missing, for example, Self Assessment.
- The income measure includes most earnings from employment (excluding self-employment), most benefits and tax credits, and most occupational and personal pensions. For further information on what is and isn’t included in the income measure see the previous Income Research Outputs.
- Information on Child Benefit and income recorded via Self Assessment (which includes income received from self-employment, property rental and investments) isn’t included in this analysis.
Download this chart Figure 5: Distribution of income by number of previous children: women who had a live birth in 2015 aged 16 to 29
Image .csv .xlsThe distribution of income for women who had a live birth in 2015 aged 30 and over was different to the younger age group. Those in the older age group were more likely to be receiving an income of £20,000.00 or over (42% compared with 12% of those aged 16 to 29 (see figure 3)) but less likely to be having a first child (29% compared with 41% of women aged 16 to 29).
In addition to this, there was a greater difference in the distribution of income when considering number of previous children (Figure 6). For example, 40% of older women who had their first child in 2015 received an income of less than £20,000.00 compared with 66% of those who had a subsequent child. Conversely, a higher proportion of older women (60%) having their first child in 2015 were earning over £20,000.00 than those having a subsequent child (34%).
Women aged 30 and over and having their first child in 2015 were more likely to be receiving a higher income than those aged 16 to 29. More data would be needed to understand whether women are delaying childbirth to further their career and receive a higher income.
Figure 6: Distribution of income by number of previous children: women who had a live birth in 2015 aged 30 and over
Income for tax year ending 2014 for women who had a live birth in 2015
Source: Office for National Statistics
Notes:
- These Research Outputs are not official statistics on mothers’ income.
- Data source: Births in England and Wales: 2015 from ONS, Pay As You Earn (PAYE) employment and pension data and tax credits data from HM Revenue and Customs; and benefits data from the Department for Work and Pensions. As the Research Outputs are limited to these data sources, a number of components of income are missing, for example, Self Assessment.
- The income measure includes most earnings from employment (excluding self-employment), most benefits and tax credits, and most occupational and personal pensions. For further information on what is and isn’t included in the income measure see the previous Income Research Outputs.
- Information on Child Benefit and income recorded via Self Assessment (which includes income received from self-employment, property rental and investments) isn’t included in this analysis.
Download this chart Figure 6: Distribution of income by number of previous children: women who had a live birth in 2015 aged 30 and over
Image .csv .xlsNotes for: What do the outputs show?
- In this analysis “all women” are those who are present on SPD V 2.0 2015 and who have income information available as outlined in the Income Research Outputs.
6. Conclusions and next steps
This analysis demonstrates the benefits of using administrative data to provide new insights into sub-groups of the population that haven’t previously been possible. It also demonstrates the ability to produce multivariate analysis.
This research shows that the age of the mother and number of previous live-born children may have an effect on the income received. Older women who were having their first child in 2015 were more likely to be receiving a higher income than the younger age group.
Further research is needed to develop an understanding of the characteristics of these groups and to explore trends over time. For example, how mothers’ income and work patterns change from the year before to the years after they gave birth. Access to more detailed PAYE, benefits and other types of income data in the future has the potential to enable more complete analysis.
In addition, it’s currently only possible to understand income at the individual level. Therefore, further understanding of the effect of the income from other household members will be possible once household income estimates are available. Administrative Data Research Outputs on household income will be published in autumn 2017.
This analysis doesn’t include information on any income taxed via Self Assessment (which includes income received from self-employment, property rental and investments) or received from Child Benefit. Therefore, the analysis is limited and shouldn’t be used for any decision-making at this stage. Some women will have a higher income than reported here due to missing these additional forms of income. This demonstrates the need for more complete administrative data.
We’re conducting more research to produce administrative-data-based population estimates and population characteristics. For further information on our overall aims, see section 4 of the Income Research Outputs and our annual assessment.
Back to table of contents7. Feedback
We are keen to get feedback on these Research Outputs and the methodology used to produce them, including how they might be improved and potential uses of the data. Please email your feedback to Admin.Data.Census.Project@ons.gov.uk. Don't forget to include the title of the output in your response.
Back to table of contents