Table of contents
- Main points
- Statistician’s quote
- Things you need to know
- Live births increased in 2015
- Is the age at which women are having babies changing?
- The percentage of births outside marriage or civil partnership continues to rise
- Over a quarter of live births to non-UK born mothers
- Fertility rates can vary considerably between areas
- Number of live births in the UK rises
- The number of stillbirths decreased in 2015
- Links to related ONS statistics
- Quality and methodology
1. Main points
There were 697,852 live births in England and Wales in 2015, an increase of 0.4% from 2014.
In 2015, the total fertility rate (TFR) decreased to 1.82 children per woman, from 1.83 in 2014.
The average age of mothers in 2015 increased to 30.3 years, compared with 30.2 years in 2014.
The fertility rate for women aged 40 and over rose above the rate for women aged under 20 for the first time since 1947.
Over a quarter (27.5%) of live births in 2015 were to mothers born outside the UK, the highest level on record.
In 2015, the stillbirth rate decreased to 4.5 per 1,000 total births, the lowest rate since 1992.
Back to table of contents2. Statistician’s quote
“The trend for women to have babies at older ages continued in 2015. Over the last 40 years, the percentage of live births to women aged 35 and over has increased considerably. Women aged 40 and over, now have a higher fertility rate than women aged under 20 - this was last recorded in the 1940s.”
Elizabeth McLaren, Vital Statistics Outputs Branch, Office for National Statistics follow @StatsLiz on Twitter.
Back to table of contents3. Things you need to know
Important information for interpreting these birth statistics:
birth statistics represent births which occurred in England and Wales in the calendar year, but include a very small number of late registrations from the previous year
figures are compiled from information supplied when births are registered as part of civil registration, a legal requirement
4. Live births increased in 2015
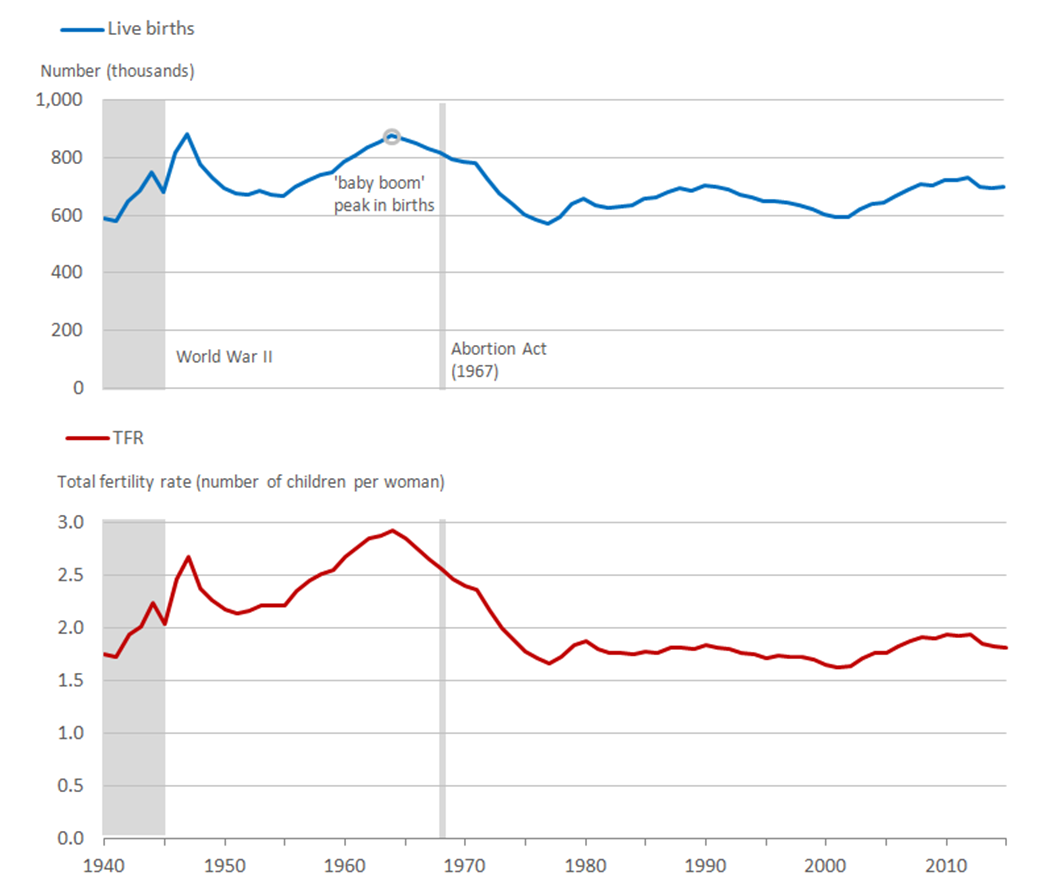
There were 697,852 live births in England and Wales in 2015, a small increase of 0.4% compared with 695,233 in 2014. The number of live births has fluctuated, following the 4.3% decrease between 2012 and 2013; the largest percentage annual decrease since 1975 (Figure 1).
The total fertility rate (TFR) for England and Wales decreased slightly in 2015 to an average of 1.82 children per woman from 1.83 in 2014. The number of births and the TFR in 2015 remain relatively high compared with the last 4 decades.
Figure 1: Numbers of live births and total fertility rate (TFR), 1940 to 2015
England and Wales
Source: Office for National Statistics
Notes:
- Based on births occurring in the calendar year.
Download this image Figure 1: Numbers of live births and total fertility rate (TFR), 1940 to 2015
.png (117.7 kB) .xls (31.2 kB)
The TFR provides a timely measure of fertility levels; it can be affected by changes in the timing of childbearing, as well as changes in completed family size.
Back to table of contents5. Is the age at which women are having babies changing?
In 2015, fertility rates decreased for women in all age groups under 25, and increased for all age groups 30 and over compared with 2014 (Figure 2). The fertility rate for women aged 25 to 29 remained unchanged.
The largest percentage decrease in fertility rates was for women aged under 20 (7.1%); fertility has generally declined for the under 20s since 1999.
The largest percentage increase in fertility rates was for women aged 40 and over (3.4%); this rate has more than trebled since 1981. In 2015, the fertility rate for women aged 40 and over rose above the rate for women aged under 20.
Women aged 30 to 34 have had the highest fertility of any age group since 2004, prior to this women aged 25 to 29 had the highest fertility.
Figure 2: Age-specific fertility rates, 1981 to 2015
England and Wales
Source: Office for National Statistics
Notes:
- Based on births occurring in the calendar year.
Download this chart Figure 2: Age-specific fertility rates, 1981 to 2015
Image .csv .xlsChanges in age-specific fertility rates impact on the total fertility rate (TFR). The TFR decreased in 2015, compared with 2014, despite a small rise in the number of live births. The rise in births was due to an increase in births to women aged 25 and over; births to younger women decreased. As a result, fertility rates for women aged under 25 declined and rates for women aged 30 and over rose. These changes in fertility rates have generally been driven by larger changes in the number of births, rather than changes in the size of the population. The fall in fertility rates at younger ages outweighed the increase in rates at older ages, hence the overall TFR decreased.
In most developed countries, women have been increasingly delaying childbearing to later in life, which has resulted in rising fertility rates among older women. This may be due to a number of factors such as increased female participation in higher education and the labour force, the increasing importance of a career, the rising costs of childbearing, labour market uncertainty and housing factors.
Rising fertility rates at older ages have affected the average age of mother, which has been increasing since 1975, reaching 30.3 years in 2015.
Back to table of contents6. The percentage of births outside marriage or civil partnership continues to rise
The long-term rise in the percentage of births outside marriage or civil partnership has continued, with 47.7% of all babies born outside marriage or civil partnership in 2015; this compares with 47.5% in 2014. Many of these babies have parents who live together - over the last decade over 60% of all births registered outside marriage or civil partnership each year have been to a cohabiting couple. This is consistent with increases in the number of couples cohabiting rather than entering into marriage or civil partnership (Families and Households provides further information).
Back to table of contents7. Over a quarter of live births to non-UK born mothers
The percentage of live births in England and Wales to mothers born outside the UK continued to rise in 2015, reaching 27.5%; this percentage has increased every year since 1990, when it was 11.6%.
In recent years, the proportion of births to women born outside the UK has been higher than the proportion of the female population of childbearing age born outside the UK. There are 2 reasons for this:
fertility levels are generally higher among foreign-born women
the foreign-born and UK-born female populations of reproductive age have different age structures, with a higher proportion of foreign-born women being aged from 25 to 34, where fertility is highest
8. Fertility rates can vary considerably between areas
In 2015, the East of England was the region of England with the highest total fertility rate (TFR), with 1.92 children per woman. The North East had the lowest TFR, 1.71 children per woman.
Among the local authorities in England in 2015, City of London had the lowest TFR (1.00), Barking and Dagenham had the highest (2.42). In Wales in 2015, Cardiff had the lowest TFR (1.64), Denbighshire had the highest (2.16).
How have local levels of fertility changed since 2001?
TFRs by local authority district, 2001 to 2015, England and Wales
Embed code
Fertility rates can vary considerably between subnational areas for a wide variety of reasons. These include variations in the composition of the population living in each area and social, economic and cultural differences.
For example:
a large student population within a local authority often acts to reduce overall fertility in that area, as students in higher education tend to have below average fertility
women born in certain countries such as India, Bangladesh, Pakistan and African countries tend to have above average fertility
fertility rates for some local authorities are based on relatively small populations – such calculations are often subject to random fluctuations and are consequently less robust
9. Number of live births in the UK rises
The provisional number of live births in the UK in 2015 was 777,167; an increase of 0.1% compared with 2014.
In Scotland the number of live births decreased by 2.9% in 2015 (provisional figure). There was a slightly smaller fall in live births in Northern Ireland of 0.7% (provisional figure).
Back to table of contents10. The number of stillbirths decreased in 2015
The number of stillbirths in England and Wales fell by 3.3% to 3,147 in 2015, from 3,254 in 2014. The stillbirth rate takes into account the total number of births (live and stillbirths), so provides a more accurate indication of trends than just analysing the number of stillbirths over time. In 2015, the stillbirth rate for England and Wales fell to 4.5 per 1,000 total births; the lowest rate since 1992 when it was 4.3.
In England, the stillbirth rate in 2015 was 4.4 per 1,000 total births, down from 4.6 in 2014. There has been a general downward trend in the stillbirth rate since 2005 with a decrease of 18.5% over the last 10 years (Figure 3).
In Wales, the stillbirth rate in 2015 was 4.7 per 1,000 total births, down from 5.2 in 2014. Due to the small number of stillbirths in Wales, the stillbirth rate is more prone to random fluctuations.
Figure 3: Stillbirth rates, 2005 to 2015
England and Wales
Source: Office for National Statistics
Notes:
Stillbirths rates per 1,000 live births and stillbirths.
Based on stillbirths and births occurring in each calendar year
Download this chart Figure 3: Stillbirth rates, 2005 to 2015
Image .csv .xls12. Quality and methodology
This is the first time that annual birth statistics for England and Wales have been published for 2015. This release provides summary figures; detailed statistics are published in themed packages between August and November.
Birth statistics are used for planning maternity services, to inform policy decisions and resource allocation, for example, deciding numbers of school places required. They also enable the analysis of social and demographic trends.
The Births Quality and Methodology Information document contains important information on:
- the strengths and limitations of the data
- the quality of the output: including the accuracy of the data, how it compares with related data
- uses and users
- how the output was created
Our User Guide to Birth Statistics provides further information on data quality, legislation and procedures relating to births and includes a glossary of terms.
There is a large degree of comparability in birth statistics between UK countries. However, there are some differences, although these are believed to have a negligible impact on the comparability of the statistics. These differences are outlined in our Quality and Methodology Information for births.
The Revisions policy for birth statistics is available on our website.
The total fertility rate (TFR) is the average number of live children that a group of women would each have if they experienced the age-specific fertility rates of the calendar year in question throughout their childbearing lives. It provides a timely measure of the current intensity of childbearing. Our User Guide to Birth Statistics provides further information.
The average age of mother has been standardised to eliminate the impact of changes in the distribution of the population by age, enabling analysis of trends over time. The figure is therefore calculated using fertility rates per 1,000 female population by single year of age.
A stillbirth is a baby born after 24 or more weeks completed gestation and which did not, at any time, breathe or show signs of life.