Table of contents
- Main points
- Statistician’s comment
- Things you need to know about this release
- Average life satisfaction, worthwhile and happiness ratings increase in the UK
- Women report higher levels of personal well-being than men
- Which age groups have shown improvements in personal well-being?
- Fewer people reporting low levels of life satisfaction, worthwhile and happiness ratings since we began measuring personal well-being
- Links to related statistics
- Quality and methodology
1. Main points
In the year ending September 2017, there continued to be slight improvements in the UK for average ratings of life satisfaction, feeling that the things done in life are worthwhile and happiness; there was no overall change in reported anxiety levels.
The improvement was driven by England, which was the only UK country with any changes in average reported personal well-being over this period.
The proportion of people reporting low ratings for measures of life satisfaction, worthwhile and happiness remained unchanged since September 2016; there was also no change in those reporting high anxiety.
In the year ending September 2017, women reported higher life satisfaction, worthwhile and happiness ratings compared with men but also reported higher levels of anxiety.
There have been improvements for all measures of personal well-being for those aged 30 to 34, 40 to 59 and 65 to 69 years, since we began measuring personal well-being in 2011.
2. Statistician’s comment
“We have seen average ratings of personal well-being slightly improving over the years. Factors such as people’s social connections and health status play an important part in personal well-being. However, some economic factors are also important, so perhaps this trend over time is not surprising as the country came out of the economic downturn.
“We have also seen inequalities emerging within the data, and we will be exploring these further looking at factors that may contribute to some groups of society having lower personal well-being.”
Silvia Manclossi, Head of Quality of Life Team, Office for National Statistics
Back to table of contents3. Things you need to know about this release
Well-being dashboard
The statistics mentioned in this bulletin are displayed through our well-being dashboard, which monitors and reports how the UK is doing by producing accepted and trusted measures for the different areas of life that matter most to the UK public. The four personal well-being measures are one of the domains included within the dashboard (please see the Quality and methodology section for more information).
Measuring national well-being dashboard

Source: Annual Population Survey, Office for National Statistics
Download this image Measuring national well-being dashboard
.png (64.8 kB)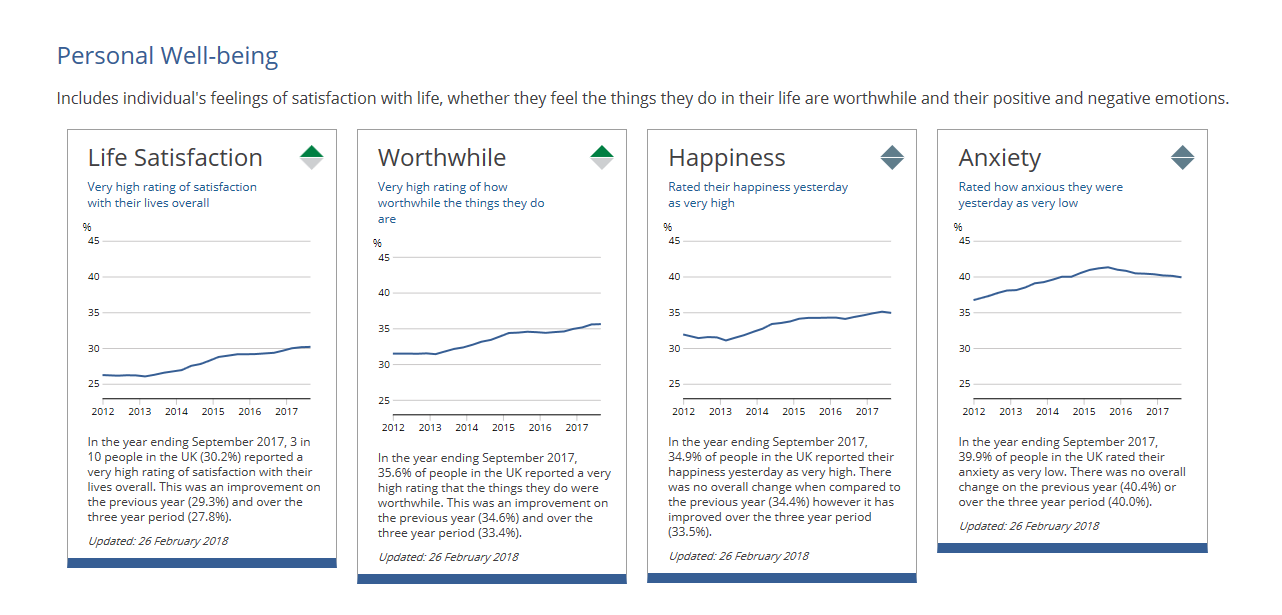
Our next publications and your feedback
We are in the process of reviewing our publications and planning to provide in-depth analysis of our personal well-being data from an inequality perspective by looking at a population group at a time.
You can help inform our work by sharing your opinions in this short survey: ONS Personal Well-being outputs: Your feedback.
Your feedback will be very valuable in making our results useful and accessible. If you have any questions, please contact us via email at QualityOfLife@ons.gov.uk.
Thank you for taking part!
Back to table of contents4. Average life satisfaction, worthwhile and happiness ratings increase in the UK
The average (mean) ratings across the four measures of personal well-being in the year ending September 2017 were:
7.7 out of 10 for life satisfaction
7.9 out of 10 for feeling that what you do in life is worthwhile
7.5 out of 10 for happiness yesterday
2.9 out of 10 for anxiety yesterday
Between the years ending September 2016 and 2017, there were improvements in average ratings of life satisfaction, feeling that the things done in life are worthwhile and happiness for the UK overall. There was no significant change in average ratings of anxiety.
Over the same time period, England also showed improvements in average ratings of life satisfaction, feeling that the things done in life are worthwhile and happiness. No significant changes in reported personal well-being were found in Scotland, Wales or Northern Ireland.
However, people in Northern Ireland continued to report the highest average levels of personal well-being compared with the UK average in the year ending September 2017.
Figures 1a and 1b display the changes in personal well-being in the UK between the years ending March 2012 and September 2017.
Figure 1a: Average life satisfaction, worthwhile and happiness ratings, year ending March 2012 to year ending September 2017
UK
Source: Annual Population Survey, Office for National Statistics
Notes:
- Chart axis does not start at 0.
Download this chart Figure 1a: Average life satisfaction, worthwhile and happiness ratings, year ending March 2012 to year ending September 2017
Image .csv .xls
Figure 1b: Average anxiety ratings, year ending March 2012 to year ending September 2017
UK
Source: Annual Population Survey, Office for National Statistics
Notes:
- Chart axis does not start at 0.
Download this chart Figure 1b: Average anxiety ratings, year ending March 2012 to year ending September 2017
Image .csv .xls5. Women report higher levels of personal well-being than men
Between the years ending September 2016 and 2017, women reported higher levels of personal well-being than men for life satisfaction, feeling that the things done in life are worthwhile and happiness. However, they also reported higher levels of anxiety over the same period.
Over time, women have consistently reported higher levels of life satisfaction and worthwhile every year, but have also reported higher levels of anxiety since we first began collecting data in 2011. For ratings of happiness, the gap between men and women has narrowed and, in the years ending September 2015 and 2016, there was no significant difference between the two groups. However, in the year ending September 2017, women again reported higher levels of happiness.
Figure 2: Average personal well-being ratings for males and females, year ending September 2012 to year ending September 2017
Embed code
6. Which age groups have shown improvements in personal well-being?
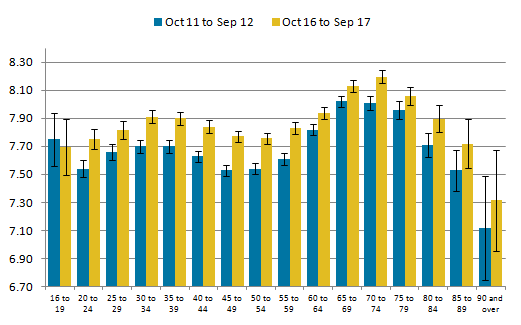
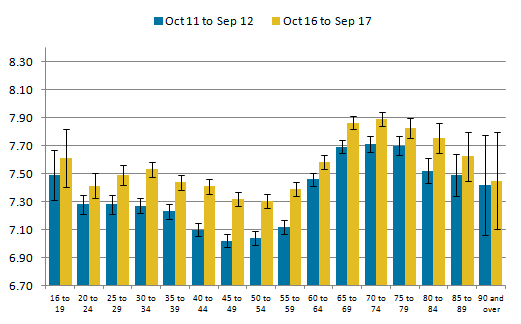
Between the years ending September 2016 and 2017, there were no significant changes for any of the four measures across the age groups. However, when looking at how personal well-being has changed since the first time point (year ending September 2012), there have been some improvements in each measure.
Ratings of life satisfaction, feeling that the things done in life are worthwhile and happiness all increased for those aged 25 to 74 years. The age groups that saw improving levels for all four measures of personal well-being over this time period were those aged 30 to 34, 40 to 59 and 65 to 69 years (as shown in Figures 3a to 3d).
Figure 3a: Average life satisfaction ratings across age groups, year ending September 2012 and year ending September 2017
UK

Source: Annual Population Survey, Office for National Statistics
Notes:
Chart axis does not start at 0.
95% confidence intervals are displayed on the chart as error bars.
Download this image Figure 3a: Average life satisfaction ratings across age groups, year ending September 2012 and year ending September 2017
.png (19.0 kB) .xlsx (12.3 kB)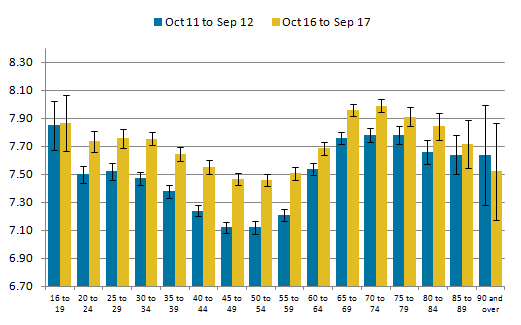
Figure 3b: Average worthwhile ratings across age groups, year ending September 2012 and year ending September 2017
UK
Source: Annual Population Survey, Office for National Statistics
Notes:
Chart axis does not start at 0.
95% confidence intervals are displayed on the chart as error bars.
Download this image Figure 3b: Average worthwhile ratings across age groups, year ending September 2012 and year ending September 2017
.png (21.0 kB) .xlsx (12.3 kB)
Figure 3c: Average happiness ratings across age groups, year ending September 2012 and year ending September 2017
UK
Source: Annual Population Survey, Office for National Statistics
Notes:
Chart axis does not start at 0.
95% confidence intervals are displayed on the chart as error bars.
Download this image Figure 3c: Average happiness ratings across age groups, year ending September 2012 and year ending September 2017
.png (17.5 kB) .xlsx (12.2 kB)
Figure 3d: Average anxiety ratings across age groups, year ending September 2012 and year ending September 2017
UK

Source: Annual Population Survey, Office for National Statistics
Notes:
Chart axis does not start at 0.
95% confidence intervals are displayed on the chart as error bars.
Download this image Figure 3d: Average anxiety ratings across age groups, year ending September 2012 and year ending September 2017
.png (19.5 kB) .xlsx (12.3 kB)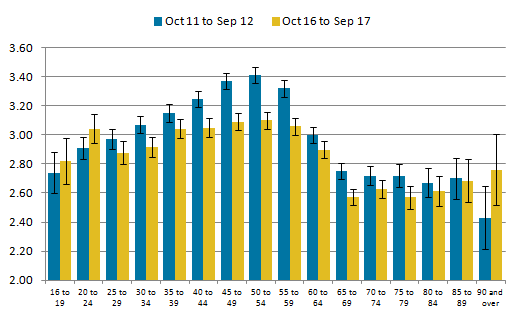
7. Fewer people reporting low levels of life satisfaction, worthwhile and happiness ratings since we began measuring personal well-being
Between the years ending September 2016 and 2017, there were no significant changes in the number of respondents reporting low levels of life satisfaction, feeling that the things done in life are worthwhile and happiness. The proportion rating their anxiety as high also did not change during this time period.
Figure 4, however, displays changes in the proportion of people reporting low levels of personal well-being between the years ending September 2012 and 2017. In the year ending September 2017, fewer people reported low levels of life satisfaction, worthwhile and happiness compared with the year ending September 2012. In addition to this, there was also a decrease in the proportion of people who reported high levels of anxiety over the same period.
Figure 4: Proportion of respondents reporting low ratings of life satisfaction, worthwhile and happiness and high ratings of anxiety, year ending September 2012 and year ending September 2017
UK
Source: Annual Population Survey, Office for National Statistics
Download this chart Figure 4: Proportion of respondents reporting low ratings of life satisfaction, worthwhile and happiness and high ratings of anxiety, year ending September 2012 and year ending September 2017
Image .csv .xls9. Quality and methodology
The Personal well-being in the UK Quality and Methodology Information report contains important information on:
the strengths and limitations of the data and how it compares with related data
uses and users of the data
how the output was created
the quality of the output including the accuracy of the data
How we measure personal well-being
Since 2011, we have asked personal well-being questions to adults aged 16 and over in the UK to better understand how they feel about their lives. This release presents headline results for the year ending September 2017, along with changes over the last five years. It provides data at a national level and country level. The four personal well-being questions are:
Overall, how satisfied are you with your life nowadays?
Overall, to what extent do you feel the things you do in your life are worthwhile?
Overall, how happy did you feel yesterday?
Overall, how anxious did you feel yesterday?
People are asked to respond on a scale of 0 to 10, where 0 is “not at all” and 10 is “completely”. We produce estimates of the mean ratings for all four personal well-being questions, as well as their distributions (as shown in Table 1).
For more information on personal well-being, please see the personal well-being user guide.
Table 1: Labelling of thresholds
| Life satisfaction, worthwhile and happiness scores | Anxiety scores | ||
|---|---|---|---|
| Response on an 11 point scale | Label | Response on an 11 point scale | Label |
| 0 to 4 | Low | 0 to 1 | Very low |
| 5 to 6 | Medium | 2 to 3 | Low |
| 7 to 8 | High | 4 to 5 | Medium |
| 9 to 10 | Very high | 6 to 10 | High |
| Source: Office for National Statistics | |||
Download this table Table 1: Labelling of thresholds
.xls (33.3 kB)Please note that:
any changes mentioned in this publication are “statistically significant”
the statistical significance of differences noted within the release are determined based on non-overlapping confidence intervals
comparisons have been based on unrounded data
We are able to compare with the same period last year (October 2015 to September 2016) to identify any changes that may have occurred. However, we are not able to reliably compare with the preceding period (July 2016 to June 2017) as they include overlapping time periods that contain the same data.
Personal well-being data are now included within the main Annual Population Survey (APS) dataset rather than released as a separate dataset. As part of this transition, personal well-being estimates now go through the regular APS re-weighting timetable. For the series published in this release, the estimates for the years ending September 2013 through to 2017 have been weighted to 2015 mid-year population estimates (MYPEs). For more information, please see Impact of transition to Annual Population Survey dataset.
Measuring national well-being
The four personal well-being questions are included as measures as part of the wider Measuring National Well-being (MNW) programme, which began in November 2010 with the aim to “develop and publish an accepted and trusted set of National Statistics, which help people understand and monitor well-being”.
We describe well-being as “how we are doing” as individuals, as communities and as a nation, and how sustainable this is for the future. The full set of 41 headline measures of national well-being are organised into 10 areas, such as health, where we live, what we do and our relationships. The measures include both objective data and subjective data.
Back to table of contents