Table of contents
- Main points
- Things you need to know about this release
- Super Output Area population estimates
- Clinical commissioning group population estimates (National Statistics)
- Westminster Parliamentary constituency population estimates (Experimental Statistics)
- Electoral ward population estimates (Experimental Statistics)
- National Park population estimates (Experimental Statistics)
- Small area population estimates for other UK countries
- Where can I find other information?
- Quality and methodology
1. Main points
There continues to be wide variation in the age structure of the population across England and Wales, with coastal and rural areas tending to have older populations than cities and urban areas; at the extremes in the coastal Lower layer Super Output Area (LSOA) of Eastbourne 012B, the median age was 70.9 years whereas in the urban LSOA of Salford 016E the median age was 14.8 years.
The proportion of people aged over 65 years living in areas served by different clinical commissioning groups (CCGs) in England ranged from 6.3% in Tower Hamlets to 29.9% in NHS North Norfolk (across England, 18.2% of the population are aged 65 years or over).
English Parliamentary constituencies tend to have larger populations than Welsh constituencies (averages of 105,023 and 78,466, respectively).
While the average electoral ward in England and Wales had a mean population of 7,140, population sizes ranged from 158 in St Martin’s ward in the Isles of Scilly to 36,945 in St Michael’s ward in Coventry.
2. Things you need to know about this release
This bulletin includes estimates for Lower layer and Middle layer Super Output Areas (LSOAs and MSOAs); Westminster Parliamentary constituencies; electoral wards; National Parks in England and Wales; and clinical commissioning groups (CCGs) in England.
There are two broad types of small area population estimates, both of which are included in this release.
The main products are the estimates for Super Output Areas (SOAs), which are based on the 2011 Census and rolled forward annually using a ratio change methodology. This approach uses the change in the population recorded in the GP Patient Register as an indicator of the change in the true population. Estimates for LSOAs by broad ages and MSOAs by quinary age groups (five-year age groups) hold National Statistics status. Estimates at a greater level of disaggregation by age including quinary age for LSOAs and single year of age for both SOAs are supporting information only. More information can be found in Small Area Population Estimates: Summary of methodology review and research update.
The remainder of the small area population estimates products relate to a range of different geographic areas and are derived directly from the SOA figures. First, estimates for LSOAs are broken down to Output Area (OA) level using an apportionment approach. These OA estimates are then aggregated to produce estimates for electoral wards and Westminster Parliamentary constituencies on a best-fit basis. Estimates for National Parks are also calculated from the OA-level data. Electoral wards, Westminster Parliamentary constituencies and National Parks all hold Experimental Statistics status. Estimates for health geographies are aggregated directly from LSOAs and hold National Statistics status.
Small area population estimates are used by both central government departments and local authorities for a range of purposes, including planning and monitoring of services and as denominators for the calculation of various rates and indicators. The Quality and Methodology Information (QMI) report has further information on the quality and use of these statistics.
Population estimates for LSOAs and MSOAs are often used for research and analysis as, unlike other small area geographies, such as electoral wards, they are specifically designed for statistical purposes. Electoral ward population estimates are of particular interest to local government organisations. Parliamentary constituency estimates are of importance to Parliamentary organisations, researchers and Members of Parliament (MPs). Population estimates by health geographies are widely used within the health sector, and information on National Parks is valuable to both local government and the various National Park authorities.
The mid-2018 small area population estimates covered by this bulletin are fully consistent with population estimates for higher levels of geography including local authorities, regions and the national total for England and Wales. A full description of the methods used to calculate all small area population estimates is available in the methodology guide.
In some local authorities, the number of people included in the GP Patient Register data in 2018 has increased or decreased in a large number of LSOAs and MSOAs compared with 2017 data, which may be because of changes in administrative practices or may reflect genuine population change. The process of constraining LSOA and MSOA estimates to previously published local authority population estimates means that this pattern is not automatically reflected in the mid-year estimates.
Mid-year population estimates for 2018 for England and Wales, regions within England, and local authorities within England and Wales were published on 26 June 2019. The estimates refer to the usually resident population on 30 June of the reference year and are published annually. In mid-2018, the population of England and Wales was 59,115,809, an increase of 0.6% since mid-2017 and 7.8% over the 10 years since mid-2008.
The population increase of 371,214 since mid-2017 was driven by net international migration of 260,175 and natural change (births minus deaths) of 121,961, and it was offset slightly by internal migration of -10,193 and Other changes of -729. The population of England and Wales is also ageing. Ageing of the population refers to both the increase in the average (median) age of the population and the increase in the number and proportion of older people in the population. The proportion of the population in England and Wales aged 65 years or over at mid 2018 was 18.3%, compared with 16.0% at mid-2008. Changes in the population of England and Wales are reflected in the changes at small area levels outlined throughout this bulletin.
Back to table of contents3. Super Output Area population estimates
Super Output Area (SOA) population estimates comprise:
National Statistics for Lower layer Super Output Areas (LSOAs) by broad age groups and Middle layer Super Output Areas (MSOAs) by quinary age groups
supporting information for estimates at a greater level of disaggregation by age, including quinary age for LSOAs and single year of age for both SOAs
The age structures of populations at a local level can vary widely indicating different requirements for public services provision, and median age provides a useful measure of this. Median age is the age that divides a population into two numerically equal groups (that is, half the people are younger than this age and half are older). The age structures of the 50 MSOAs with the highest median age and the 50 MSOAs with the lowest median age are shown in Figure 1.
In mid-2018, in the 50 MSOAs with the lowest median ages, 50.7% of the population were aged between 20 and 29 years and 4.5% were aged over 70 years. Conversely, in the 50 MSOAs with the highest median ages, 6.4% were aged between 20 and 29 years and 31.8% were aged 70 years or over. This pattern could reflect the movement of individuals in their early 20s to cities for work or study, with older people moving towards rural areas in retirement. More generally, these age structures are typical of many of the features of coastal populations and multicultural urban populations.
Figure 1: Comparison of MSOA population age structures for the 50 MSOAs with the highest and lowest median ages, mid-2018
Source: Office for National Statistics – Population estimates
Download this chart Figure 1: Comparison of MSOA population age structures for the 50 MSOAs with the highest and lowest median ages, mid-2018
Image .csv .xlsPopulations in coastal areas, National Parks and the South West have older age structures
While the median age of the population of England and Wales in mid-2018 was 40.0 years, the median age for LSOAs within England and Wales varied widely, from a high of 70.9 years in Eastbourne 012B to a low of 14.8 years in Salford 16E. Figure 2 shows that populations with the highest median age (that is, the top 5%) are concentrated around the coastal areas, National Parks and South West.
Figure 2: Lower layer Super Output Areas with the highest median age (top 5%), England and Wales, mid-2018

Source: Office for National Statistics – Population estimates
Download this image Figure 2: Lower layer Super Output Areas with the highest median age (top 5%), England and Wales, mid-2018
.png (299.1 kB)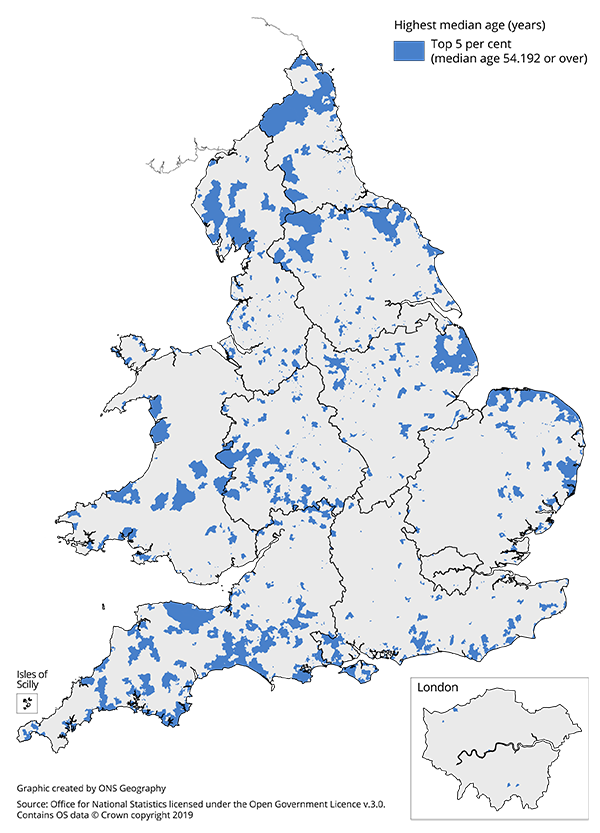
Figure 3 shows the percentage change in population between mid-2017 and mid-2018 for MSOAs in England and Wales. The pattern of growth exhibits many of the patterns of population change seen at the local authority level, with relatively large population increases in central London, particularly centered on the City of London, Westminster, Camden and Tower Hamlets. As with analysis at the local authority level, many of the areas of England and Wales experiencing population decreases are coastal or rural. However, analysis at MSOA level shows that there are areas across England and Wales that have seen their populations decrease. For example, our estimates suggest that in 309 of the 983 MSOAs in London, the population decreased between 2017 and 2018.
Figure 3: Percentage change in population by Middle layer Super Output Areas, England and Wales, mid-2017 to mid-2018

Source: Office for National Statistics – Population estimates
Download this image Figure 3: Percentage change in population by Middle layer Super Output Areas, England and Wales, mid-2017 to mid-2018
.png (514.1 kB)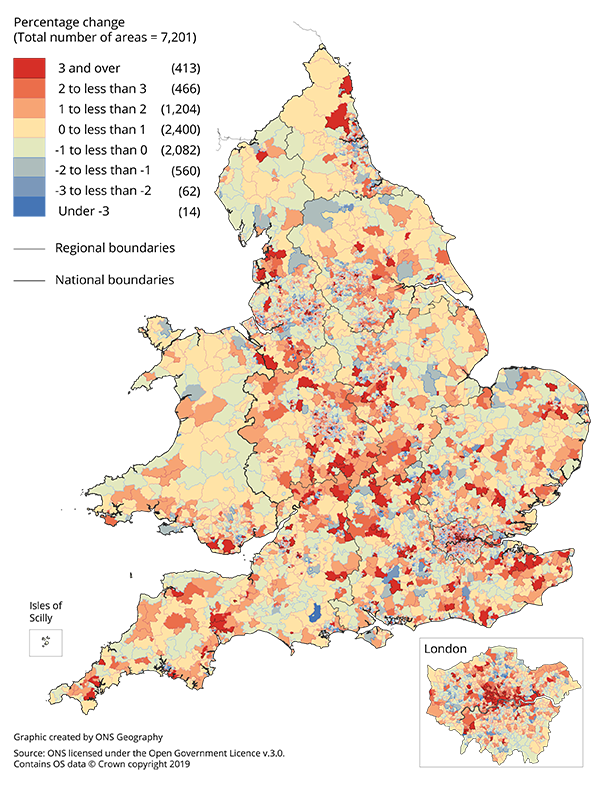
4. Clinical commissioning group population estimates (National Statistics)
Clinical commissioning groups (CCGs) are responsible for deciding how NHS funds are spent in their local area. They were introduced, for England only, by the Health and Social Care Act 2012 as part of a new structure for NHS organisation, which came into force on 1 April 2013.
CCGs replaced the former health geography areas, known as Primary Care Organisations (PCOs). Following a formal consultation, the Office for National Statistics (ONS) discontinued the production of population estimates for PCOs.
The mid-2018 CCG population estimates are direct aggregations of mid-2018 Lower layer Super Output Area (LSOA population estimates and are consistent with the population estimates for England. These estimates are classified as National Statistics.
CCGs are organised into the higher level of health geography of NHS England (Region, Local office) and NHS England (Region). These geographies are formed from groups of CCGs, and therefore population estimates for these areas are also created by directly aggregating LSOA estimates.
As of 1 April 2019, there were 191 CCGs, 14 NHS England Region, Local offices, and 7 NHS England Regions. At mid 2018, the mean population of CCGs was 293,074, with population sizes ranging from 70,827 in NHS Corby CCG to over 1.194 million in NHS Devon CCG.
Annual population change
Between mid-2017 and mid-2018, 5 of the 10 largest population increases were found in CCGs in London, with the biggest increase being NHS Central London (Westminster) CCG at 4.5%.
Only nine CCGs had population decreases between mid-2017 and mid-2018, with the greatest decreases being 0.4% in NHS Blackpool CCG and 0.3% in NHS Luton CCG.
Wide variation in age structure of population across CCGs
The age distribution of the resident population in a CCG is likely to impact on both the overall level of demand for health services and the type of health services required. Areas with a large percentage of older people in their population are likely to have different demands on health services than those with younger populations.
In mid-2018, the population aged 65 years or over in England was 18.2%. By comparison, the population in NHS North Norfolk CCG aged 65 years or over was 29.9%. Figure 4 shows the percentage of the population aged 65 years or over by CCG. CCGs in more rural and coastal areas tend to serve higher proportions of older people than those in London and other metropolitan areas. In mid-2018, the CCG with the lowest proportion of people aged 65 years or older was NHS Tower Hamlets CCG (6.3%).
Figure 4: Percentage of population aged 65 years or over, by clinical commissioning group, England, mid-2018

Source: Office for National Statistics – Population estimates
Download this image Figure 4: Percentage of population aged 65 years or over, by clinical commissioning group, England, mid-2018
.png (218.3 kB)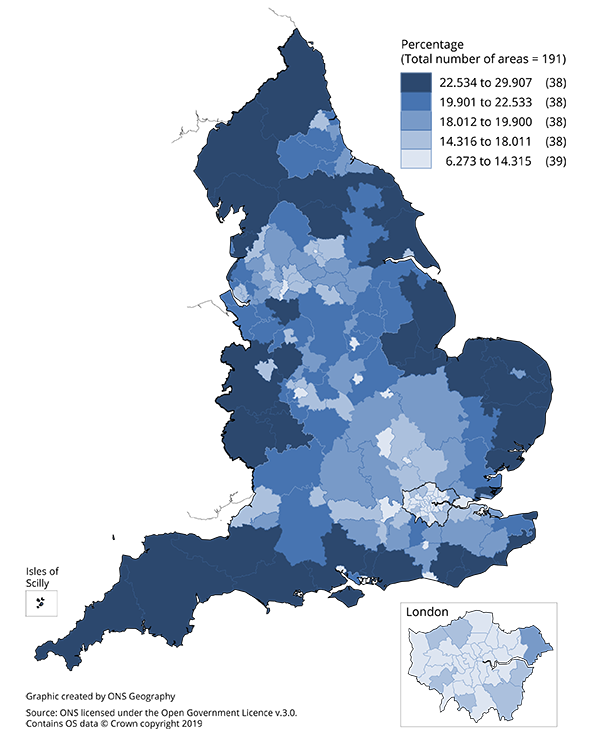
The percentage of the population who are children may also impact on requirements for health service provision. In mid-2018, the population of England aged 0 to 15 years was 19.2%. By comparison, 27.8% of the population in NHS Bradford City CCG were aged 0 to 15 years, closely followed by NHS Barking and Dagenham CCG (27.3%). Figure 5 shows the percentage of the population aged 0 to 15 years by CCG. It illustrates that CCGs with high proportions of children tend to be in more urban areas of England, while many rural and coastal areas have relatively low proportions of children.
Figure 5: Percentage of population aged 0 to 15 years, by clinical commissioning group, England, mid-2018
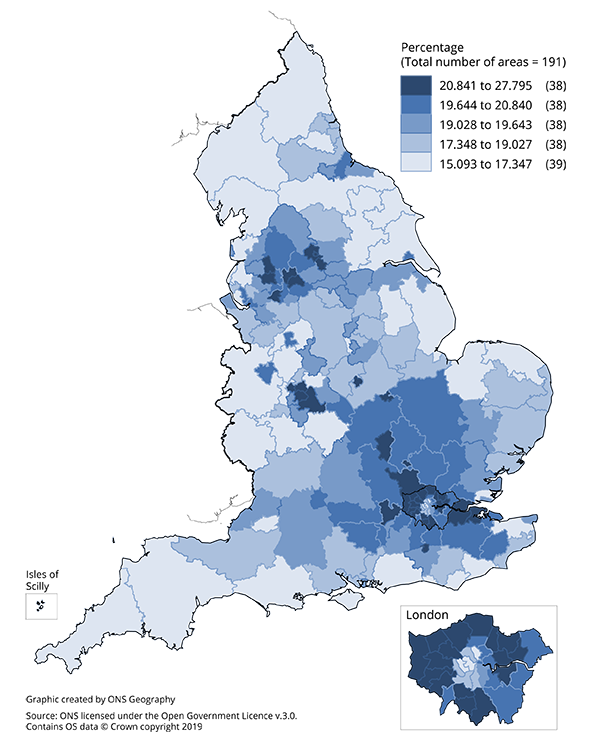
Source: Office for National Statistics – Population estimates
Download this image Figure 5: Percentage of population aged 0 to 15 years, by clinical commissioning group, England, mid-2018
.png (238.0 kB)
5. Westminster Parliamentary constituency population estimates (Experimental Statistics)
Westminster Parliamentary constituencies are the areas used to elect Members of Parliament (MPs) to the House of Commons, the primary legislative chamber of the UK. The current boundaries were introduced for the May 2010 General Election and include 533 constituencies in England and 40 in Wales. Parliamentary constituency estimates are classified as Experimental Statistics.
At mid-2018, the mean population of Parliamentary constituencies in England and Wales was 103,169, with population sizes ranging from 59,207 in Aberconwy to 188,275 in West Ham. On average, English constituencies have larger populations than Welsh constituencies, with mean populations of 105,023 and 78,466 respectively.
Annual population change
Between mid-2017 and mid-2018, 7 of the 10 largest population increases were found in London, including: Cities of London and Westminster (5.7%); Poplar and Limehouse (3.9%); and Westminster North (3.6%). The three constituencies outside London were: Sheffield Central (2.7%); Manchester Central (2.6%); and Liverpool Riverside (2.5%).
Population decreases at Parliamentary constituency level occurred across England and Wales, with two constituencies seeing a population decrease of 1% of more: Kingston upon Hull East (-1.0%) and Manchester, Withington (-1.6%).
Wide variation in age structure of population across Parliamentary constituencies
Figure 6 shows how the median age of the population varies across the 573 Parliamentary constituencies in England and Wales. In London and most other urban areas across England and Wales, the median age tends to be lower than in the more rural and coastal areas. In 2018, Cardiff Central had the lowest median age (just over 26 years) and North Norfolk had the highest median age (above 54 years).
Figure 6: Median age of population by Westminster Parliamentary constituency, England and Wales, mid-2018

Source: Office for National Statistics – Population estimates
Download this image Figure 6: Median age of population by Westminster Parliamentary constituency, England and Wales, mid-2018
.png (375.9 kB)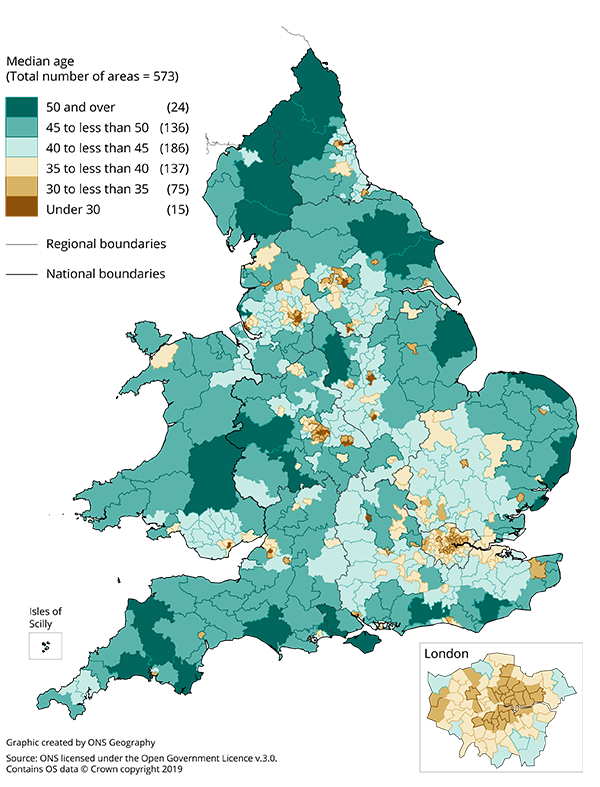
Voting age
In England and Wales in mid-2018, there were 46,531,406 persons aged 18 years and over, making up 78.7% of the total usually resident population. At mid-2018, at Parliamentary constituency level, the percentage of the population aged 18 years and over ranged from 67.1% in Birmingham, Hodge Hill to 87.0% in Liverpool, Riverside.
The population of voting age in a Parliamentary constituency is not the same as the population who are entitled to vote, as it includes people who are not eligible to vote. For example, EU citizens (excluding British citizens and Irish, Cypriot and Maltese citizens who are qualifying Commonwealth citizens) are not entitled to vote in Westminster Parliamentary elections but are entitled to vote in local elections and are included in the population estimates if they are resident in the UK for 12 months or more.
Electoral statistics, providing counts of the number of persons registered to vote in each Parliamentary constituency, are available.
Back to table of contents6. Electoral ward population estimates (Experimental Statistics)
Electoral wards are an important building block of UK administrative geography. They are the spatial units used to elect local government councillors in metropolitan and non-metropolitan districts, unitary authorities and London boroughs in England, and unitary authorities in Wales. In some unitary authorities in England, they are legally termed as “electoral divisions”, but they are frequently referred to as “wards” and are referenced as such throughout this bulletin. The five parishes of the Isles of Scilly are also treated as electoral wards for statistical purposes.
Electoral wards are subject to annual updates and boundary changes that make comparisons over longer periods more difficult. Mid-2018 population estimates are provided for 8,280 electoral wards in England and Wales as at 31 December 2018, excluding the 18 wards that do not meet the minimum population requirements for data confidentiality (40 resident households and 100 resident people in the 2011 Census). Electoral ward estimates are classified as Experimental Statistics.
At mid-2018, the mean population of wards in England and Wales was 7,140. However, population sizes vary widely across the country ranging from 158 in St Martin’s ward in the Isles of Scilly to 36,945 in St Michael’s ward in Coventry. On average, wards in England have larger populations than those in Wales, with mean populations of 7,536 and 3,684, respectively. Figure 7 shows that 57.6% of electoral wards in Wales have populations of less than 3,000, compared with 15.1% of wards in England, and a further 21.9% of wards in England have populations of 11,000 or higher compared with 3.5% of wards in Wales.
Figure 7: Size distribution of electoral wards in England and Wales, mid-2018
Source: Office for National Statistics – Population estimates
Download this chart Figure 7: Size distribution of electoral wards in England and Wales, mid-2018
Image .csv .xls7. National Park population estimates (Experimental Statistics)
National Parks are designated areas of protected countryside aimed at conserving the natural beauty, wildlife and cultural heritage of the area. Each National Park has a National Park Authority (NPA) responsible for conservation, planning, recreation management, and fostering the social and economic well-being of local communities.
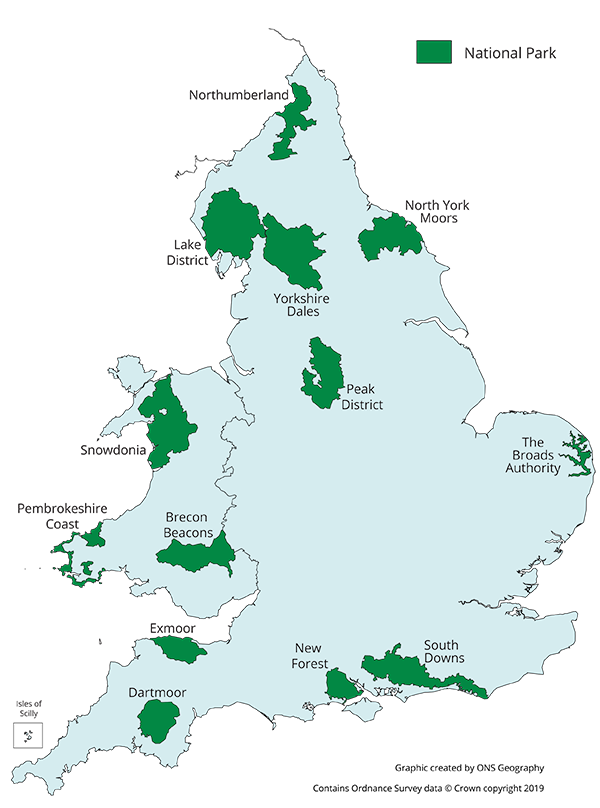
The Broads Authority does not have a National Park designation but is included in this set of statistics, as it is part of the National Parks family. The Broads Authority has similar responsibilities to NPAs but with additional powers relating to navigation. In total, there are 13 National Parks in England and Wales (including The Broads Authority) (Figure 8).
National Park population estimates are classified as Experimental Statistics.
Figure 8: National Parks in England and Wales
Source: Office for National Statistics – Population estimates
Download this image Figure 8: National Parks in England and Wales
.png (170.5 kB)
National Parks have an older age structure than the wider population of England and Wales. At mid 2018, the median age for National Parks within England and Wales varied from 48.9 years in the South Downs to 57.3 years in Exmoor. In contrast, the median age for England and Wales was 40.0 years.
Table 1 gives a summary of the main features of National Park populations. It shows that all 13 National Parks have a larger proportion of the population aged 65 years or over and a smaller proportion of the population aged 0 to 15 years than England and Wales as a whole. At mid-2018, the population of England and Wales aged 65 years or over was 18.3%, compared with 35.2% in Exmoor and 34.3% in The Broads Authority. Conversely, 19.1% of the population in England and Wales were aged 0 to 15 years, compared with only 10.9% in The Broads Authority and 11.4% in Exmoor.
| Population | Population Density (km² ) | Median age | % aged 65 and over | % aged 15 and under | |
|---|---|---|---|---|---|
| Dartmoor National Park | 34,307 | 36 | 51.8 | 27.6 | 15.0 |
| Exmoor National Park | 10,275 | 15 | 57.3 | 35.2 | 11.4 |
| Northumberland National Park | 1,945 | 2 | 52.6 | 24.7 | 13.5 |
| North York Moors National Park | 22,936 | 16 | 54.2 | 30.5 | 13.4 |
| Peak District National Park | 37,015 | 26 | 53.1 | 28.9 | 14.0 |
| The Broads Authority | 6,551 | 23 | 56.0 | 34.3 | 10.9 |
| New Forest National Park | 35,345 | 64 | 54.4 | 32.2 | 13.7 |
| South Downs National Park | 117,832 | 71 | 48.9 | 25.3 | 17.4 |
| Lake District National Park | 40,278 | 18 | 52.9 | 29.6 | 12.8 |
| Yorkshire Dales National Park | 23,557 | 11 | 54.4 | 31.4 | 12.8 |
| Brecon Beacons National Park | 33,812 | 25 | 50.7 | 27.5 | 15.4 |
| Pembrokeshire Coast National Park | 22,350 | 38 | 54.2 | 32.0 | 13.5 |
| Snowdonia National Park | 25,370 | 12 | 51.7 | 28.7 | 14.4 |
| England and Wales | 59,115,809 | 391 | 40.0 | 18.3 | 19.1 |
Download this table Table 1: National Park population summary, England and Wales, mid-2018
.xls .csvPopulation density (that is, the number of people living in an area per square kilometre) can be used to highlight how sparsely populated National Parks are in comparison with more urban population settlements. At mid-2018, the population density of England and Wales was 391 persons per square kilometre. Northumberland National Park is the most sparsely populated area, with a population density of 2 persons per square kilometre and the South Downs is the most densely populated area with 71 persons per square kilometre.
Back to table of contents8. Small area population estimates for other UK countries
Population estimates are produced for similar small areas in both Scotland and Northern Ireland. However, they are not produced using the same methodology as for small area population estimates in England and Wales.
National Records of Scotland (NRS) produces population estimates for Scottish data zones, which are slightly smaller areas than Lower layer Super Output Areas (LSOAs), designed to contain approximately 500 to 1,000 household residents. NRS uses a cohort component-based method to produce estimates for data zones. Further information on this methodology and the latest estimates for Scotland (for mid-2018) are available from their website.
The Scottish data zones are used to produce population estimates for a range of other geographies including Westminster Parliamentary constituencies in Scotland, Scottish Parliamentary constituencies and Nomenclature of Units for Territorial Statistics (the statistical geography used by the EU). These figures are available from the Special Area Population Estimates section of the NRS website.
The Northern Ireland Statistics and Research Agency (NISRA) publishes population estimates for Super Output Areas (SOAs) in Northern Ireland. These are of similar size to English and Welsh LSOAs, with an average population of 2,100. NISRA uses a mixed methodology based on both cohort component and ratio change approaches. Further information and the latest estimates for Northern Ireland published for mid-2017 are available from the NISRA website. Population estimates for wards, Neighbourhood Renewal Areas and Census Small Areas in Northern Ireland are also available.
Small Area Population Estimates across the UK provides a broad description of the different methodologies used to produce small area population estimates in each constituent country of the UK.
Back to table of contents9. Where can I find other information?
This statistical bulletin is part of our Population estimates by output area, electoral, health and other geographies, England and Wales: mid-2018. The publication includes:
population estimates for Lower and Middle layer Super Output Areas (LSOAs and MSOAs) in England and Wales; estimates for LSOAs by broad ages and MSOAs by quinary age groups (five-year age groups) hold National Statistics status; estimates at a greater level of disaggregation by age including quinary age for LSOAs and single year of age for both Super Output Areas (SOAs) are supporting information only; more information can be found in Small Area Population Estimates: Summary of methodology review and research update
population estimates for electoral wards, Westminster Parliamentary constituencies, and National Parks in England and Wales (these products are classified as Experimental Statistics)
population estimates for health geographies in England, clinical commissioning groups (CCGs), NHS England (Region, Local office); and NHS England (Region); these products are also classified as National Statistics
These estimates are consistent with the results of the 2011 Census and are provided for the latest official geographic boundaries in place at the time of publication.
Other related statistics:
mid-2018 population estimates for small area geographies in England and Wales, available from the data section of this release
mid-2018 population estimates for the UK and its constituent countries, regions and local authorities
News on our population statistics can be obtained by subscribing to the quarterly newsletter (email your request to population.statistics@ons.gov.uk) or following the Twitter account @RichPereira_ONS.
Provision of data not already published may require bespoke analysis, and this service would be subject to legal frameworks, disclosure control, resources and agreements of costs, where appropriate. Please email your request to pop.info@ons.gov.uk. The latest charging rates can be found on the Office for National Statistics (ONS) website.
Back to table of contents
10. Quality and methodology
The Small area population estimates Quality and Methodology Information (QMI) report contains important information on:
the strengths and limitations of the data
the quality of the output: including the accuracy of the data and how it compares with related data
uses and users
how the output was created
A Methodology note on production of small area population estimates details the data sources and methodology used to produce the England and Wales small area population estimates.
Transformation of population statistics
It is our mission to provide the best insights on population and migration using a range of new and existing data sources to meet the needs of our users. Our ambition is to deliver a fully transformed system by 2023, making regular improvements to our statistics along the way as more administrative data become available. We will rigorously quality assure new methods and share the impact of any changes made. The Transformation of the population and migration statistics system: overview gives more information on this work. The resulting improvements will also be incorporated into future editions of population estimates.
Small Area Population Estimates (SAPE) Evaluation: Report on Accuracy Compared to Results of the 2011 Census presents research that evaluates the accuracy of the small area population estimates to inform their broad variety of users. The report also fulfils the commitment to analysis planned after the 2011 Census.
The Office for National Statistics (ONS) Revisions policies on population statistics, including the small area population estimates, explains how we implement and categorise revisions to statistics, including following a census.
Back to table of contents