Table of contents
- Summary of methods
- Overview of currently available estimates
- Population definition
- Methods
- Limitations of the estimates
- Further information and contacts
- Appendix A: Methodology used in census years
- Appendix B: Methodology used to produce revised estimates, mid-2002 to mid-2010
- Appendix C: Administrative datasets used in production of small area estimates
- Appendix D: Simplified ratio change methodology diagram for production of SOA estimates
- Appendix E: Sub-threshold wards
- Appendix F: Small area population estimates revisions history
1. Summary of methods
Super Output Area and Output Area population estimates
Super Output Area (SOA) estimates are produced using a ratio change methodology. This method uses change in the population recorded in administrative sources as an indicator of change in the true population, and it is used to produce SOA estimates in intercensal periods. For consistency, Lower layer Super Output Area (LSOA) mid-year population estimates are constrained to Middle layer Super Output Area (MSOA) estimates, which in turn are constrained to local authority estimates.
LSOA population estimates are the starting point for calculating Output Area (OA) estimates. Administrative data sources are used to distribute the population, by single year of age and sex, between each OA within a single LSOA. Special populations (for example, prisoners and armed forces) are treated separately as they are static populations that are not included in the administrative data sources used to calculate OA estimates.
Further detail on the production of these estimates is given in Production of Super Output Area population estimates and Production of Output Area population estimates in Section 4.
Health geography population estimates
Clinical Commissioning Group (CCG), NHS England (Region, Local Office) and NHS England (Region) population estimates are direct aggregations of LSOA estimates and therefore no detailed method is required for their production.
Further detail is given in Production of health geography estimates in Section 4.
Ward and Parliamentary constituency estimates
Ward and Parliamentary constituency population estimates are based on aggregations of whole OA estimates. OA boundaries are not an exact fit (non-coterminous) for current ward or Parliamentary constituency boundaries and are therefore allocated using a best-fit approach.
Further detail is given in Production of ward and Parliamentary constituency estimates in Section 4.
National Park estimates
National Park population estimates are provided for the exact boundaries of the National Park and therefore cannot be produced by aggregating whole OA estimates. The estimates are produced using a ratio change methodology that uses changes in the population of the wider area around the National Park (based on aggregations of OAs) as an indicator of the change in the true population of the National Park.
Further detail is given in Production of National Park estimates in Section 4.
Back to table of contents2. Overview of currently available estimates
The Office for National Statistics (ONS) produces estimates of the resident population of England and Wales. The most authoritative population estimates are produced every 10 years and are based on the results of the latest census. These are updated annually to produce mid-year population estimates in the intercensal period (referred to as “rolled forward” estimates). The population estimates give a stock count of people living in England, Wales, the regions of England and local authority areas, and the composition of the population in these areas by age and sex. Further population statistics, including migration estimates, vital events (covering births, deaths, marriages and divorces) and population projections are also available. Detailed results from the 2011 Census are also available and provide information on the characteristics of the usually resident population, for example, ethnicity and country of birth or marital status, for small areas.
Additionally, the ONS produces population estimates for small areas within England and Wales:
National Statistics – Middle layer Super Output Areas (MSOAs) at quinary ages, Lower layer Super Output Areas (LSOAs) at broad ages and health geographies1
Experimental Statistics – wards, Parliamentary constituencies and National Parks
Supporting Information – Output Areas (OAs), MSOAs by single year of age, LSOAs by single year of age and quinary ages
Small area population estimates for mid-2001 to mid-2019 Super Output Areas (SOAs) have been produced on 2011 Census boundaries. Mid-2002 to mid-2011 estimates for wards, Parliamentary constituencies, health geographies and National Parks have been published on boundaries available when they were published following census rebasing. The revised set of estimates for wards, Parliamentary constituencies, health geographies and National Parks have been published on the boundaries in place as at June 2019. Geography information on SOAs, OAs, wards, Parliamentary constituencies and Clinical Commissioning Groups (CCGs) can be found on our archive website.
Estimates have also been produced for mid-2001 to mid-2019 OAs as these are the building blocks used to form estimates for wards and Parliamentary constituencies.
Small area population estimates are produced using the best methods and data sources currently available. The 2011 Census has provided an opportunity to benchmark these estimates against census data and to analyse the level of accuracy that has been achieved. A report entitled Small Area Population Estimates (SAPE) Evaluation: Report on Accuracy Compared to Results of the 2011 Census compared “rolled forward” SOA estimates for mid-2011 (based on 2001 Census data) with 2011 Census-based SOA estimates for mid-2011 and was published on 6 November 2015. This analysis will identify how well the ratio change methodology has performed in estimating small area populations over the intercensal period.
Notes for: Overview of currently available estimates
- This includes Clinical Commissioning Groups (CCGs), NHS England (Region, Local Office) and NHS England (Region). Note estimates for former health geography areas (primary care organisations) are available for mid-2002 to mid-2012 but were discontinued from mid-2013 onwards, following a formal consultation procedure.
3. Population definition
The population base from the 2011 Census underpins the mid-year population estimates base and is defined as follows:
“The 2011 Census was conducted on a resident basis. This means the statistics relate to where people usually live, as opposed to where they are on census night. Students and school children studying away from home are counted as resident at their term-time address. Wholly absent households were legally required to complete a census form on their return. No information is provided on people present but not usually resident.”
The definition of the population used in the small area estimates is consistent with that used for the published local authority mid-year estimates. These are broadly consistent with the definition used for the 2011 Census, although there are some minor differences in the treatment of armed forces.
In order to ensure that members of the armed forces were enumerated consistently, the 2011 Census was designed so that members of the armed forces were enumerated at their “permanent or family home” (this is considered to be their usual residence for census purposes). The mid-year estimates’ definition of usual residence for armed forces is different as it may be either their “permanent or family home” or the armed forces base, depending on individual circumstances. For the purposes of calculating mid-year population estimates, an adjustment has been applied to the 2011 Census data at Output Area (OA) level to reallocate members of the home armed forces from their “permanent or family home” to their place of residence at the armed forces base, where these are different.
The allocation of prisons differs from the 2011 Census allocation of prisons in a small number of areas. In the mid-year estimates at Lower layer Super Output Area (LSOA)-level prisoners are allocated to the LSOA in which the majority of the prison falls.
In practice, when producing a population estimate, a number of data sources have to be used, each with its own definition of usual residence. Further detail on the administrative datasets used to produce small area population estimates can be found in Appendix C.
Back to table of contents4. Methods
This section details the ratio change (Super Output Area (SOA)) and apportionment approach (Output Area (OA)) methodologies used to produce small area population estimates in intercensal years. In a census year, population estimates are produced from census estimates and are aged forward and adjusted to account for differences between census day and the mid-year (30 June) and usual residence definitions. Following a census, rolled-forward estimates for the intercensal years are revised to account for population change over this period and to provide a consistent time series of population estimates. More details on the one-off methods used to produce estimates in census years and make the revisions to the estimates for the period mid-2002 to mid-2010 are included in Appendix A and Appendix B respectively.
Production of Super Output Area population estimates
The estimates for mid-2019 were produced using a ratio change methodology. Prior to the mid-2013 estimates, a number of different administrative datasets were used in the production of these estimates and these are documented in Appendix C. From mid-2013 onwards, only the patient register data was used.
The description of the methodology in the following sections uses the example of creating rolled-forward mid-2019 Lower layer Super Output Area (LSOA) estimates. For example, we produced the mid-2019 LSOA estimates using the mid-2018 LSOA estimates as the population base.
Middle layer Super Output Area (MSOA) estimates are created in a similar manner using derived MSOA quinary age-by-sex change ratios and are constrained to local authority mid-year estimates.
Step-by-step guide to methodology
The estimates were produced by applying the ratio change method to an LSOA estimate of the population base (the mid-2017 LSOA estimates) using patient register data. In previous years, a combination of patient register and Child Benefit data was used. However, Child Benefit data could not be used from mid-2013 because of the impact of the government policy introduced in 2013 to restrict the availability of Child Benefit depending on family income. This issue is discussed in more detail in the Quality and Methodology Information (QMI) report.
Before applying these change ratios, some population counts are subtracted (referred to as the special population). These comprise UK armed forces, foreign armed forces and dependants, and prisoners. They are added again after these counts are constrained to the 2019 local authority mid-year estimates minus the special population.
The main assumption behind this ratio change method is that for each area, the data should have a consistent relationship with the true population over time.
Change ratios were calculated by quinary age group and sex for the patient register data. The change ratios are calculated by dividing for each dataset the mid-2019 count by quinary age and sex by the mid-2018 count by quinary age and sex. For example, a mid-2019 count of 50 divided by a mid-2018 count of 40 gives a change ratio of 1.25.
For the original publication of mid-2013 and all subsequent releases, all age groups are covered by a single dataset (patient register); the LSOA change ratios for quinary age groups and sex in previous years are as follows:
- 0 to 4, 5 to 9 and 10 to 14 – Child Benefit data and patient registers
- 15 to 19 to 90 and over – Patient registers
In summary:
The ratios are then applied to the mid-2018 LSOA population minus the mid-2018 special population by quinary age and sex.
The ratios are then constrained to the mid-2019 MSOA estimates (less mid-2019 special population), which have been constrained to the local authority mid-2019 estimates less mid-2019 special population.
The mid-2019 LSOA estimates by single year of age and sex are produced by apportioning the quinary age counts to single year of age using mid-2018 local authority constrained patient register single year of age and sex counts.
The mid-2019 LSOA estimates by single year of age and sex are then constrained for consistency to mid-2019 MSOA estimates by single year of age and sex (these counts are derived from mid-2019 MSOA quinary age and sex estimates created using the same ratio change methodology as for LSOAs, apportioned to single year of age and sex using mid-2019 local authority constrained patient register counts by single year of age and sex).
Updated mid-2019 special population counts are then added back in to the quinary and single year of age and sex counts, to give mid-2019 LSOA estimates by quinary and single year of age and sex.
Where two change ratios were produced for some of the age groups to reflect the availability of two datasets for these age groups, the change ratios were averaged by adding together the two ratios and dividing by two.
Any change ratios produced for counts containing a zero by quinary age and sex were changed to one to ensure a valid ratio was produced. Where change ratios were applied to a base population by quinary age and sex of zero, the base population was changed to one to ensure an actual population count in the estimate, otherwise counts of zero in the base population would forever remain at zero.
Where SOA data for any of the datasets were identified to be erroneous, the calculated change ratios were updated to correct for identified errors. Criteria were developed to assist in the consideration of making any changes to the originally calculated change ratios.
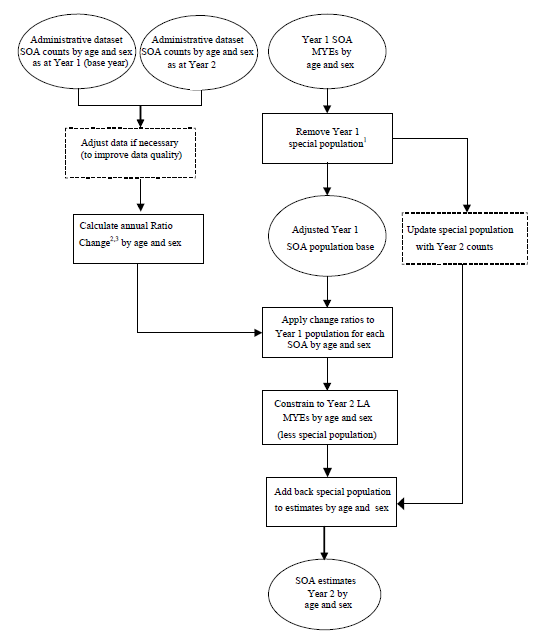
An illustrative diagram of the ratio change method is shown in Appendix D.
Production of Output Area population estimates
OA estimates by age and sex are the building blocks used to form estimates for wards and Parliamentary constituencies using a best-fit method (PDF, 410KB). OA estimates are consistent with estimates for higher geographies, such as SOAs, local authorities, and the national total for England and Wales. The description of the methodology that follows uses the example of creating rolled-forward mid-2019 OA estimates.
Step-by-step guide to methodology
Mid-2019 LSOAs are the starting point for calculating mid-2019 OA estimates. OA estimates are produced using an apportionment approach. The following stages are followed to produce mid-2019 OA estimates:
1. Create mid-2019 LSOA estimates, by single year of age and sex.
2. Remove special populations.
Special populations (prisoners and armed forces) are removed from the mid-2019 LSOA estimates. These populations are treated separately as they are static populations, at known locations, that are not included in the administrative data sources used to calculate OA estimates.
3. Apply patient register distribution.
The distribution of population between each OA in a single LSOA can be determined from administrative data sources. The number of patients registered on GP lists in each OA at the mid-year point is used as a proxy for the true size of the population at the same point in time.
For example:
LSOA x, made up from five OAs x1,…, x5, has 20 males aged 0 years and 15 females aged 0 years at mid-2019. The patient register distribution of 0-year-olds across the five OAs x1,…, x5 is shown in Table 1.
| OA | Males aged 0 | Females aged 0 | ||
|---|---|---|---|---|
| Count | % | Count | % | |
| x1 | 6 | 20 | 2 | 10 |
| x2 | 3 | 10 | 4 | 20 |
| x3 | 6 | 20 | 5 | 25 |
| x4 | 12 | 40 | 8 | 40 |
| x5 | 3 | 10 | 1 | 5 |
| Total | 30 | 100 | 20 | 100 |
Download this table Table 1: Patient register distribution
.xls .csvThe mid-2019 estimates for 0-year-olds in the five OAs are therefore given by the percentages shown in Table 1 multiplied by the mid-2019 estimate for the parent LSOA. The example results are shown in Table 2.
| OA | Males aged 0 | Females aged 0 | ||||
|---|---|---|---|---|---|---|
| LSOA Total | % | OA Total | LSOA Total | % | OA Total | |
| x1 | 20 | 20 | 4 | 15 | 10 | 1.5 |
| x2 | 20 | 10 | 2 | 15 | 20 | 3 |
| x3 | 20 | 20 | 4 | 15 | 25 | 3.75 |
| x4 | 20 | 40 | 8 | 15 | 40 | 6 |
| x5 | 20 | 10 | 2 | 15 | 5 | 0.75 |
Download this table Table 2: Example results
.xls .csv4. Rounding and constraining
The resulting estimates for each Output Area (OA) by single year of age and sex are then rounded to ensure estimates of whole persons and constrained to the mid-2019 Lower layer Super Output Area (LSOA) estimates by single year of age and sex. This process ensures that these estimates are fully consistent with mid-year population estimates for all higher geographies.
Production of health geography estimates
The Health and Social Care Act 2012 introduced a new structure for NHS organisation that replaced primary care organisations (PCOs) with Clinical Commissioning Groups (CCGs) from 1 April 2013. CCG areas are formed from groups of LSOAs and therefore CCG population estimates are created by directly aggregating LSOA estimates.
CCGs are organised into the higher level of health geography of NHS England (Region, Local office) (up to 1 April 2020), Sustainability Transformation Partnerships (STP) (from 1 April 2020) and NHS England (Region). These geographies are formed from groups of CCGs and therefore population estimates for these areas are also created by directly aggregating LSOA estimates.
In April 2020, 14 NHS England (Region, Local Offices) were replaced by 42 sustainability and transformation partnerships (STPs) as the Higher Level Health Authority in organisation reference data (ORD). As these geographies are formed from groups of CCGs and population estimates for these areas are also created by directly aggregating LSOA estimates.
Production of ward and Parliamentary constituency estimates
Mid-year OA estimates are directly aggregated to produce ward and Parliamentary constituency estimates by single year of age and sex. This is achieved by using the published OA-to-ward and OA-to-Parliamentary-constituency geography lookups, which are available from the Open Geography Portal. Current estimates are published on 2019 ward boundaries and 2010 Westminster Parliamentary constituency boundaries. These lookups allocate OAs to higher-level geographies using a best-fitting method (PDF, 410KB). For each OA, a single fixed point is established that represents how the population is spatially distributed within the OA. These points are called population-weighted centroids and are calculated algorithmically based on 2011 Census estimates. The allocation of OAs to wards and Parliamentary constituencies is based on where this point falls. Prior to 2011, ward and Parliamentary constituency estimates were produced using a postcode best-fit method. Further details on this method are available under methods and guidance on our archive website.
In England and Wales, there were 8,071 electoral wards as at 31 December 2019. Of these, 18 are sub-threshold wards that do not meet the minimum population requirements for data confidentiality (40 resident households and 100 resident people in the 2011 Census). As these are smaller than OAs, they will not have separate OA estimates attached to them. In these cases, neighbouring wards have assumed the populations as detailed in Appendix E. More information on sub-threshold wards can be found in the best-fit policy (PDF, 410KB) document.
Production of National Park estimates
The Office for National Statistics (ONS) Geography policy states that statistics for higher-level geographies should be built from OA statistics using a “best-fit” allocation. National Parks are an exception to this, as they cannot be suitably estimated through best-fitting of OAs. As such, estimates for National Parks for the 2011 Census were produced on an exact-fit basis; however, this process cannot be repeated for mid-year population estimates.
Estimates for mid-2011 onwards
The production method for National Park estimates is a two-stage process. The first stage rolls forward the estimates for a set of ad hoc age and sex groups1 (as per those used for the publication of 2011 Census data). The second stage rolls forward estimates by single year of age and sex and constrains these to the broader ad hoc age and sex group estimates produced in the first stage.
A ratio change method was used to roll forward the published 2011 Census National Park estimates (by the ad hoc age and sex groups) to produce mid-2011 estimates. This approach uses the population growth of the wider National Park area as a proxy for the change within the National Park boundary. These wider areas are the groups of OAs that have postcodes lying within National Park boundaries (for example, Figure 1), as determined by the National Statistics Postcode Lookup (NSPL, August 2013).
Figure 1: Output Areas within Exmoor National Park

Source: Office for National Statistics – Methodology note
Download this image Figure 1: Output Areas within Exmoor National Park
.png (68.5 kB)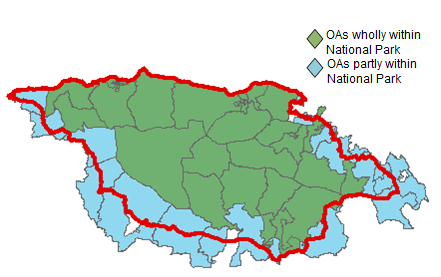
The same approach was then used to roll forward mid-2011 estimates to produce mid-2012 estimates (and to roll forward mid-2012 estimates to produce mid-2013 estimates).
Subsequent to the publication of mid-2011 and mid-2012 estimates, a method was devised to use more detailed 2011 Census data to produce estimates by sex and single year of age. This method included additional steps to ensure additivity to the published broader estimates. For consistency, this two-stage production process has been continued for mid-2013 to mid-2019, although only the single year of age and sex estimates have been published (as the broader estimates can be obtained by aggregating the single year of age and sex data).
Step-by-step guide to methodology
Stage 1 – Estimates for broader ad hoc age groups
The following stages are followed to carry out the ratio change methodology to produce the National Park population estimates for each year. The example given is for producing mid-2011 rolled forward from the 2011 Census, but the process is analogous for all years.
1. Create wider National Park areas from OAs.
The NSPL (August 2013) lists all current and previous postcodes and the higher geographies in which they are deemed to lie. This is used to create a lookup of OAs that fall wholly or partly within National Parks to form wider-National Park areas.
2. Calculate proportional change for rolling forward.
Population estimates for these wider areas are created for the 2011 Census and mid-2011 by aggregating the OA estimates for those periods. The aggregations are kept consistent with the 2011 Census National Park published estimates: persons; males; females; age group (0 to 4, 5 to 7, 8 to 9, 10 to 14, 15, 16 to 17, 18 to 19, 20 to 24, 25 to 29, 30 to 44, 45 to 59, 60 to 64, 65 to 74, 75 to 84, 85 to 89 years, and 90 years and over). The proportional population change for each group is calculated for each area. That is,
change (persons) = mid-2011 (persons) / census (persons) change (males) = mid-2011(males) / census (males) change (18 to 19) = mid-2011(18 to 19) / census (18 to 19)
This change is then applied to the 2011 Census National Park estimates to produce unrounded and unconstrained mid-2011 National Park estimates. That is,
mid-2011 National Park (persons) = 2011 Census National Park (persons) * change (persons)
3. Constraining.
The resulting estimates by sex and age group will not sum to the persons totals and therefore need constraining. First, the persons data is rounded to the nearest integer; the estimates by sex are then constrained to persons totals; and the estimates by age group are then constrained to persons totals.
4. Rounding.
The unrounded sex and age group estimates are then rounded to the nearest integer and constrained to ensure consistency with the persons totals.
Stage 2 – Estimates by single year of age and sex
Mid-2011
1. Fitting.
Owing to the proximity of the 2011 Census to mid-2011, it was decided that the 2011 Census National Park estimates by sex and single year of age would not be rolled forward by ratio change but would themselves be fitted to the mid-2011 published broader estimates using Iterative Proportional Fitting (IPF).
2. Rounding.
The unrounded estimates are then rounded to the nearest integer while maintaining previous totals.
Mid-2012 (and onwards)
1. Calculate proportional change for rolling forward.
Population estimates for these wider areas are created for mid-2011 and mid-2012 by aggregating the OA estimates (by single year of age and sex) for those periods.
The proportional population change for each group is calculated for each area. That is,
change (males aged zero years) = mid-2012 (males aged zero years) / mid-2011 (males aged zero years)
This change is then applied to the mid-2011 National Park estimates to produce unrounded and unconstrained mid-2012 National Park estimates. That is,
mid-2012 National Park (males aged zero years) = mid-2011 National Park (males aged zero years) * change (males aged zero years)
2. Fitting.
The resulting estimates by sex and age group do not sum exactly to the broader estimates and were fitted to these using IPF.
3. Rounding.
The unrounded sex estimates are then rounded to the nearest integer while maintaining previous totals.
Mid-2016 estimates for Yorkshire Dales National Park and Lake District National Park
In August 2016, the boundaries of the Yorkshire Dales and Lake District National Parks were extended, and the 2016 population estimates for these two areas reflect the population within the new boundaries.
National Park population estimates are provided for the exact boundaries of the National Park and therefore cannot be produced by aggregating whole OA estimates. Consequently, it has been necessary to recalculate the population estimates for these two areas from the 2011 Census and roll these forward each year to 2018 using the methods outline in Step-by-step guide to methodology in Section 4.
The 2011 Census estimate for the National Parks was adjusted using published data from the 2011 Census at postcode level. A new lookup table showing which output areas intersect with the new National Park boundaries and form the “wider National Park area” was commissioned from ONS Geography.
Statistical disclosure control of estimates
The disclosure control processes applied to the estimates include small adjustments made to selected cells. Adjustments are made in such a way that inference of an underlying count is not possible but that the usefulness of the aggregated estimates is not materially affected.
Notes for: Methods
- Total persons; total males; total females; and persons aged 0 to 4, 5 to 7, 8 to 9, 10 to 14, 15, 16 to 17, 18 to 19, 20 to 24, 25 to 29, 30 to 44, 45 to 59, 60 to 64, 65 to 74, 75 to 84, 85 to 89 years, and 90 years and over.
5. Limitations of the estimates
The estimates have been produced using administrative data sources to identify annual population change in intercensal years. Any deficiencies in these data sources may therefore impact upon the quality of the estimates produced. Where known deficiencies have been identified, corrective measures have been applied. However, other deficiencies in the use of administrative data sources for producing population estimates may be less apparent, for example, list cleaning of the patient registers.
Small area population estimates were initially intended for publication by five-year age group and sex. More detailed estimates have since been provided by single year of age and sex. These are intended to enable and encourage further analysis and use of the estimates. Particular caution should be exercised in using estimates at a greater level of disaggregation, for example, for Output Areas (OAs) or for single year of age groups, as these would not be expected to have the same level of accuracy as the aggregated estimates.
Mid-2014 to mid-2019 estimates
In some local authorities, the number of people included in patient register data in the current year has increased or decreased in a number of Lower layer Super Output Areas (LSOAs) and Middle layer Super Output Areas (MSOAs) compared with the previous year’s data, which may be because of changes in administrative practices or may reflect genuine population change. The process of constraining LSOA and MSOA estimates to previously published local authority population estimates means that this pattern is not automatically reflected in the mid-year estimates.
Mid-2013 estimates
In some London local authorities, the number of people included in patient register data in 2013 has decreased in a large number of LSOAs and MSOAs compared with 2012 data, which may be because of changes in administrative practices or may reflect genuine population change. The process of constraining LSOA and MSOA estimates to previously published local authority population estimates means that this pattern is not automatically reflected in the mid-year estimates. However, the constraining process has created some anomalous changes in a minority of LSOAs and MSOAs so some caution should be applied in interpreting estimates that show large percentage changes from mid-2012.
Small area population estimates for mid-2013 are affected by an error identified in the allocation of foreign armed forces in the mid-2013 local authority population estimates, an issue described in detail in the Quality and Methodology Information (QMI) report for those statistics. In total, the error affects population estimates for males and (to a lesser extent) females aged 18 to 59 years in 45 local authority areas, particularly Forest Heath in Suffolk. As the small area population estimates are constrained to the local authority totals, these errors are carried forward into the figures for all small area geographies within (or containing) the affected areas. In the majority of areas, the impact of the problem is negligible. However, some caution should be taken in interpreting figures for small areas known to have large numbers of foreign armed forces or located near foreign armed forces populations, particularly if these have changed significantly from the estimates for mid-2012.
Mid-2012 estimates
Mid-2012 small area population estimates rely on data from the patient register to provide the detailed information about the age and sex distribution of the population at OA level. By contrast, the mid-2011 OA estimates were heavily based on the results of the 2011 Census with minor adjustments to account for population change during the period between census day and the mid-year point. In a minority of areas, where the census distribution is significantly different from that given by 2012 patient register data, there may be large differences between the mid-2011 and mid-2012 estimates for some OAs. The OA estimates are constrained to the LSOA totals. So in general, estimates for higher geographies, which often contain whole LSOAs, do not show as much variation as that seen at the OA level.
The mid-2012 population estimates use administrative data to account for the special population (prisoners and armed forces) that is present in each small area. The mid-2011 estimates included 2011 Census estimates of the special population, which in some areas may differ significantly from those given by the administrative data sources for mid-2012. These definitional differences may create unexpected changes in population between mid-2011 and mid-2012 for a minority of areas with large special populations. In a small number of areas, which have particularly large special populations, adjustments have been applied to the mid-2012 data to ensure population estimates remain plausible.
Mid-2011 estimates
For mid-2011 estimates based on the 2011 Census, no explicit adjustment was made for either internal or international in- or out-migration in the period from census day (27 March 2011) to 30 June 2011 (mid-year). However, an adjustment will have been made through the constraining to the local authority estimates that will have included these components. This therefore assumes that population change resulting from migration by age–sex (in- and out- migrants) in this period in all Super Output Areas (SOAs) within a local authority is proportional to its size in those age–sex groups. This is unlikely to be true. However, as this estimate is for a short time, it is unlikely that the differences will be large.
Revised mid-2002 to mid-2010 estimates
Revised mid-2002 to mid-2010 estimates have been produced to provide a consistent time series of population estimates for the intercensal period. A method was put in place that reconciled the rolled forward LSOA estimates to the mid-2011 Census-based LSOA estimates, balancing the need to produce a plausible revised back-series for total populations and sensible age–sex distributions that can be used as building blocks for producing best-fit population estimates and bespoke population groups. The revisions also include a number of corrections for known issues with the previous series of estimates. The most important of these were:
an adjustment to correct for under estimation of foreign armed forces in Harrogate local authority in the mid-2009 to mid-2010 estimates
an adjustment to correct for boundary changes in Neath Port Talbot and Powys between mid-2005 and mid-2009
Research undertaken prior to the publication of the revised mid-2002 to mid-2010 small area population estimates identified three possible methods to produce a back-series of population estimates. A “full assessment method” using census and administrative data along with an individual consideration of each area, where required, would have resulted in more accurate estimates overall. However, the advantages of increased accuracy were weighed against the impact on timeliness (that is, how soon the estimates could be published). Here there was a trade-off between different aspects of the quality of the estimates.
The “distribution of the difference” method provided the best balance in the majority of small areas between producing a plausible back-series of population estimates for each individual area and using a relatively straightforward method to allow timely publication. The method was designed to identify the difference between the census-based and rolled-forward mid-2011 estimates for each OA and LSOA and to distribute this difference across the back-series in order to remove any ”jump” in the estimates between mid-2010 and mid-2011. Consequently, the patterns of change identified in administrative data using the ratio change method may not be maintained in the revised mid-2002 to mid-2010 figures.
One of the limitations of this method are that it relies on assuming how the difference between the two sets of estimates for mid-2011 has developed over time. This assumption will be particularly important for OAs or LSOAs where the 2011 Census estimates were very different from the rolled-forward estimates.
As the difference is distributed across the OA and LSOA back-series by age–sex cohort, an implicit assumption is also made that populations in mid-2011 would have been in an area in 2002 at a younger age (that is, a 19-year-old male in mid-2011 would have been in the same area in 2002 but aged 10). This was a particular issue in LSOAs with high student-aged populations. Constraining the LSOA estimates to the revised subnational mid-year estimates will have corrected for this to a certain degree; however, a minority of LSOAs show very small counts at younger ages as a result of this assumption. Care must be taken in interpreting age distributions for areas affected by this issue.
Back to table of contents6. Further information and contacts
We welcome user feedback on the population estimates. To provide feedback or to request further information, please contact the Population Estimates Unit either by email at pop.info@ons.gov.uk or by telephone on +44 (0) 1329 444661.
Back to table of contents7. Appendix A: Methodology used in census years
Mid-2011 Super Output Areas
Estimates of the resident population as at mid 2011 have been produced for publication by quinary age group and sex, for Lower layer Super Output Areas (LSOAs) and Middle layer Super Output Areas (MSOAs). Data by single year of age will also be available. For consistency, the mid-2011 LSOA population estimates, by age and sex, are constrained to the mid-2011 local authority mid-2011 estimates. MSOA estimates are produced by directly aggregating the LSOA estimates.
Step-by-step guide to methodology
The following stages were followed to produce mid-2011 LSOA estimates:
Unadjusted 2011 Census LSOA population estimates by single year of age and sex for the usually resident population were aged forward from 27 March 2011 (Census Day) to 30 June 2011.
These aged-forward estimates were adjusted to account for differences in armed forces usual residence definitions between census and mid-year estimates (see Production of Output Area population estimates in Section 4).
Births occurring from 28 March 2011 to 30 June 2011 were added. Nationally, this added 188,000 babies (zero year olds).
Deaths occurring between 28 March 2011 and 30 June 2011 were subtracted. Nationally, this reduced the estimates by 121,000 persons.
The LSOA estimates by single year of age and sex were constrained to the mid-2011 local authority mid-year estimates. This constraining is required because the mid-2011 local authority estimates include adjustments for internal and international migration (see Production of ward and Parliamentary constituency estimates in Section 4).
These LSOA estimates by sex and single year of age were then aggregated to produce MSOA estimates and estimates for both LSOAs and MSOAs by quinary age group.
Mid-2011 Output Areas and other geographies
Step-by-step guide to methodology
The following stages were followed to produce mid-2011 Output Area (OA) estimates that are then aggregated to produce mid-2011 ward and Parliamentary constituency estimates on a best-fit basis.
Produce estimates for mid-2011 OAs, by single year of age and sex
For each LSOA:
1. Establish the component OAs that make up each LSOA (in this example, LSOA X consists of four OAs: X1, X2, X3 and X4).
Figure 2: LSOA X

Source: Office for National Statistics – Methodology note
Download this image Figure 2: LSOA X
.png (10.1 kB)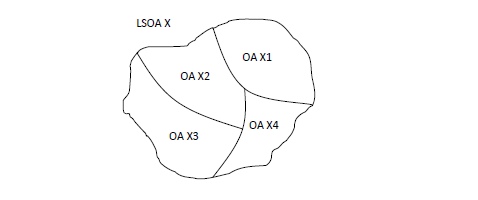
2. For each single year of age and sex of the adjusted 2011 Census LSOA estimate, calculate the contribution from each component OA. For example, 25% of males aged zero years in the adjusted 2011 Census estimate for LSOA X are in OA X1, 15% are in OA X2 and so on.
Figure 3: LSOA X (2011 Census population)
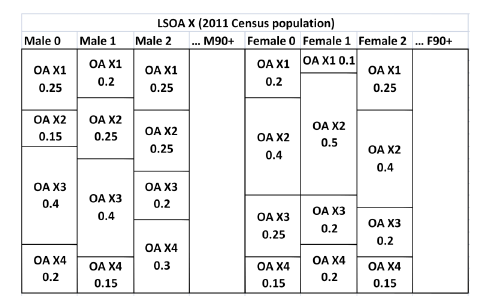
Source: Office for National Statistics – Methodology note
Download this image Figure 3: LSOA X (2011 Census population)
.png (37.0 kB)
This is the “2011 Census OA–LSOA population distribution".
3. Apply the ”2011 Census OA–LSOA population distribution” to the mid-2011 LSOA estimates, by single year of age and sex, to derive mid-2011 OA estimates (also by single year of age and sex).
In the example for LSOA X, 25% of the mid-2011 estimate for males aged zero years is allocated to OA X1, 15% to OA X2 and so on. This process is then repeated for all single year of age and sex groups.
Figure 4: LSOA X (mid-2011 population)
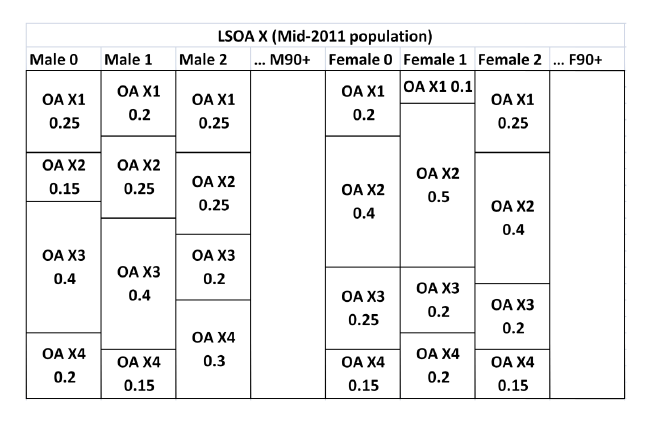
Source: Office for National Statistics – Methodology note
Download this image Figure 4: LSOA X (mid-2011 population)
.png (53.7 kB)
4. Round the resulting OA estimates to whole persons while maintaining totals to mid-2011 LSOA estimates. The mid-2011 LSOA estimates used were post-statistical disclosure control.
Aggregate the mid-2011 OA estimates to produce ward and Parliamentary constituency estimates
The final step is to aggregate the mid-2011 OA estimates to produce 2011 ward and Parliamentary constituencies estimates by single year of age and sex. This was done by using the published OA to ward and OA to Parliamentary constituency geography lookups. Allocation of OAs was determined using a best-fitting method, produced on the basis of using OAs as building blocks to estimate higher geographies.
Further aggregations were required for 2011 wards to incorporate the populations of 18 sub-threshold wards into neighbouring wards in line with published 2011 Census wards. This is required to ensure the confidentiality of data being published, as sub-threshold wards do not meet minimum requirements for the number of people and households in the area (see Appendix E).
Mid-2001 Super Output Areas
The findings of our research that reviewed evidence on the 2001 Census estimates indicated that while no single piece of evidence on its own was conclusive, the weight of evidence suggested that the 2001 Census did not cover all people in England and Wales, particularly young adult men. Accordingly, the 2001 local authority mid-year estimates were revised in September 2004 to reflect this evidence, including:
- adjustments for missing census forms
- longitudinal study adjustments
- the Manchester and Westminster Matching Studies
- 2004 local authority studies
These adjustments resulted in a national count for mid-2001 that was 318,000 greater than the 2001 Census count. The methodology used to produce mid-2001 Super Output Area (SOA) population estimates reflects the population adjustments incorporated in the local authority mid-year estimates.
Estimates of the resident population as at mid-2001 were produced for publication by broad age group and sex for LSOAs and quinary age group and sex for MSOAs. For consistency, the mid-2001 LSOA population estimates, by age and sex, are constrained to the mid-2001 MSOA estimates, which in turn are constrained to the 2001 local authority mid-year estimates.
The methodology used to create these mid-2001 SOA estimates was quality assured and approved by the ONS Methodology Directorate.
Step-by-step guide to methodology
The derived mid-2001 LSOA population base produced reflects the methodology used to create the revised mid-2001 national and local authority estimates but down to the smaller LSOA geography. In summary, to produce the mid-2001 LSOA, these stages were followed:
1. Unadjusted census OA counts by single year of age and sex for the usually resident population were aggregated to LSOAs.
2. To these counts, an adjustment was made for missing census forms, adding 5,100 people in 21 LSOAs.
3. The population counts by single year of age and sex were aged forward from 29 April 2001 to 30 June 2001.
4. To these counts, the longitudinal study local authority population revisions to males aged 21 to 50 years in the revised mid-2001 local authority revised estimates were added. Nationally, 163,800 persons were added. These were disaggregated to 6,647 LSOAs, using an adaptation of the methodology used to derive local authority male counts. We have published the methodology used to make the local authority revisions (PDF, 34.5KB) .
5. To these counts, 2,453 LSOA adjustments for 15 local authorities resulting from the local authority studies review were added. Nationally, this was 107,400 persons.
6. Births (zero-year-olds) occurring between 1 May 2001 and 30 June 2001 were added. Nationally, this added 100,900 babies.
7. Deaths occurring between 1 May 2001 and 30 June 2001 were subtracted. Nationally, this reduced the estimates by 84,100 persons.
8. The single year of age and sex counts were constrained to the revised 2001 local authority mid-year estimates (published in September 2004) and to reflect a population change of around 1,100 resulting from April 2003 boundary changes in three Welsh unitary authorities: Carmarthenshire, Ceredigion and Pembrokeshire.
MSOA estimates were produced by aggregating the LSOA counts. To address comments received following the user consultation with the previously published ward-level population estimates, further adjustments were incorporated into these LSOA and MSOA estimates as follows:
1. Adjustments for identified under or over estimation at MSOA level were applied to the component LSOAs.
2. These adjustments reflect MSOAs where local authority census response was poor and where the MSOA estimates following longitudinal study adjustments differed significantly to counts from administrative data sources. The adjustments resulted in some LSOAs having a reduction in population and others an increase. Net change at local authority level was zero. Adjustments were made to 818 LSOAs within 173 MSOAs in 13 local authorities. A list of these 13 local authorities is shown in Appendix B.
3. Owing to inconsistencies between census home armed forces counts and mid-2001 Defence Analytical Services Agency (DASA) local authority counts, negative counts were produced by single year of age when the mid-2001 special population was deducted from the resident population to produce the mid-2002 estimates. To overcome this, adjustments were made for 51 LSOAs within 43 MSOAs in 33 local authorities that had negative counts when the special population was subtracted. Compensating adjustments were spread across all other LSOAs and MSOAs within these local authorities. Net change at local authority level was zero.
4. Owing to inconsistencies between census prisoner counts and mid-2001 Home Office prisoner counts, negative counts were produced by single year of age when the mid-2001 special population was deducted from the resident population for the production of mid-2002 estimates. To overcome this, adjustments were made for six LSOAs within six MSOAs in six local authorities that had negative counts when the special population was subtracted. Compensating adjustments were spread across all other LSOAs within these local authorities. Net change at local authority level was zero.
Additional adjustments
Further changes to the LSOA mid-2001 population were made to reflect changes in the allocation of postcodes to LSOAs. Postcodes that existed at the time of the 2001 Census, which were split by electoral ward boundaries, were assigned to a single census OA on the basis of where the majority of the population lived. Other postcodes in use prior to April 2001, and new postcodes created after then, were assigned to a census OA using the grid reference of the address closest to the mean of the easting and northing for each postcode. As a result, some postcodes were allocated to a different census OA than would have been the case if using a grid reference allocation. A new methodology was introduced with the August 2006 National Statistics Postcode Lookup (NSPL) to resolve this.
All postcodes in England and Wales are now assigned by a point-in-polygon process (that is, plotting grid references and assigning to digital boundaries by geographic information system using current grid references. As the grid reference for each postcode will be current and the geography allocations will be directly based on it, the two will always correspond).
The implication of this change for small area population estimates is that the population residing within addresses for some postcodes will have a changed LSOA allocation. So postcodes included in a particular LSOA at the time of the 2001 Census will now be allocated to a different LSOA, affecting the mid-2001 base population estimates.
The postcodes and LSOAs that were affected the most in terms of overall population numbers were identified. Some LSOAs will have been overestimated at mid-2001 and others similarly underestimated. The postcodes investigated that had a changed LSOA allocation with the May 2006 NSPL were those that from the 2001 Census had a population count of 100 or more and that were previously assigned to a single census OA. They were therefore also the postcodes where the impact of possible adjustment would result in the greatest improvement to the estimates. A 2001 Census population count of 100 was therefore the threshold considered for base population adjustment, and 76 such postcodes were identified.
A visual check was then done using Ordnance Survey digital mapping to check that the new LSOA allocation was correct. In some cases, it was identified that the original postcode to LSOA allocations were in fact more accurate. LSOA population adjustments for mid-2001 were made for 49 postcodes with an associated population count of 100 or more; this affected 88 LSOAs in 62 MSOAs in 40 local authorities. For all of these postcodes, the local authority allocation was unchanged.
When constraining to the local authority mid-year estimates, special account was taken of the population change of around 1,100 persons (as at mid-2001) resulting from April 2003 boundary changes in three Welsh unitary authorities: Carmarthenshire, Ceredigion and Pembrokeshire. The SOA counts for these local authorities if aggregated to local authority level will not be consistent with the published local authority mid-year estimates, as these reflect the local authority boundaries as at mid-2001. Whereas, the SOA boundaries reflect the geography at the time of the April 2003 boundary changes.
Mid-2001 estimates for other geographies
Mid-2001 population estimates for all other geographies (including OAs, wards and Parliamentary constituencies) were produced using the postcode best-fit (PBF) method. Details of this method are available from the Population estimates methodology archive.
Back to table of contents8. Appendix B: Methodology used to produce revised estimates, mid-2002 to mid-2010
Super Output Areas
The revised estimates of the resident population between mid-2002 and mid-2010 have been produced for publication by single year of age and sex, for Lower layer Super Output Areas (LSOAs) and Middle layer Super Output Areas (MSOAs). For consistency, the revised mid-2002 to mid-2010 LSOA population estimates, by single year of age and sex, are constrained to the revised mid-2002 to mid-2010 local authority estimates. MSOA estimates are produced by directly aggregating the LSOA estimates.
Step-by-step guide to methodology
The following stages were followed to produce the revised mid-2002 to mid-2010 LSOA estimates:
Mid-2002 to mid-2011 rolled-forward LSOA population estimates (based on 2001 Census Output Areas (OAs)) by single year of age and sex for the usually resident population were mapped and apportioned to the new 2011 LSOA boundaries using 2001 to 2011 geography lookup files. Geography information on lookups between 2001 and 2011 geographies is available.
These estimates on the new 2011 LSOA boundaries were adjusted to correct for known issues in the mid-2002 to mid-2010 LSOA and local authority rolled-forward estimates.
The difference between the mid-2011 Census-based and the mid-2011 rolled-forward LSOA population estimates was calculated by single year of age and sex.
The difference at mid-2011 was distributed cumulatively across the mid-2002 to mid-2010 LSOA rolled- forward series by age-sex cohort; that is assuming that the difference follows the same group of people through time.
For example, the difference for males aged 25 in mid-2011 was 50 in LSOA X. In this case the mid-2011 rolled-forward estimates for LSOA X were underestimating this age-sex group. The difference of 50 is therefore added on:
Starting with mid-2002, five is added on to males aged 16 years (10% of the difference). In mid-2003, 10 is added on to males aged 17 years (20% of the difference). In mid-2004, 15 is added on to males aged 18 years (30% of the difference).
This process is then repeated until 45 is added on to males aged 24 years in mid-2010 (90% of the difference).
5. The revised mid-2002 to mid-2010 LSOA estimates were then constrained to the previously published revised census-based local authority estimates for mid-2002 to mid-2010.
6. These LSOA estimates by single year of age and sex were then aggregated to produce MSOA estimates.
National Parks
Revised mid-2002 to mid-2010 OA estimates were used to produce a consistent time series of National Park population estimates for the intercensal period. The OAs are used to form a time series of estimates for the wider National Park areas (see Production of National Park estimates in Section 4), allowing the annual population changes to be established. The changes in these wider areas are used to roll back National Park estimates to produce a National Park time series back to mid-2002. The method for rolling back also uses the ratio change approach described in Production of National Park estimates in Section 4.
First, the change from mid-2010 to mid-2011 is used to roll back the mid-2011 National Park estimates to produce mid-2010 estimates. The mid-2010 National Parks estimates are then rolled back using the change from mid-2009 to mid-2010 for these wider areas, to produce mid-2009 estimates. This process is repeated until estimates for the full intercensal period are complete.
Figure 5: Process diagram

Source: Office for National Statistics – Methodology note
Download this image Figure 5: Process diagram
.png (24.2 kB)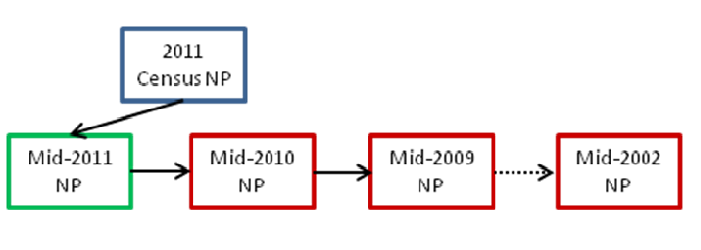
Notes for Appendix B: Methodology used to produce revised estimates, mid-2002 to mid-2010
- Postcode estimates were produced as part of the postcode best-fit (PBF) method. The PBF method apportions population estimates for LSOAs to unit postcode level based on age and sex information from patient register postcode-level data. A special allowance is made for population sub-groups not included on the patient registers, covering prisoners, UK armed forces, and foreign armed forces and dependants.
9. Appendix C: Administrative datasets used in production of small area estimates
Following an evaluation of a number of data sources, the following administrative datasets were used with the ratio change method to produce the Super Output Area (SOA) estimates.
Patient register
Year-specific July counts of individuals included on the NHS patient registers were used, that is, persons registered with a doctor, by single year of age and sex at postcode level. Through the use of a postcode lookup table (for example, the National Statistics Postcode Lookup (NSPL)) these counts can be aggregated to different geographical levels such as wards and SOAs.
The data provided to us have already been validated, so only records with a valid postcode are received. Improvements in the quality of postcodes on the patient registers reflect the efforts by the strategic health authorities (in England) and health boards (in Wales) to improve the quality of the data on their registers.
Some of our previous research, describing the use of patient registers to measure internal migration in England and Wales, concluded that at the local authority level, patient register counts do not provide a reliable estimate of the resident population of England and Wales. It was also noted that for the patient registers to be used in this way, the counts would require significant adjustments and further research would be needed.
When the patient register count exceeds the mid-year population estimates, this is often referred to as “list inflation”. This may occur when some patients have more than one NHS number and are double counted, and patients may be on doctors’ lists after having left the country. List inflation may also be localised, for example, in student areas where students do not quickly re-register after finishing their course of study and moving away from an area.
List inflation is greatest in London boroughs. It is expected that this list inflation is mainly caused by a high number of international migrants moving into London and registering with a GP. Many of them will not be removed from the GP lists when they leave.
Conversely, there are other areas where the patient registers will be missing individuals because these persons are ineligible for registration with a GP. This has predominantly been in areas where there is known to be a high armed forces population. This group has not generally been registered with an NHS GP. Other groups of the population that are excluded from the NHS are prisoners that are sentenced for a term of two years or more and certain patients in long-stay medical hospitals. In addition, there are individuals who obtain all their medical care privately who may not be registered with a GP, but these numbers are likely to be small.
Child Benefit data
Child Benefit data were not used in the production of SOAs from mid-2013, as noted in Step-by-step guide to methodology in Section 4.
The Department for Work and Pensions (DWP) previously administered a Child Benefit database containing details about children for whom Child Benefit was claimed, along with the claimant's particulars (usually the mother). The claimant’s details were therefore repeated in as many records as she or he has children. In 2003, responsibility for Child Benefit passed to Inland Revenue (IR), now HM Revenue and Customs (HMRC).
Child Benefit counts for April 2001 and August 2002 were received from the DWP, June 2003 counts from IR and August counts for subsequent years from HMRC. Mid-year counts were not available. While data were held by DWP, IR or HMRC for each child for whom Child Benefit was claimed, because of social security and data protection legislation, DWP, IR and HMRC were unable to give us access to identifiable, subject-level data. Through an arrangement with us and DWP, the University of Oxford carried out an LSOA-level aggregation of the 2001 and 2002 datasets. While Child Benefit may be claimed for children aged 0 to 16 years and over, only counts for children in the quinary age groups of 0 to 4, 5 to 9 and 10 to 14 years were used to calculate change ratios. Eligibility for benefit decreases for children older than 15 years.
There are a number of valid reasons why we would expect the count of children aged 0 to 14 years from Child Benefit to be lower than the national mid-year estimates, including:
dependants of students and foreign nationals, including foreign armed forces, are not eligible for Child Benefit
children in local authority care or foster care are not eligible for Child Benefit
children detained in secure or non-secure accommodation are not eligible for Child Benefit
children whose entry to the UK is subject to immigration control are not eligible for Child Benefit
children for whom Child Benefit is not claimed but who are eligible
There are also valid reasons why we would expect the distribution (location) of children from Child Benefit to differ from the mid-year estimates, these include:
school boarders – where claimant's address is different to boarder’s residential addres
children who reside at a different address to the address of the claimant
UK armed forces (special population)
The armed forces component of the local authority usually resident population estimates includes UK armed forces, covering personnel in the Royal Air Force, British Army and Royal Navy stationed in England and Wales. The numbers are collected annually from the Ministry of Defence (MoD) which provides data on the number of UK armed forces by gender stationed at each base in England and Wales. These data are mainly based on administrative systems that are used
The MoD also provides an age and sex breakdown for all UK armed forces, which is used to help derive an age and sex breakdown of armed forces personnel at local authority level. The MoD are currently unable to provide counts of armed forces personnel on a usually resident basis; residence information is available from the census.
For England and Wales, the number of UK armed forces from the 2001 Census was 154,000 compared with the MoD mid-2001 count of 150,900, a difference of 3,100 (2.1%). Some of these differences may be because of the timing differences between the census and mid-year. It is not generally feasible to disaggregate the UK armed forces data currently available at local authority level and used within the local authority mid-year estimates to SOA level without using a census SOA distribution. However, where information is known about changes to the location of armed forces personnel, this is reflected in the estimates.
Foreign armed forces (special population)
The foreign armed forces component of the local authority usually resident population estimates covers personnel in the United States Air Force, United States Army and United States Navy. Personnel from the United States Air Force make up the great majority of foreign armed forces stationed in England and Wales.
The age and sex distribution of these personnel is not available annually and an age and sex distribution is applied using census data. The data sources for the three armed forces services differ, and the format of data received differs slightly between sources. For example, data on United States Air Force personnel are only available by location (town), while data on United States Army personnel are available at postcode level and data on United States Navy personnel are available at postcode-sector level.
Small area population estimates for mid-2013 were affected by an error identified in the allocation of foreign armed forces in the mid-2013 local authority population estimates described in Section 5.
Prisoners (special population)
Data are received from the Ministry of Justice (formerly the Home Office) on the number of prisoners for inclusion in the local authority mid-year estimates. Age and sex information for each prisoner for all prisons is received. For population estimates prior to mid-2011, prisoners are regarded as usually resident in a prison if they have been sentenced and have served six months or more of their sentence. For estimates from mid-2011 onwards, prisoners are regarded as usually resident in a prison if they have been sentenced to six months or more.
Back to table of contents10. Appendix D: Simplified ratio change methodology diagram for production of SOA estimates
Figure 6: Simplified ratio change methodology diagram for production of SOA estimates
Source: Office for National Statistics – Methodology note
Download this image Figure 6: Simplified ratio change methodology diagram for production of SOA estimates
.png (46.8 kB)
Source: Office for National Statistics – Methodology note
Notes for Appendix D: Simplified ratio change methodology diagram for production of SOA estimates
Special population adjustments are as follows (affecting some age groups only): UK armed forces, foreign armed forces and dependants, and prisoners.
Ratios produced for counts containing zero by age and sex are changed to one. Example of a ratio change calculation by quinary age and sex: Year 2 count of 226 divided by Year 1 count of 197 gives a change ratio of 1.1472, which is applied to the Year 1 population for the appropriate age and sex group.
11. Appendix E: Sub-threshold wards
There were 8,071 electoral wards as at 31 December 2019. Of these, 18 are sub-threshold wards that do not meet the minimum population requirements for data confidentiality (40 resident households and 100 resident people in the 2011 Census). As these are smaller than Output Areas (OAs), they will not have separate OA estimates attached to them. In these cases, neighbouring wards have assumed the populations as detailed in Table 3. More information on sub-threshold wards can be found in the best-fit policy (PDF, 410KB) document.
| Code of sub-threshold ward not assigned population estimates | Name of sub-threshold ward not assigned population estimates |
|---|---|
| E05009289 | Aldgate |
| E05009290 | Bassishaw |
| E05009291 | Billingsgate |
| E05009293 | Bread Street |
| E05009294 | Bridge |
| E05009295 | Broad Street |
| E05011090 | Bryher |
| E05009296 | Candlewick |
| E05009297 | Castle Baynard |
| E05009298 | Cheap |
| E05009299 | Coleman Street |
| E05009300 | Cordwainer |
| E05009301 | Cornhill |
| E05009303 | Dowgate |
| E05009306 | Langbourn |
| E05009307 | Lime Street |
| E05009311 | Vintry |
| E05009312 | Walbrook |
Download this table Table 3: Sub-threshold wards
.xls .csv12. Appendix F: Small area population estimates revisions history
Super Output Area
Super Output Area (SOA) population estimates were first published in 2006 and have since been published on an annual basis. However, a number of revisions have been made to various datasets during this period. Table 4 sets out the publication history of the SOA population estimates, giving the dates and reasons for any revisions that have been made.
| Data | Release edition | Published | Reason | Superseded |
|---|---|---|---|---|
| Current datasets | ||||
| Mid-2001 | 4 | Dec-13 | Re-based on 2011 LSOA boundaries in place on 30 June 2011 | |
| Mid-2011 | 1 | Apr-13 | First release | |
| Mid-2012 | 1 | Oct-13 | First release | |
| Mid-2002 to mid-2010 | 2 to 4 | Nov-13 | Revised to provide a consistent time series for future estimates based on the 2011 Census and to reflect the administrative boundaries in place on 30 June 2011. | |
| Mid-2012 | 2 | Oct-18 | Revised in line with revisions to mid-year estimates at local authority level following methodological improvements. | |
| Mid-2013 | 3 | Oct-18 | Revised in line with revisions to mid-year estimates at local authority level following methodological improvements. | |
| Mid-2014 to mid-2016 | 2 | Oct-18 | Revised in line with revisions to mid-year estimates at local authority level following methodological improvements. First release | |
| Mid-2017 | 1 | Oct-18 | First release | |
| Mid-2018 | 1 | Oct-19 | First release | |
| Mid-2019 | 1 | Sep-20 | First release | |
| Superseded datasets | ||||
| Mid-2001 to mid-2004 | 1 | Oct-06 | First release | Oct-07 |
| Mid-2001 to mid-2004 | 2 | Oct-07 | Revised to ensure consistency with local authority estimates. LA estimates were revised in August 2007 to incorporate improved international migration estimates. | Sep-10 |
| Mid-2005 | 1 | Oct-07 | First release | Sep-10 |
| Mid-2006 | 1 | May-08 | First release | Sep-10 |
| Mid-2007 | 1 | Nov-08 | First release | Sep-10 |
| Mid-2008 | 1 | Oct-09 | First release | Sep-10 |
| Mid-2001 | 3 | Sep-10 | Revised to ensure consistency with local authority estimates. Local authority estimates were revised in May 2010 to incorporate improvements resulting from the Migration Statistics Improvement Programme. | Dec-13 |
| Mid-2002 to Mid-2004 | 3 | Sep-10 | Revised to ensure consistency with local authority estimates. Local authority estimates were revised in May 2010 to incorporate improvements resulting from the Migration Statistics Improvement Programme. | Nov-13 |
| Mid-2005 to Mid-2008 | 2 | Sep-10 | Revised to ensure consistency with local authority estimates. Local authority estimates were revised in May 2010 to incorporate improvements resulting from the Migration Statistics Improvement Programme. | Nov-13 |
| Mid-2009 | 1 | Nov-10 | First release | Nov-13 |
| Mid-2010 | 1 | Sep-11 | First release | Nov-13 |
| Mid-2013 | 1 | Oct-14 | First release | Nov-15 |
| Mid-2012 | 1 | Nov-13 | First release | Oct-18 |
| Mid-2013 | 2 | Nov-15 | Revised in line with mid-year estimates at local authority following correction of Forest Heath issue. | Oct-18 |
| Mid-2014 | 1 | Nov-15 | First release | Oct-18 |
| Mid-2015 | 1 | Oct-16 | First release | Oct-18 |
| Mid-2016 | 1 | Oct-17 | First release | Oct-18 |
Download this table Table 4: Super Output Area population estimates publication history
.xls .csvClinical Commissioning Group
Clinical Commissioning Group (CCG) population estimates for mid-2011 and mid-2012 were first published in 2013 and will be published on an annual basis going forward. Estimates for mid-2002 to mid-2010 have been produced in line with the results of the 2011 Census and to provide a consistent time series for CCG estimates between mid-2002 and mid-2012. Table 5 sets out the publication history of the CCG population estimates, giving the dates and reasons for any revisions that have been made.
| Data | Release edition | Published | Reason | Superseded |
|---|---|---|---|---|
| Current datasets | ||||
| Mid-2011 | 1 | Aug-13 | First release | |
| Mid-2012 | 1 | Oct-13 | First release | |
| Mid-2002 to mid-2010 | 1 | Nov-13 | First release | |
| Mid-2001 | 1 | Dec-13 | First release | |
| Mid-2012 | 2 | Oct-18 | Revised in line with revisions to mid-year estimates at local authority level following methodological improvements. Uses 195 CCGs in place in October 2018. | |
| Mid-2013 | 3 | Oct-18 | Revised in line with revisions to mid-year estimates at local authority level following methodological improvements. Uses 195 CCGs in place in October 2018. | |
| Mid-2014 to mid-2016 | 2 | Oct-18 | Revised in line with revisions to mid-year estimates at local authority level following methodological improvements. Uses 195 CCGs in place in October 2018. | |
| Mid-2017 | 1 | Oct-18 | First release | |
| Mid-2018 | 1 | Oct-19 | First release | |
| Mid-2019 | 1 | Sep-20 | First release | |
| Superseded datasets | ||||
| Mid-2013 | 1 | Oct-14 | First release | Nov-15 |
| Mid-2012 | 1 | Nov-13 | First release | Oct-18 |
| Mid-2013 | 2 | Nov-15 | Revised in line with mid-year estimates at local authority following correction of Forest Heath issue. | Oct-18 |
| Mid-2014 | 1 | Nov-15 | First release | Oct-18 |
| Mid-2015 | 1 | Oct-16 | First release | Oct-18 |
| Mid-2016 | 1 | Oct-17 | First release | Oct-18 |
Download this table Table 5: Clinical commissioning group (CCG) population estimates publication history
.xls .csvWard and Parliamentary constituency
Ward and Parliamentary constituency population estimates derived from the postcode best-fit method were first published in 2008 and have since been published on an annual basis. Estimates for mid-2011 onwards are derived from Output Areas (OAs) on a best-fit basis.
| Data | Release edition | Published | Reason | Superseded |
|---|---|---|---|---|
| Current datasets | ||||
| Mid-2011 | 1 | May-13 | First release (2011 Census-based) | |
| Mid-2012 | 1 | Nov-13 | First release | |
| Mid-2002 to mid-2010 | 2 to 3 | Nov-13 | Revised to provide a consistent time series for future estimates based on the 2011 Census and to reflect the administrative boundaries in place in 2011 | |
| Mid-2012 | 2 | Oct-18 | Revised in line with revisions to mid-year estimates at local authority level following methodological improvements. | |
| Mid-2013 | 3 | Oct-18 | Revised in line with revisions to mid-year estimates at local authority level following methodological improvements. | |
| Mid-2014 to mid-2016 | 2 | Oct-18 | Revised in line with revisions to mid-year estimates at local authority level following methodological improvements. First release | |
| Mid-2017 | 1 | Oct-18 | First release | |
| Mid-2018 | 1 | Oct-19 | First release | |
| Mid-2019 | 1 | Sep-20 | First release | |
| Superseded datasets | ||||
| Mid-2002 to mid-2005 | 1 | Feb-08 | First release | Feb-11 |
| Mid-2006 | 1 | Aug-08 | First release | Feb-11 |
| Mid-2007 | 1 | Feb-09 | First release | Feb-11 |
| Mid-2001 | 1 | Feb-08 | First release | Nov-13 |
| Mid-2002 to mid-2007 | 2 | Feb-11 | Revised to ensure consistency with local authority estimates. Local authority estimates were revised in May 2010 to incorporate improvements resulting from the Migration Statistics Improvement Programme. | Nov-13 |
| Mid-2008 to mid-2009 | 1 | Feb-11 | First release | Nov-13 |
| Mid-2010 | 1 | Oct-11 | First release | Nov-13 |
| Mid-2013 | 1 | Oct-14 | First release | Nov-15 |
| Mid-2012 | 1 | Nov-13 | First release | Oct-18 |
| Mid-2013 | 2 | Nov-15 | Revised in line with mid-year estimates at local authority following correction of Forest Heath issue. | Oct-18 |
| Mid-2014 | 1 | Nov-15 | First release | Oct-18 |
| Mid-2015 | 1 | Oct-16 | First release | Oct-18 |
| Mid-2016 | 1 | Oct-17 | First release | Oct-18 |
Download this table Table 6: Ward and parliamentary constituency population estimates publication history
.xls .csvLocal authority estimates were revised in May 2010 to incorporate improvements resulting from the Migration Statistics Improvement Programme.
National Parks
National Park estimates derived from the postcode best-fit method were first published in 2008 and have since been published on an annual basis. Estimates for mid-2011 onwards are derived from OAs but remain on an exact-fit basis.
| Data | Release edition | Published | Comments | Superseded |
|---|---|---|---|---|
| Current datasets | ||||
| Mid-2001 | 1 | Feb-08 | First release | |
| Mid-2002 to mid-2010 | 02-Mar | Mar-14 | By ad hoc age groups | |
| Revised to provide a consistent time series for future estimates based on the 2011 Census | ||||
| Mid-2011 | 1 | Mar-14 | First release by ad hoc age groups (2011 census-based) | |
| Mid-2012 | 1 | Mar-14 | First release by ad hoc age groups | |
| Mid-2002 to mid-2010 | 02-Mar | Oct-14 | By single year of age and sex | |
| Revised to provide a consistent time series for future estimates based on the 2011 Census | ||||
| Mid-2011 | 1 | Oct-14 | First release by single year of age and sex | |
| Mid-2012 | 2 | Oct-18 | First release by single year of age and sex | |
| Mid-2013 | 3 | Oct-18 | First release by single year of age and sex | |
| Mid-2014 to mid-2016 | 1 | Oct-18 | First release by single year of age and sex | |
| Mid-2017 | 1 | Oct-18 | First release by single year of age and sex | |
| Mid-2018 | 1 | Oct-19 | First release by single year of age and sex | |
| Mid-2019 | 1 | Sep-20 | First release by single year of age and sex | |
| Superseded datasets | ||||
| Mid-2002 to mid-2005 | 1 | Feb-08 | First release | Feb-11 |
| Mid-2006 | 1 | Aug-08 | First release | Feb-11 |
| Mid-2007 | 1 | Feb-09 | First release | Feb-11 |
| Mid-2001 | 1 | Feb-08 | First release | Nov-13 |
| Mid-2002 to mid-2007 | 2 | Feb-11 | Revised to ensure consistency with local authority estimates. Local authority estimates were revised in May 2010 to incorporate improvements resulting from the Migration Statistics Improvement Programme | Nov-13 |
| Mid-2008 to mid-2009 | 1 | Feb-11 | First release | Nov-13 |
| Mid-2010 | 1 | Oct-11 | First release | Nov-13 |
| Mid-2012 | 1 | Oct-14 | First release | Nov-13 |
| Mid-2013 | 1 | Oct-14 | First release | Nov-15 |
| Mid-2013 | 2 | Nov-15 | Revised in line with mid-year estimates at local authority following correction of Forest Heath issue | Oct-18 |
| Mid-2014 | 1 | Nov-15 | First release | Oct-18 |
| Mid-2015 | 1 | Oct-16 | First release | Oct-18 |
| Mid-2016 | 1 | Oct-17 | First release | Oct-18 |
Download this table Table 7: National Park population estimates publication history
.xls .csvPrimary care organisation
Primary care organisation (PCO) population estimates were published between 2005 and 2013 but were discontinued in September 2014 following the results of a formal consultation. Table 8 sets out the publication history of the PCO population estimates, giving the dates and reasons for any revisions that have been made.
| Data | Release edition | Published | Reason | Superseded |
|---|---|---|---|---|
| Current datasets | ||||
| Mid-2011 | 1 | Apr-13 | First release | |
| Mid-2012 | 1 | Oct-13 | First release | |
| Mid-2002 to mid-2010 | 02-Apr | Nov-13 | Revised to provide a consistent time series for future estimates based on the 2011 Census and to reflect the administrative boundaries in place on 30 June 2011. | |
| Mid-2001 | 2 | Dec-13 | Re-based on 2011 LSOA boundaries in place on 30 June 2011. | |
| Superseded datasets | ||||
| Mid-2001 | 1 | Feb-05 | First release | Dec-13 |
| Mid-2002 to mid-2003 | 1 | Feb-05 | First release | Mar-06 |
| Mid-2004 | 1 | Nov-05 | First release | Mar-06 |
| Mid-2002 to mid-2004 | 2 | Mar-06 | Revised to provide a consistent time series for estimates based on October 2006 boundaries. | Oct-07 |
| Mid-2005 | 1 | Mar-06 | First release | Oct-07 |
| Mid-2002 to mid-2005 | 3 | Oct-07 | Revised to ensure consistency with local authority estimates. Local authority estimates were revised in August 2007 to incorporate improvements resulting from the Migration Statistics Improvement Programme. | Nov-10 |
| Mid-2006 | 1 | Sep-08 | First release | Nov-10 |
| Mid-2002 to mid-2007 | 1 to 4 | Nov-10 | Revised to ensure consistency with local authority estimates. Local authority estimates were revised in May 2010 to incorporate improvements resulting from the Migration Statistics Improvement Programme. | Nov-13 |
| Mid-2008 | 1 | May-10 | First release | Nov-13 |
| Mid-2009 | 1 | Nov-10 | First release | Nov-13 |
| Mid-2010 | 1 | Sep-11 | First release | Nov-13 |