1. Main points
In this article we bring together our latest work on estimating international migration in 2020 with population statistics to provide early insights into the possible size of the UK population in 2020.
This early indicator of UK population size suggests that by mid-2020 (30 June 2020), the UK population grew to 67.1 million - a 0.5% annual increase from mid-2019, marking one of the smallest increases seen in the context of historical trends.
To provide an indication of the potential size of the UK population for a more recent time point we have devised five international migration scenarios for the six months to the end of 2020 (31 December 2020).
Assumptions have been made to develop these statistics and users should read and be aware of these; the indicators published here are intended to provide an early insight on the possible size, age and sex distribution of the UK population ahead of a full set of official mid-year population estimates to be published in summer 2021.
Our scenario-based end of year 2020 population indicators should be used for indicative purposes only and are projections based on observed demographic behaviour and a range of potential international migration scenarios.
These statistics are not official mid-year population estimates for mid-2020, which are planned for publication in summer 2021. These statistics should only be used to give an early insight into the possible age and sex structure of the UK population ahead of the official mid-year population estimates.
2. Background
The Office for National Statistics (ONS) publishes official population estimates for the UK annually. These are based on the previous census and rolled forward each year to take account of the numbers of births, deaths, and migration. Since early 2020, the coronavirus (COVID-19) pandemic has generated unprecedented interest in population change across the UK. The impact of the pandemic on how we measure the UK population is outlined in a recent blog post by Jonathan Athow.
The latest official mid-year population estimates, which were published in June 2020, relate to the year to mid-2019. Our next estimates, covering the period to mid-2020, are due to be published in summer 2021. These will provide the official estimates of overall population change in the year to mid-2020, a timespan which includes the first part of the coronavirus pandemic.
We recognise that since our last set of mid-year population estimates there is likely to have been a continuation of some aspects of population change seen before the pandemic, and new changes since the start of the pandemic, which may not yet be represented in some of our regular statistics. For example, our most recent 2018-based national population projections were published before the pandemic so use of these to understand the population in the early years of the projections series is difficult because these are long-term projections that were made prior to the coronavirus pandemic. As discussed in our January 2021 blog, we recognise that there is great interest in employment, migration and the population in 2020.
Census 2021 for England, Wales and Northern Ireland took place in March, and Scotland's Census will take place in March 2022. These will, in time, provide the most robust and comprehensive picture of the population possible. Before then, and ahead of the official 2020 mid-year estimates, we are aware of the need of users of population statistics for us to carefully integrate new research and findings from migration statistics and methodology to provide the early insights presented in this article.
An update on our wider population and migration statistics transformation can be found in the transformation overview update published as part of a wider suite of publications, which together describe our latest work on transforming how we produce population and migration statistics (see Related links).
Back to table of contents3. Purpose of these statistics
To give an early indication of the potential UK population in 2020, this article provides both an indication of the age and sex distribution of the UK population for mid-year 2020, and an indication of potential size and structure of the population at end of year 2020 under various international migration scenarios. The early indicators of the mid-2020 UK population draw upon provisional model-based estimates of international migration up to June 2020, which have been published at the same time. These estimates provide insights into changes in international migration since the coronavirus (COVID-19) pandemic began, in the absence of estimates from the International Passenger Survey (IPS), which was suspended in March 2020.
Statistics published in this release do not form part of the official series of population projections or mid-year estimates. Users of these statistics should read and understand the methodology implemented and the limitations of the statistics (see Methods, data sources and quality for more information). When they become available, we advise users to use the official mid-year population estimates and national population projections, which provide the best possible statistics on the current and potential future UK population.
Back to table of contents4. Methods, data sources and quality
The methodology used to produce these statistics is based on the National Population Projections (NPP) cohort component method applied to the official mid-2019 population estimates. However, several additional assumptions and simplifications have been made because of the limited availability of input data at this time, ahead of the official mid-2020 population estimates. These statistics are not designated as National Statistics and should not be interpreted as predictions of population change. The indicators of end of year 2020 UK population presented in this release are a form of population projection based on a specific set of demographic assumptions to show what could happen to the size and structure of the UK population in different scenarios if those assumptions were realised.
The early indicators published in this article were produced non-additively, which means the figures for the UK were calculated as a whole area rather than adding together separate figures for each UK country as is the case for official mid-year population estimates.
These statistics are not designated as National Statistics and should not be interpreted as predictions of population change. Nor do they replace official mid-year population estimates for mid-2020 which are planned for publication in summer 2021.
These statistics should only be used to give an early insight on the possible age and sex structure of the UK population ahead of the official mid-year estimates. They are a form of population projection based on a specific set of demographic assumptions to show what could happen if those assumptions were realised.
Demographic assumptions for year to mid-2020
2018-based NPP fertility rates by single year of age and sex were adjusted to match provisional births totals at the UK level as of mid-2020. In a similar way, for mortality, 2018-based NPP rates by single year of age and sex were adjusted to match provisional death totals by sex at the UK level as of mid-2020.
The migration statistics used are based on statistics from the International Passenger Survey (IPS) to February 2020 and modelled estimates (provisional research statistics) for March to June 2020; these account for the additional components of Long-term International Migration (LTIM) where appropriate. These additional components include more comprehensive data for international migration through Northern Ireland, asylum seekers and refugee flows, visitor and migrant switchers (for Quarter 3 (July to Sept) and Quarter 4 (Oct to Dec) 2019 only) and the adjustment made for non-EU student migration (for Quarter 3 and Quarter 4 2019 only). The overall net international migration figure of 282,000 for the year to June 2020 is outlined in Figure 3 and was used to develop the early indicator of the population in mid-2020 presented in this release.
Limitations
The main limitations of this approach include that the base mortality and fertility assumptions are derived by scaling the 2018-based NPP principal assumptions to match provisional births and deaths; they were not created with direct consideration of the effect of the coronavirus (COVID-19) pandemic.
Demographic assumptions for the six months to end of year 2020
Fertility
We used the same fertility rates as those used for mid-2019 to mid-2020 because final births data from July to December 2020 were not yet available. The majority of births to 31 December 2020 would have been conceived prior to the coronavirus pandemic. It is therefore possible that any significant change in childbearing as a result of the pandemic would not yet be observed in the data.
Mortality
Mortality rates were calculated by dividing provisional deaths between mid to end 2020 by the projected mid-2020 population divided by two (to account for half a year of data: July to December 2020). Rates for those aged 96 years and above were assumed to be unchanged from the period mid-2019 to mid-2020, because of limited data availability for older ages.
Migration
For international migration, we have provided a range of scenarios for the year, which align with our zero, low and principal migration variant projections included in our most recent 2018-based national population variant projections. Both positive and negative increments were used to simulate net emigration and net immigration into the UK. This is because of the uncertainty in international migration patterns since the pandemic, as indicated by the provisional modelled estimates.
Limitations
There are several limitations in the approach to developing an end of 2020 population. The end of year 2020 projection was created by continuing the projection to mid-2021 and calculating an average of the mid-2021 and mid-2020 populations. Therefore, this is not a true projection to the end of 2020 that includes seasonal differences in fertility, migration, and mortality. Fertility and mortality assumptions were derived from provisional 2020 data, which are subject to revisions.
Migration data for the year to mid-2020 used published Migration Statistics Quarterly statistics from July 2019 to February 2020 and modelled estimates for March to June 2020. However, because of the lack of final data currently available for the following six months (1 July to 31 December 2020), we provide a range of scenarios.
The five scenarios align with our zero, low and principal migration variant projections (100,000 increments) included in our most recent 2018-based national population variant projections and provide an illustration of the potential size of the population if there were net emigration figures of 50,000 and 100,000 in the six months to 31 December. Both positive and negative increments were used to simulate net emigration and net immigration into the UK. These provide an illustration of the possible size of the UK population.
Limitations for both mid-2020 and to end of year 2020 indicators
Further limitations for both years are as follows:
The unadjusted fertility rates by age of mother follows that used in the 2018 NPPs, therefore does not directly reflect any potential impact on childbearing caused by the coronavirus pandemic.
Fertility and mortality assumptions enabling our end of 2020 figure are based on provisional data.
Provisional Northern Ireland mortality data used for the creation of end of year 2020 mortality assumptions were only available as total counts of deaths, therefore, when creating mortality rates, we have assumed that these deaths follow the projected age sex distribution from the projected deaths in the 2018-based NPPs for Northern Ireland; this is unlikely to have a significant impact on overall UK level mortality trends.
Migration assumptions use the 2018-based NPP age sex distributions and may not directly reflect the impact of the coronavirus on age-specific changes in international migration.
5. Early indicators of the size and structure of the UK population in 2020
Figure 1 shows annual percentage population change to mid-2020. Preliminary data suggest that the UK population continued to grow in the year to mid-2020 but at a slower rate than in recent years. Our early indicator shows that in the year to mid-2020 there was a 0.5% annual increase from mid-2019. This would be the lowest annual increase since the year to mid-2003.
Figure 1: Preliminary data suggest the UK population continued to grow in the year to mid-2020 but at a slower rate than any year since mid-2003
Annual population percentage change, mid-1991 to mid-2020, UK
Source: Office for National Statistics, National Records of Scotland, Northern Ireland Statistics and Research Agency
Download this chart Figure 1: Preliminary data suggest the UK population continued to grow in the year to mid-2020 but at a slower rate than any year since mid-2003
Image .csv .xlsTable 1 presents mid-2019 population estimates for the UK alongside an early indicator of the population in mid-2020 and a range of international migration scenario-based figures for 31 December 2020. By mid-2020 our early indicator suggests an overall population of 67.1 million, which represents a 316,000 or 0.47% annual increase from mid-2019. An age and sex distribution for these overall population-level figures is available in the dataset which accompanies this release.
For the end of 2020, we have developed and present five international migration scenarios ranging from net migration of 100,000 to negative 100,000. For the net migration scenario of 100,000, we would see a 0.15% increase in the population from mid-2020 to end of year 2020. Under the scenario of negative 100,000 net migration, the population by the end of 2020 would be 102,000 (negative 0.15%) smaller than in mid-2020.
| Age group | Official mid- 2019 estimate | Early indicator mid- 2020 | End of year 2020 scenarios | ||
|---|---|---|---|---|---|
| Net migration of -100,000 in six months to end of 2020 | Net zero migration | Net migration of 100,000 in six months to end of 2020 | |||
| 0-9 | 8,007,000 | 7,939,000 | 7,845,000 | 7,866,000 | 7,886,000 |
| 10-19 | 7,611,000 | 7,734,000 | 7,760,000 | 7,782,000 | 7,805,000 |
| 20-29 | 8,667,000 | 8,608,000 | 8,480,000 | 8,514,000 | 8,547,000 |
| 30-39 | 8,893,000 | 8,931,000 | 8,946,000 | 8,952,000 | 8,958,000 |
| 40-49 | 8,422,000 | 8,404,000 | 8,370,000 | 8,376,000 | 8,381,000 |
| 50-59 | 9,067,000 | 9,128,000 | 9,139,000 | 9,145,000 | 9,150,000 |
| 60-69 | 7,123,000 | 7,215,000 | 7,275,000 | 7,279,000 | 7,284,000 |
| 70-79 | 5,644,000 | 5,768,000 | 5,823,000 | 5,825,000 | 5,827,000 |
| 80+ | 3,363,000 | 3,386,000 | 3,371,000 | 3,372,000 | 3,373,000 |
| Total | 66,797,000 | 67,113,000 | 67,011,000 | 67,111,000 | 67,212,000 |
| Percentage change from most recent mid-year estimate | 0.54%* | 0.47% | -0.15%** | 0.0%** | 0.15%** |
Download this table Table 1: Official 2019 mid-year estimates and preliminary age structure of the UK population in 2020
.xls .csvFigure 2 presents the age structure of the early indicator against our most recent (2019) mid-year estimates. There are variations by age group, which are also clear in the dataset attached to this release. Early indicators suggest modest increases in older ages groups compared with 2019 mid-year estimates. The different migration scenarios have a relatively small impact on the size of the population in all age groups.
Figure 2: Preliminary data on the age structure of the UK population for 2020 suggests modest increases in older age groups compared with 2019 mid-year estimates
Official 2019 mid-year estimates and preliminary age structure of the UK population for 2020
Source: Office for National Statistics, National Records of Scotland, Northern Ireland Statistics and Research Agency
Download this chart Figure 2: Preliminary data on the age structure of the UK population for 2020 suggests modest increases in older age groups compared with 2019 mid-year estimates
Image .csv .xlsProvisional modelled estimates of net international migration show that, for March 2020, migration was estimated to be negative 16,700 (with an uncertainty range from negative 26,600 to negative 6,700). For the months between April and June 2020, the modelled estimates suggest net international migration ranged from negative 21,700 in June (with an uncertainty range from negative 31,900 to negative 11,500) to negative 12,000 in April (with an uncertainty range from negative 17,500 to negative 6,400). This reflects more people leaving the UK than arriving during the onset of the pandemic. When combined with International Passenger Survey (IPS) estimates for the previous eight months of the year, net international migration for the year ending June 2020 was around 282,000. This can be seen in Figure 3.
The latest official estimates of international migration for the year ending March 2020 remain those that were reported in the August 2020 Migration Statistics Quarterly Report. We are still working to fully understand changes in international migration during this period. The modelled estimates are provisional and subject to change as we complete further work in this area.
The monthly International Passenger Survey estimates of international migration flows have been derived for the purpose of producing modelled estimates and should not be treated as Official Statistics or used in any other context.
Figure 3: More people left the UK than arrived between March and June 2020, leaving net migration for the year ending June 2020 at 282,300
Cumulative net international migration, July 2019 to June 2020, UK
Source: Office for National Statistics
Download this chart Figure 3: More people left the UK than arrived between March and June 2020, leaving net migration for the year ending June 2020 at 282,300
Image .csv .xlsThe early indicators of the mid-2020 UK population presented in this release can be used to ascertain an initial view of differences to that previously projected for mid-2020 in the 2018-based National Population Projections (NPPs). Figure 4 compares the early insights published today with the 2018-based NPPs and previously published official mid-year estimates. It shows that the early indicator for mid-2020 suggests relatively smaller population growth than was projected in the 2018-based NPPs.
Figure 4: Our early indicator for mid-2020 suggests relatively smaller population growth than was projected in the 2018-based National Population Projections
Comparison of Official 2018-based National Population Projections (Principal Projection) and early indicators of UK population age structure for mid-2020

Source: Office for National Statistics, National Records of Scotland, Northern Ireland Statistics and Research Agency
Notes:
- The end of year 2020 figures were produced by taking an average of projected mid-2020 and mid-2021 populations. These are not true end of year projections and should only be interpreted as an indication.
Download this image Figure 4: Our early indicator for mid-2020 suggests relatively smaller population growth than was projected in the 2018-based National Population Projections
.png (108.3 kB) .xlsx (10.6 kB)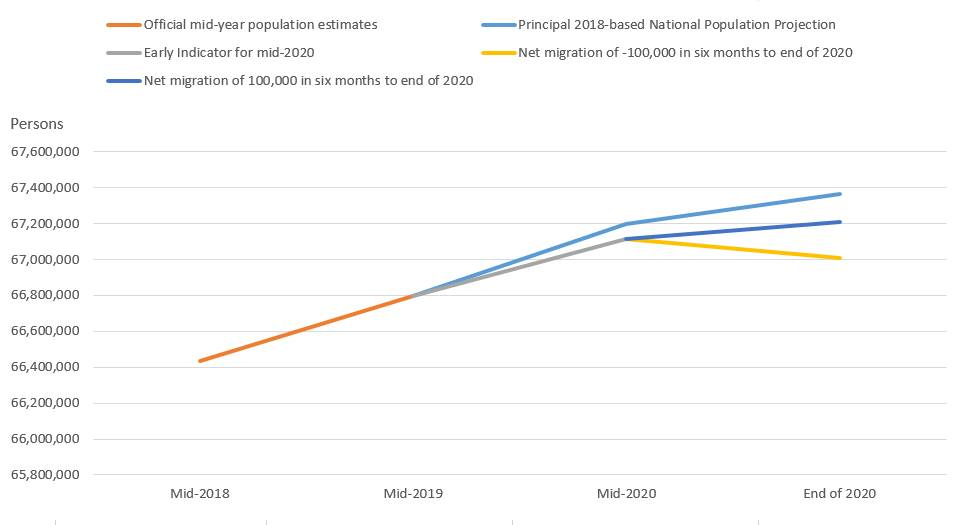
Figure 5 shows how the early indicators of the UK population at mid-2020 suggest that, overall, it was 0.12% smaller than that projected for mid-2020 (in 2018-based NPPs). The early indicators for mid-2020 suggest that at the oldest age group, 80 years and over, we see a larger difference (negative 0.67%) compared with the 2018-based NPPs. Other groups where we see modest difference to the NPPs are for the 70 to 79 years, 60 to 69 years, 30 to 39 years and 0 to 9 years age groups.
Figure 5: Our early indicator for mid-2020 suggests that at the oldest age group, 80 years and over, we see the largest difference compared to 2018-based National Population Projections
Comparison of Official 2018-based National Population Projections (Principal Projection) and early indicators of UK population age structure for mid-2020
Source: Office for National Statistics, National Records of Scotland, Northern Ireland Statistics and Research Agency
Download this chart Figure 5: Our early indicator for mid-2020 suggests that at the oldest age group, 80 years and over, we see the largest difference compared to 2018-based National Population Projections
Image .csv .xls6. Future developments
In summer 2021 we will publish the official mid-year population estimates for mid-2020. These will provide a detailed and geographically granular age and sex profile of the population. In spring 2022 we are planning to publish a provisional release of Census 2021 data, which will provide further detail on the population of England and Wales. Northern Ireland Census data will be released in summer 2022. When available, census data for Scotland (where the census takes place in 2022) will be combined to form UK-level comparisons.
When Census 2021 data are available for England and Wales, the Office for National Statistics (ONS) Centre for Ageing and Demography will integrate this into population estimates and projections including reconciliation and rebasing of the population of England and Wales in the decade since the 2011 Census. This will provide the most detailed, reliable, and up-to-date information on the England and Wales population.
We are also working to use administrative data sources to give new and detailed insights on the population. As detailed in our transformation overview today, we will also continue to integrate new data sources into the population and migration statistics system to provide new, timely and detailed insights on the population. We are always keen to receive feedback on our methods and approaches. Please contact us at pop.info@ons.gov.uk with any comments.
Back to table of contents