1. Main points
The population of the UK is projected to increase by 3.0 million (4.5%) in the first 10 years of the projections, from an estimated 66.4 million in mid 2018 to 69.4 million in mid 2028.
England’s population is projected to grow more quickly than the other UK nations: 5.0% between mid 2018 and mid 2028, compared with 3.7% for Northern Ireland, 2.7% for Wales and 1.8% for Scotland.
Over the next 10 years, 27% of UK population growth is projected to result from more births than deaths, with 73% resulting from net international migration; although net migration falls during this period, the number of deaths rises as those born in the baby boom after World War Two reach older ages.
The UK population is projected to pass 70 million by mid 2031, reaching 72.4 million by 25 years into the projection (mid 2043).
There will be an increasing number of older people; the proportion aged 85 years and over is projected to almost double over the next 25 years.
The UK population growth rate is slower than in the 2016-based projections; the projected population is 0.4 million less in mid 2028 and 0.9 million less in mid 2043.
National population projections do not attempt to predict the impact of political circumstances such as Brexit.
Statistician’s comment
“The UK population is projected to grow by 3 million people by 2028. This assumes migration will have a greater impact on the size of the population than the combination of births and deaths. Although migration declines at first and the number of births is stable, the number of deaths is projected to grow as those born in the baby boom after World War Two reach older ages.
“The population is increasingly ageing and this trend will continue. However, because of the expected rise in the State Pension age to 67 years, it is projected that slightly fewer than one in five people will be of pensionable age in 2028, a similar proportion to today.”
Andrew Nash, Population Projections Unit, Office for National Statistics.
Follow the ONS Centre for Ageing and Demography on Twitter @RichPereira_ONS
Back to table of contents2. UK population
Figure 1: UK population projected to rise to 69.4 million by mid 2028 and to 72.4 million by mid 2043
UK population estimates, mid 1993 to mid 2018, and projections to mid 2043
Source: Office for National Statistics – National population projections
Download this chart Figure 1: UK population projected to rise to 69.4 million by mid 2028 and to 72.4 million by mid 2043
Image .csv .xlsThe UK population, which was 66.4 million in mid 2018, is projected to rise to 69.4 million over the decade to mid 2028. It is then projected to pass 70 million by mid 2031 and reach 72.4 million by 25 years into the projection (mid 2043).
The total projected increase in the UK population over the next 25 years is less than that over the past 25 years (Figure 1). Between mid 1993 and mid 2018, the population grew by 9.0 million (15.1%); between mid 2018 and mid 2043, it is projected to grow by another 6.0 million (9.0%).
| Millions | ||||||
|---|---|---|---|---|---|---|
| 2018 | 2023 | 2028 | 2033 | 2038 | 2043 | |
| UK | 66.4 | 68.1 | 69.4 | 70.5 | 71.4 | 72.4 |
| England | 56.0 | 57.6 | 58.8 | 59.8 | 60.8 | 61.7 |
| Wales | 3.1 | 3.2 | 3.2 | 3.2 | 3.2 | 3.3 |
| Scotland | 5.4 | 5.5 | 5.5 | 5.6 | 5.6 | 5.6 |
| Northern Ireland | 1.9 | 1.9 | 2.0 | 2.0 | 2.0 | 2.0 |
Download this table Table 1: Estimated and projected population of the UK and constituent countries, mid 2018 to mid 2043
.xls .csvFocusing on the 10 years between mid 2018 and mid 2028 (Table 1), the total projected growth for the UK population is 3.0 million, or 4.5%. This represents an average annual growth rate of 0.4%. Projected growth varies substantially between the four countries of the UK: England’s population is projected to grow by 5.0% over this period; for Northern Ireland, the figure is 3.7%; while for Wales and Scotland, the figures are 2.7% and 1.8% respectively.
Over the full 25 years between mid 2018 and mid 2043, England is projected to have the largest increase in population, at 10.3%. The projected increase over the same period for Northern Ireland is 5.7%, that for Wales is 3.7% and that for Scotland is 2.5%.
Back to table of contents3. Births, deaths and migration
During the 10 years between mid 2018 and mid 2028, the projections for the UK as a whole suggest:
7.2 million people will be born
6.4 million people will die
5.4 million people will immigrate long term to the UK
3.3 million people will emigrate long term from the UK
This means that of the 3.0 million increase in total population, 0.8 million (27%) is projected to result from the higher number of births than deaths and 2.2 million (73%) is projected to result directly from net international migration.
Over the full 25-year period between mid 2018 and mid 2043, the proportion of growth resulting from the balance of births and deaths is projected to be lower, at 16%, and that from net international migration is projected to be higher, at 84%.
As Figure 2 shows, projected net international migration declines at first and then is constant from the year ending mid 2025. However, there is a steady increase in the number of deaths as people born in the baby boom generations after World War Two and in the 1960s reach older ages. This means that although net migration is constant, it represents an increasing proportion of the projected growth.
Figure 2: Over time, births and deaths reach similar levels so net international migration causes most growth
Projected births, deaths and net migration, UK, years ending mid 2019 to mid 2043
Source: Office for National Statistics – National population projections
Download this chart Figure 2: Over time, births and deaths reach similar levels so net international migration causes most growth
Image .csv .xlsAccounting for the indirect impact of international migration
As well as the direct impact, international migration has an indirect impact on the population as it changes the number of births and, to a lesser extent in the shorter term, the number of deaths. For example, births to, and deaths of, people who had migrated to the UK; or births to, and deaths of, people who emigrated from the UK (and who would have given birth, or died, in the UK had they not emigrated).
Once the indirect effect is included, international migration accounts for 79% of the projected UK population growth over the 10 years between mid 2018 and mid 2028. Over the 25 years between mid 2018 and mid 2043, the projected population would fall slightly if there were no migration. Because migrants are concentrated at young adult ages, the impact of migration on the projected number of women of childbearing age is especially important over this period.
International migration to and from the UK before the projection base year of 2018 will also influence future population growth, in the sense that past migrants and their descendants will contribute to the projected numbers of births and deaths. This aspect is complex, so our calculations of the indirect effect only take into account migration after mid 2018.
Section 5 provides details of our long-term assumptions for fertility, mortality and migration and how these assumptions have changed since the 2016-based projections.
Back to table of contents4. Changing age structure
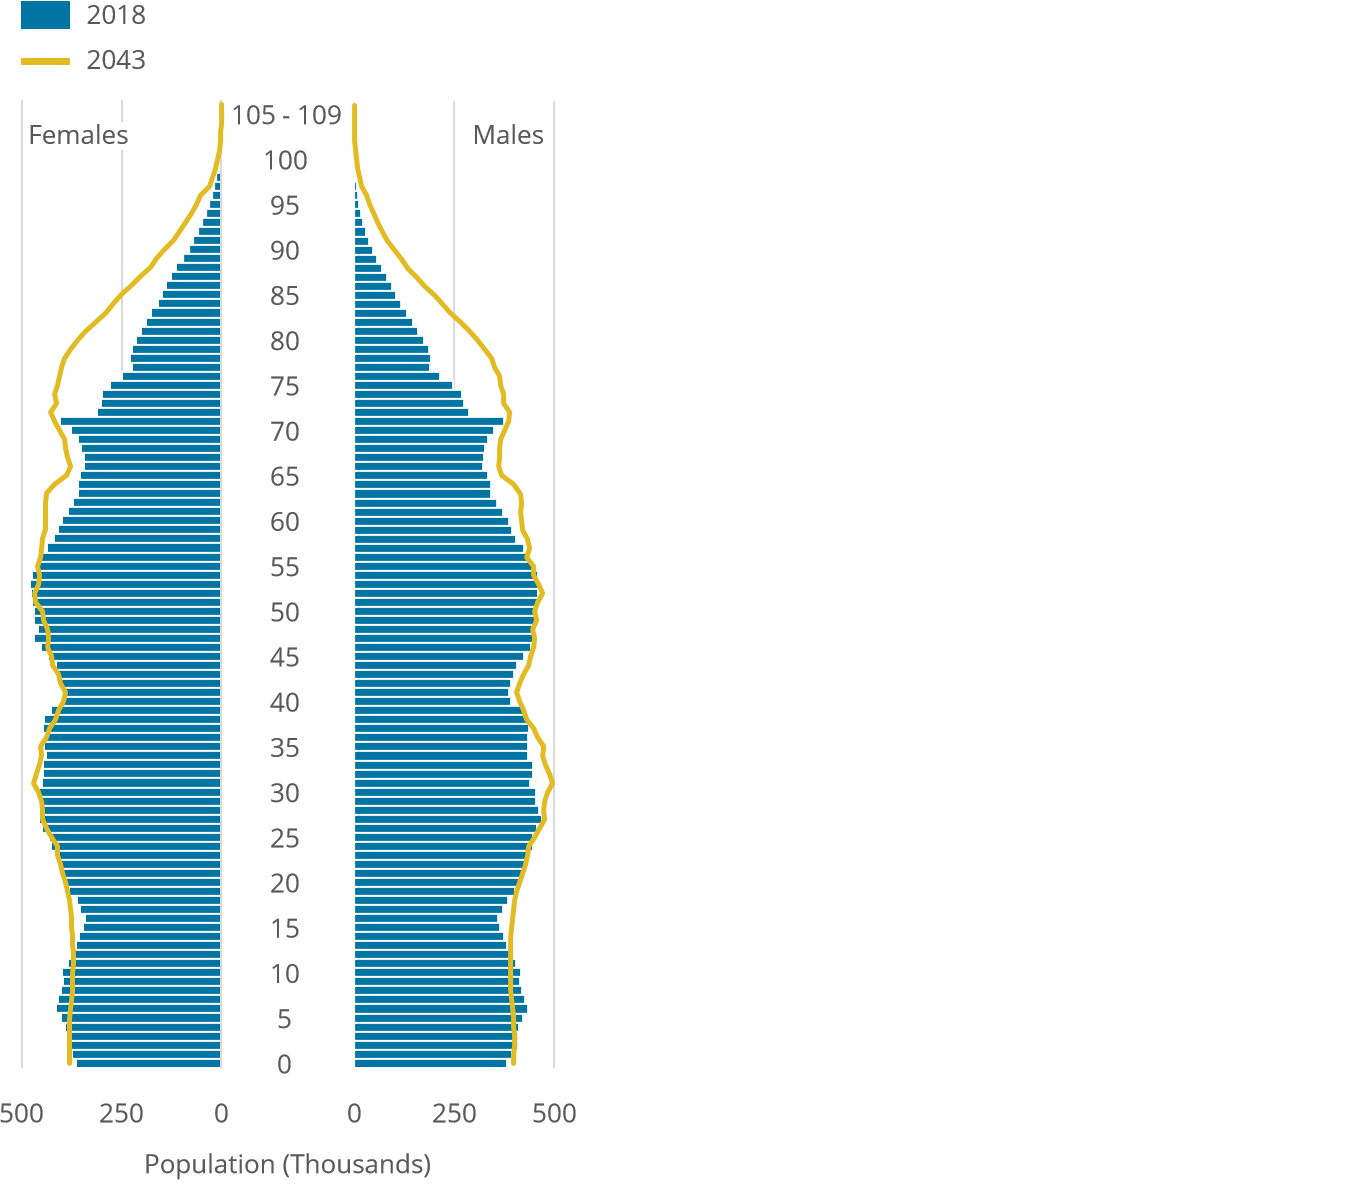
Figure 3: There is a growing number of older people in the UK
Age structure of the UK population, mid 2018 and mid 2043
Source: Office for National Statistics – National population projections
Download this image Figure 3: There is a growing number of older people in the UK
.png (73.8 kB) .xlsx (22.4 kB)
The population pyramid in Figure 3 compares the age structure of the population in mid 2018 with the projected age structure in mid 2043.
In mid 2018, there are more females than males at older ages, reflecting their higher life expectancy. The spike at age 71 years reflects the baby boom after World War Two and the wider area peaking at age 53 years reflects the baby boom of the 1960s. The narrowing in the teenage years corresponds with the low birth rates around the turn of the millennium.
By mid 2043, all these features are still present in the pyramid, with the peaks and troughs now located 25 years higher up the age scale. The changes to the numbers at each age are constantly evolving as a result of births, deaths, migration and everyone getting older. We will now consider each life stage.
More people at older ages
In mid 2043, there are projected to be many more people at older ages. This partly reflects the 1960s baby boomers now being aged around 80 years but also general increases in life expectancy. In mid 2018, there were 1.6 million people aged 85 years and over; by mid 2043, this is projected to nearly double to 3.0 million.
Variation in people of working ages
For people of working ages, some age groups have slightly more people, some slightly fewer. This is substantially affected by the number of people at each age in mid 2018, with international migration also having the greatest impact at these ages.
Fewer young children and more adolescents
There are fewer young children in mid 2043 but more in their mid teens; this is influenced by our assumed fertility rates in the 2020s and 2030s being lower than those around 2010 but higher than those around 2001 when UK fertility was at a record low.
Figure 4 shows the changing age structure by life stage: children, working age and pensionable age. By mid 2028, the number of children (those aged from 0 to 15 years) reduces slightly but taking into account the planned increases in State Pension age (SPA) to 67 years old for both sexes, the number of those of pensionable age increases slightly. The number of people of working age has the largest growth.
Continuing to mid 2043, Figure 4 shows that the numbers of children and people of working age are projected to remain around the mid-2028 levels, but the number of those at pensionable age increases substantially. Over the full period from mid 2018 to mid 2043, the number of people of pensionable age increases by 3.6 million (30%).
Figure 4: The number of people of pensionable age is projected to grow the most
UK population by life stage, mid 2018, mid 2028 and mid 2043
Source: Office for National Statistics – National population projections
Notes:
- Children are defined as those aged 0 to 15 years.
- Working age and pensionable age populations are based on State Pension age (SPA) for the stated year. Under current legislation, the SPA in mid 2028 and mid 2043 will be 67 years old for both sexes.
Download this chart Figure 4: The number of people of pensionable age is projected to grow the most
Image .csv .xlsThe numbers of people in each life stage are important when considering dependency ratios, which inform government financial planning. A common measure is the old-age-dependency ratio (OADR), which is the number of people of pensionable age for every 1,000 people of working age. The OADR is projected to decline from 295 in mid 2018 to 290 in mid 2028, then rise to 360 by mid 2043.
Interactive population pyramids
You can explore in more detail how the UK population is projected to evolve over time in our interactive population pyramids. As well as our principal projection, on which all the analysis in this bulletin is based, they also include a range of variant projections. National population projections, variant projections: 2018-based has more information on these.
Figure 5: Use our interactive population pyramids to explore our projections
Embed code
5. Changes since the 2016-based projections
The 2018-based projections differ from the previous set, the 2016-based projections. This is partly because they are based on the population estimate from mid 2018 rather than mid 2016, as well as the latest data on births, deaths and migration. We have also updated our assumptions about the future.
Net international migration
We have assumed higher net international migration. This is because we have retained the approach of basing our assumption on the average levels of migration over the past 25 years. Average annual net long-term international migration over the 25 years between mid 1993 and mid 2018 was 190,000. This compares with the average of 165,000 between mid 1991 and mid 2016, which we set as the assumption in the 2016-based projections.
Fertility
We have assumed that women will have fewer children. This reflects the recent fall in total fertility rates, which has continued in the two years since we published the 2016-based projections.
Life expectancy
Life expectancy increases less than in the 2016-based projections. This is a consequence of the continued limited growth in life expectancy over the last two years.
| 2016-based | 2018-based | |
|---|---|---|
| Net annual long-term international migration (year ending mid 2025 onwards) | +165,000 | +190,000 |
| Long-term average number of children per woman | 1.84 | 1.78 |
| Life expectancy at birth, males, 2043 (years) | 83.6 | 82.6 |
| Life expectancy at birth, females, 2043 (years) | 86.4 | 85.5 |
Download this table Table 2: Summary of changes to long-term assumptions in UK projections, 2016-based and 2018-based
.xls .csvThe mid-2018 UK population estimate was 30,000 lower than projected in the 2016-based projections, meaning a slightly lower starting point. Also, the changes indicated in Table 2 combine to reduce future population growth. In consequence, comparing the 2016-based projections with the 2018-based projections:
the projected UK population in mid 2028 was 69.8 million; this has been reduced to 69.4 million
the projected UK population in mid 2043 was 73.3 million; this has been reduced to 72.4 million
the UK population was projected to pass 70 million by mid 2029; it is now projected to do so by mid 2031
the old-age-dependency ratio (OADR) in mid 2043 was projected to be 372; this has been reduced to 360
More information on the 2018-based assumptions and how we set them is available in National population projections, how the assumptions are set: 2018-based.
Back to table of contents6. Comparisons with other countries
The EU statistical office, Eurostat, publishes population projections for the current members of the EU. They are based on 2018 and use different methods from those of the Office for National Statistics (ONS). Eurostat projects that the UK population at the start of 2040 will be 75.3 million. This is substantially higher than our (2018-based) mid-2040 projection of 71.8 million.
Eurostat’s projections suggest the total population of the current EU members will increase by 2% between 2018 and 2040, varying between 40% growth for Luxembourg and 18% decline for Lithuania.
On that basis, the UK’s projected growth of 14% between 2018 and 2040 is much higher than the EU average. It is also the highest growth rate among the four largest nations in the EU: over the same period, France’s population is projected to grow by 6% and Germany’s is projected to see a slight increase of 1%, while Italy’s population is projected to decline by 5%.
The UN also produces population projections. Their methods are different again, projecting a UK population of 73.0 million in mid 2043, which is 0.6 million higher than our projection. This is an 8% increase on mid 2020, compared with a projected world population increase of 20% over the same period.
The UN’s projections for the world’s three most populous nations, also for the period mid 2020 to mid 2043, see an increase of 17% for India and a 12% increase for the US, while China’s population is projected to see a very slight decline. At opposite ends of the scale, Niger’s population is projected to grow by 121%, while the populations of Lithuania, Latvia and Bulgaria are projected to decline by 18%.
These comparisons demonstrate that projected population growth or decline varies considerably across the globe. It also shows that different methods can lead to substantially different results.
Back to table of contents7. National population projections data
National population projections dataset
Datasets | Released 21 October 2019
You can use our table of contents tool to navigate through this release. The tool contains links to our full range of data and documentation. It lists all the datasets available (over 200) and allows you to filter by variable and geography. You can also access methodological information and all related background information associated with the 2018-based national population projections (NPPs).
8. Glossary
Long-term assumptions
The 2018-based national principal projections are based on a set of long-term assumptions considered to best reflect recent patterns of future fertility, mortality and net migration. The assumptions are:
average UK completed family size will reach 1.78 children per woman by 2043, increasing to close to 1.79 later in the projection
by 2043, the annual improvement in UK mortality rates will be 1.2% for most ages for both males and females
from the year ending mid 2025 onwards, average annual net international migration to the UK will be plus 190,000
Life expectancies
Life expectancies at birth are period expectations of life; this is the average number of years that a newborn baby could expect to live if the mortality rates at the time of their birth stayed constant through their lives. For example, life expectancy in the year between mid 2042 and mid 2043 reflects that projected for the start of 2043. It does not account for the continuing decline in mortality rates projected after that point.
Old-age-dependency ratio (OADR)
The number of people of pensionable age for every 1,000 people of working age.
Population projections
Population projections provide statistics on potential future population levels of the UK and its constituent countries by age and sex. They are based on assumptions of future levels of births, deaths and migration.
Total fertility rate
The total fertility rate (TFR) represents the average number of children born per woman if women experienced the age-specific fertility rates (ASFRs) of the year in question throughout their childbearing lives.
Variant projections
Variant projections are based on alternative assumptions of fertility, mortality and migration compared with the principal projection. These provide an indication of uncertainty but do not represent upper or lower limits of future demographic behaviour.
Back to table of contents9. Measuring the data
The 2018-based national population projections (NPPs) provide statistics on potential future population levels of the UK and its constituent countries by age and sex. We base them on the estimated population at 30 June 2018, using an internationally accepted methodology that accounts for the impact over time of the latest births, deaths and migration flows. This release supersedes the 2016-based projections.
Our principal projection is based on assumptions considered to best reflect recent patterns of fertility, life expectancy and migration. It is not possible to know how these patterns may change in future so, to reflect this uncertainty, we also produce a number of variant population projections, based on alternative future scenarios.
To create our projections, we also use a set of demographic long-term assumptions for fertility, mortality and migration. We derive the assumptions through extrapolation of past trends and by consideration of expert views.
We produce the variant projections using the same method but with alternative assumptions of future levels of fertility, mortality and migration. An overview of our decision-making process and further detail on our methods is included in National population projections, how the assumptions are set: 2018-based.
More information on the quality and methodology of the NPPs, including the accuracy of the release and how the outputs meet users’ needs, is available in the Quality and Methodology Information (QMI) report.
A general background and methodology report on the NPPs is also available. This provides more detailed information on the methodology used to produce the projections.
Proposed timing of next projections
We will publish the 2018-based subnational projections for England, which break the NPPs in this publication down to local authority and health authority level, on 24 March 2020. We will then publish the 2018-based household projections for England, which also go down to local authority level, in late spring or early summer 2020.
We usually publish population projections every two years. However, we are currently proposing not to produce 2020-based projections, which would theoretically be published in autumn 2021 for the national and spring 2022 for the subnational projections. This is because the first 2021 Census results are also expected in spring 2022; we therefore propose that the next round of projections will be based on 2021, enabling them to use the updated base population that the 2021 Census results will offer. This approach would also apply to our household projections.
At this stage, this is not a definitive policy and we cannot be certain of exact timings. Factors that will affect our plans include how different the 2021 Census results are from the current population estimates and our evaluation of the causes of any differences. However, we aim to produce NPPs using a mid-2021 population base by around the end of 2022.
We would welcome any feedback on this proposed approach. In addition, please note that updates on this will be communicated in our quarterly Migration and Population Statistics Newsletter. To sign up to this, please contact us at pop.info@ons.gov.uk.
Transformation of population statistics
It is our mission to provide the best insights on population and migration using a range of new and existing data sources to meet the needs of our users. Our ambition is to deliver a fully transformed system by 2023, making regular improvements to our statistics along the way as more administrative data become available. We will rigorously quality assure new methods and share the impact of any changes made. The Transformation of the population and migration statistics system: overview gives more information on this work. The resulting improvements will also be incorporated into future editions of population projections.
Back to table of contents10. Strengths and limitations
The Office for National Statistics’ (ONS’) national population projections (NPPs) are used both within and outside of government as the definitive set of NPPs. We produce them on a consistent basis for the constituent countries of the UK using the internationally accepted cohort component methodology. Examples of their uses include informing fiscal projections, identifying future demand for health and education services, and estimating the future cost of state pensions.
We base the projections on the latest mid-year population estimates for each UK country and the latest births, deaths and migration data. The projections are not forecasts and so will differ from actual future outcomes to a greater or lesser extent.
There is already a margin of error in the underlying data, for example, estimates of the current population and past migration flows. In addition, our assumptions about the future cannot be certain as patterns of births, deaths and migration are always liable to change and can be influenced by many factors. In most cases, each set of projections is superseded when the next scheduled release is published. However, should there be cause to revise a specific set of projections – for example, because of an error in production – the policy on revisions is outlined in the Quality and Methodology Information (QMI) report.
Two factors that may affect future population are political and economic changes, but it is not possible to know in advance what impact these will have. On that basis, the projections do not attempt to predict the impact of the UK leaving the EU. However, the projections of people of State Pension age (SPA) do reflect future changes under existing legislation.
This bulletin focuses on the first 25 years of the projections, up to mid 2043. The data files include projections going forward 100 years, up to mid 2118. However, such long-term projections are inevitably very uncertain as much may change over that timescale.
Back to table of contentsContact details for this Statistical bulletin
You might also be interested in:
- National population projections QMI
- National population projections, background and methodology: 2018 based
- National population projections, migration assumptions: 2018 based
- National population projections, fertility assumptions: 2018 based
- National population projections, mortality assumptions: 2018 based
- National population projections, how the assumptions are set: 2018 based
- National population projections, variant projections: 2018 based