Table of contents
- Main points
- Statistician’s quote
- Things you need to know
- Net migration to the UK remains similar to recent levels
- Immigration to the UK was among the highest recorded levels
- Emigration from the UK was 306,000, with most leaving for work
- Where can I find more information?
- Changes in this release
- Understanding the main terms used in this report
- A note on sampling and uncertainty
- Future releases
- Quality and methodology
1. Main points
The reporting period for the International Passenger Survey data in this release covers the year ending March 2016 and therefore does not cover the period after the EU referendum. Visa, National Insurance number (NINo) and labour market data provide data to the end of June and therefore do not include more than a few days after the EU referendum.
Long-Term International Migration estimates in the year ending (YE) March 2016 were:
net migration = +327,000 (down 9,000 from YE March 2015 but not statistically significant), comprising +180,000 EU citizens, +190,000 non-EU citizens, and -43,000 British citizens
immigration = 633,000 (down 11,000 from YE March 2015 but not statistically significant)
emigration = 306,000 (down 2,000 from YE March 2015 but not statistically significant)
Net migration was 7,000 lower than the revised estimate of +334,000 for YE December 2015.
None of the headline changes are statistically significant and although immigration and net migration show small decreases, these reductions are in comparison with record level estimates a year ago; overall the trend at present seems broadly flat.
Immigration of EU citizens (268,000) remains lower than that of non-EU citizens (282,000), although the gap has narrowed partly due to increases in immigration from EU15 and EU2 citizens in recent years (EU2 immigration now at a record high of 69,000).
Work remains the most common reason for long-term immigration (303,000), with 176,000 of these coming with a definite job to go to and 127,000 looking for work.
There were 631,000 National Insurance number (NINo) registrations by EU nationals in YE June 2016 and 193,000 by non-EU nationals, with both showing a fall from YE June 2015, though latest quarterly figures show NINo registrations remaining level; note the NINo data include short-term migrants and should not be directly compared with estimates of Long-Term International Migration, as per our information note of 12 May 2016.
Long-term immigration to the UK for study was estimated to be 164,000 in total (that is, including EU, non-EU and British citizens) in YE March 2016, the lowest estimate since YE December 2007 and a statistically significant reduction (28,000) from 192,000 in YE March 2015. The visa data for non-EU applicants to study in higher education in YE June 2016 were 163,338 (down 2% compared with the previous year).
There were 44,323 asylum applications (including dependants) in YE June 2016, the sixth successive annual increase (although the number is less than half the level of the peak in 2002 (103,081)).
Back to table of contents2. Statistician’s quote
"Net migration remains at record levels although the recent trend is broadly flat. The influx of Romanians and Bulgarians has also reached a new high, although that's off-set by falls in non-EU immigration and from other central and eastern European countries. Work remains the main reason for migration, followed by study which has seen a significant fall in the number of people coming to the UK for education."
"It's important to remember that these figures only go up to the end of March and do not cover the period following the UK's vote to leave the European Union."
Nicola White, Head of International Migration Statistics, Office for National Statistics
Back to table of contents3. Things you need to know
This edition of the Migration Statistics Quarterly Report (MSQR) covers Office for National Statistics (ONS) statistics for the year ending (YE) March 2016, though statistics from other sources may cover different periods, as stated. More detail can be found in charts and tables in the accompanying download of provisional data tables alongside this report, including a breakdown of the statistics by main reason or by citizenship grouping. Definitions of the main terms used in the report can be found at the end of the report, along with links to find more information and a note on statistical uncertainty.
The reporting period for Long-Term International Migration (LTIM) data in this release covers the year ending March 2016 and therefore does not cover the period after the EU referendum. Visa, National Insurance number (NINo) and labour market data is available to the end of June and therefore do not include more than a few days after the EU referendum. Our next release, on 1 December 2016 will include LTIM data for the year ending June 2016 (with visa and NINo data to YE September 2016 and labour market data for July to September 2016) and will therefore cover a very short period following the EU referendum although the vast majority of the data will still reflect the period prior to the referendum. Data covering a full year after the referendum (YE June 2017) will be available in December 2017. For more details on when ONS outputs will cover the referendum period, please go to the Visual.ONS website.
There is considerable interest in migration statistics both nationally and internationally and they are a fundamental component of our mid-year population estimates. These are used for planning and service delivery, resource allocation and managing the economy. Additionally, migration statistics have been used to monitor progress against the government’s stated ambition of delivering annual net migration in the tens of thousands, not the hundreds of thousands1.
ONS migration statistics use the UN recommended definition of a long-term international migrant: “A person who moves to a country other than that of his or her usual residence for a period of at least a year (12 months), so that the country of destination effectively becomes his or her new country of usual residence.”
Long-Term International Migration (LTIM) estimates are based on data from the International Passenger Survey (IPS), with adjustments made for asylum seekers, non-asylum enforced removals, people resettled in the UK under resettlement schemes, visitor and migrant switchers and flows to and from Northern Ireland. LTIM estimates are used where available. Estimates of citizenship by reason for migration are based solely on IPS data. In these cases the IPS totals will not match LTIM totals, but will give a good measure of magnitude and direction of change. It should be noted that the IPS data for 2015 published with this release are finalised IPS data and replace the provisional data used in previous publications. LTIM estimates for 2015, and all IPS and LTIM estimates for 2016, remain provisional.
Figures relating to visas are produced by the Home Office and include long-term and short-term migrants and their dependants; the Department for Work and Pensions National Insurance number (NINo) allocations to adult overseas nationals also include long-term and short-term migrants.
Short-Term International Migration estimates for England and Wales, covering those coming to the UK for 1 to 12 months, are published annually by ONS, with the most recent (for mid-2014) published in May 2016.
On 12 May 2016 we published an information note on the reasons why LTIM figures from the IPS differ from NINo registrations noting:
short-term migration to the UK largely accounts for the recent differences between the number of long-term migrants (as estimated by the IPS) and the number of NINo registrations for EU citizens
IPS continues to be the best source of information for measuring LTIM; NINo registrations data are not a good measure of LTIM, but they do provide a valuable source of information to highlight emerging changes in patterns of migration
We intend to continue to work on these data sources and hope to be able to publish further analysis in due course.
Notes for Things you need to know
- Conservative Manifesto 2015 (page 29) – reiterated by the present government.
4. Net migration to the UK remains similar to recent levels
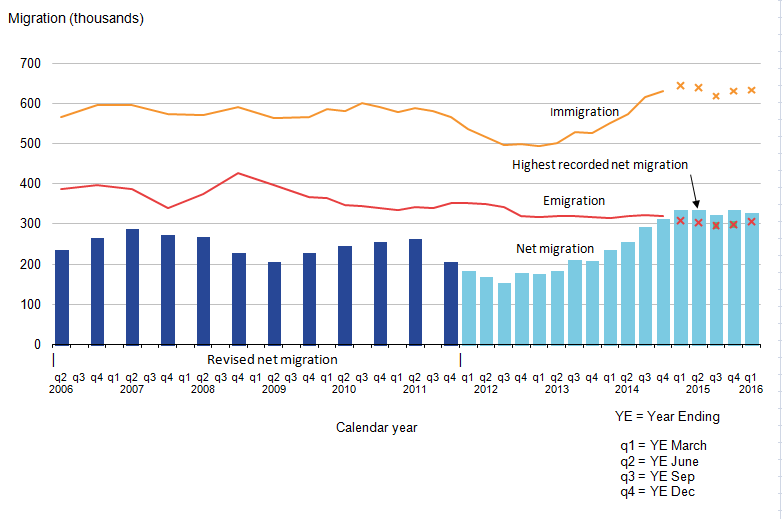
The net migration estimate (the difference between immigration and emigration) for the year ending (YE) March 2016 is +327,000 and has a 95% confidence interval of +/-40,000, a decrease (although not statistically significant) from the record high estimate of +336,000 (+/-41,000) in YE March 2015.
The net migration estimate for YE March 2016 was 7,000 lower than the +334,000 estimated for YE December 2015.
(From here on, any reference to change, such as increase or decrease, refers to YE March 2016 compared with YE March 2015. All estimates quoted within this section are Long-Term International Migration (LTIM)-based estimates, and comparisons are not statistically significant, unless otherwise stated.)
Table 1 shows the headline figures for YE March 2015 and YE March 2016 with their corresponding confidence intervals. Statistically significant changes are normally denoted with an asterisk, but no changes in this table are statistically significant in this period. Note that the estimates given are the sum of the EU, non-EU AND British citizenship groupings.
Table 1: Latest changes in migration, UK, year ending March 2015 and year ending March 2016
| thousands | |||||
| YE Mar 2015 | 95% CI | YE Mar 2016 | 95% CI | Difference | |
| Net migration | 336 | +/-41 | 327 | +/-40 | -9 |
| Immigration | 644 | +/-35 | 633 | +/-34 | -11 |
| Emigration | 308 | +/-21 | 306 | +/-21 | -2 |
| Source: Office for National Statistics, Long-Term International Migration | |||||
| Notes: | |||||
| 1. 2015 and 2016 estimates are provisional. | |||||
| 2. Figures are rounded to the nearest thousand. Figures may not sum due to rounding. | |||||
| 3. Further information on confidence intervals can be found in the MSQR Information for Users. | |||||
| 4. YE = Year Ending. | |||||
| 5. CI = Confidence Interval. | |||||
| 6. Statistically significant change at the 5% level is indicated by an asterisk. | |||||
Download this table Table 1: Latest changes in migration, UK, year ending March 2015 and year ending March 2016
.xls (28.2 kB)The most recent decrease in net migration results from a decrease in immigration coupled with a similar level of emigration compared with the previous year. The decrease in immigration has been driven by a fall in the number of non-EU and EU8 immigrants despite a rise in EU2 immigrants (for a definition of the EU country groupings in EU2, EU8 and EU15, see the Understanding the main terms used in this report section). None of the headline changes are statistically significant and although immigration and net migration show small decreases, those decreases are in comparison with record level estimates a year ago. Overall the trend at present appears broadly flat. For more detail on these changes, see the Immigration section of this report and the published datasets that accompany this report.
Figure 1: Long-Term International Migration, UK, 2006 to 2016 (YE March 2016)
Source: Office for National Statistics, Long-Term International Migration
Notes:
- Figures for years ending 2015 and 2016 are provisional. In this chart provisional estimates are shown separated by a break in the series.
- Net migration estimates for the period 2001 to 2011 have been revised in light of the 2011 Census. Immigration and emigration estimates have not been revised and are therefore not consistent with the revised net migration estimates. The revised estimates are only available for the years ending June and December each year.
- Users are encouraged to review the published tables for confidence intervals and an insight into the inherent uncertainty in these statistics.
Download this image Figure 1: Long-Term International Migration, UK, 2006 to 2016 (YE March 2016)
.png (30.8 kB) .xls (39.4 kB)
Our online interactive timeline provides annual totals and additional commentary from 1970 to 2014 to show the longer-term context, with the underlying data available for download by clicking the Source link on the chart.
Figure 2 shows the trend in net migration for EU, non-EU and British citizens and shows that net migration for non-EU citizens remains higher than that for EU citizens, although the gap has narrowed in recent years. Users are encouraged to visit the datasets that accompany this release, which break down these groupings further so that the various changes in smaller country groupings can be seen.
Figure 2: Net Long-Term International Migration by citizenship, UK, 1975 to 2016 (year ending March 2016)
Source: Office for National Statistics, Long-Term International Migration
Notes:
- Figures for 2015 and 2016 are provisional and quarterly. All other figures are final calendar year estimates of LTIM. In this chart provisional estimates are shown separated by a break in the series.
- This chart is not consistent with the revised total net migration estimates as shown in Figure 1. This also means that estimates for the period 2001 to 2011 are not fully comparable with those for later periods.
- Figures up to and including 1990 are IPS only, and from 1991 onwards are LTIM.
- Users are encouraged to review the published tables for confidence intervals and an insight into the inherent uncertainty in these statistics.
Download this chart Figure 2: Net Long-Term International Migration by citizenship, UK, 1975 to 2016 (year ending March 2016)
Image .csv .xlsEU citizens
Net migration for EU citizens was estimated to be 180,0001 in YE March 2016 (compared with 184,000 in YE March 2015). The change in EU net migration results from net migration of EU8 citizens (40,000, compared with 51,000 a year ago) partially off-setting EU2 net migration, which is now estimated at the record level of 61,000 compared with 51,000 a year ago. Net migration of EU15 citizens remained similar to the previous year at 78,000.
Non-EU citizens
In YE March 2016, non-EU net migration was 190,000, compared with 200,000 the previous year.
British citizens
Net migration of British citizens was estimated to be -43,000 meaning more British people left the UK than came to the UK.
Notes for Net migration to the UK remains similar to recent levels
- Throughout the report, you are encouraged to review our published tables and note the confidence intervals around our estimates. These confidence intervals give an indication of the accuracy of the estimates and the extent to which comparisons can be drawn between them.
5. Immigration to the UK was among the highest recorded levels
The latest immigration estimate for the year ending (YE) March 2016 is 633,000, with a confidence interval of +/-34,000, compared with the record high 644,000 (+/-35,000) in YE March 2015.
(From here on, any reference to change, such as increase or decrease, refers to YE March 2016 compared with YE March 2015. All estimates quoted within this section are Long-Term International Migration (LTIM)-based estimates, and comparisons are not statistically significant, unless otherwise stated.)
Immigration of EU citizens was estimated to be 268,000, similar to the 270,000 the previous year. Immigration of non-EU citizens (282,000 compared with 290,000 the previous year) remained higher than that of EU citizens (Figure 3) although the gap has narrowed in recent years.
Figure 3: Immigration to the UK by citizenship, 2006 to 2016 (year ending March 2016)
Source: Office for National Statistics, Long-Term International Migration
Notes:
- Figures for 2015 and 2016 are provisional. In this chart provisional estimates are indicated with a 'p' when hovering the mouse over the series.
- This chart is not consistent with the total revised net migration estimates as shown in Figure 1.
Download this chart Figure 3: Immigration to the UK by citizenship, 2006 to 2016 (year ending March 2016)
Image .csv .xlsEU citizens
Figure 4 shows how EU immigration is split between the 3 main EU groups, highlighting the fall in EU8 immigration, and the increase in EU2 immigration to its highest recorded level, although neither change is statistically significant compared with one year ago (for a definition of the EU country groupings in EU2, EU8 and EU15, see the Understanding the main terms used in this report section). Long-term immigration from the EU had been rising since 2012 but now appears broadly flat. Immigration of EU2 citizens in the latest estimates has drawn level with EU8 for the first time (69,000 and 68,000 respectively), although it is still lower than the peak levels for EU8 in 2007.
Figure 4: EU immigration to the UK, 2006 to 2016 (year ending March 2016)

Source: Office for National Statistics, Long-Term International Migration
Notes:
- Figures for 2015 and 2016 are provisional. In this chart provisional estimates are represented by a cross.
- This chart does not include data for citizens of Malta, Cyprus nor Croatia.
Download this image Figure 4: EU immigration to the UK, 2006 to 2016 (year ending March 2016)
.png (32.5 kB) .xls (35.8 kB)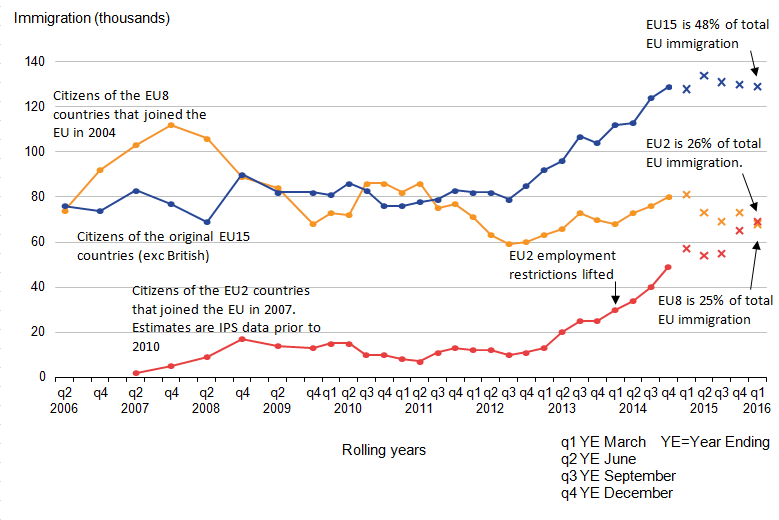
Non-EU citizens
Immigration of non-EU citizens was estimated to be 282,000 compared with 290,000 the previous year. No statistically significant changes were seen for individual country groupings, though users can see contrasting increases and decreases in the datasets that accompany this report.
Nationality information on individuals that are subject to immigration controls, coming from non-EU countries, is provided by visa data produced by the Home Office. Recent trends in visas granted have provided a good leading indicator for trends in long-term non-EU immigration. The total number of non-visitor visas granted in YE June 2016 (553,737) increased slightly from YE June 2015 (up 15,373 or 3%). There were increases for Chinese nationals (up 5,252 or +6%) and falls for Libyan nationals (down 2,644 or -76%), with the highest numbers of visas being granted to Chinese and Indian nationals.
Note that there are a range of potential reasons why the long-term immigration estimates from the IPS may differ from figures for visas granted, including:
- visas will include shorter visas (for less than 12 months)
- differences in coverage, for example differences between stated intentions and length of stay
- sampling variation in the IPS
- timing differences between when visas are granted and when an individual travels
- visa and admissions data can include dependants recorded in different subcategories from the IPS
For more information you are invited to read the Home Office Immigration Statistics April to June 2016 bulletin.
British citizens
LTIM estimates show that in YE March 2016, the estimated number of British citizens immigrating to the UK was 82,000, similar to 85,000 for YE March 2015. These numbers include British citizens returning to the UK after living abroad for a year or more, or citizens who were born abroad and may be coming to the UK for the first time. IPS estimates show that half of all British citizens immigrated for work-related reasons, 44% of whom had a definite job to go to.
Immigration by main reason
Figure 5: Long-Term International Migration estimates of immigration to the UK, by main reason for migration, 2006 to 2016 (year ending March 2016)
Source: Office for National Statistics, Long-Term International Migration
Notes:
- Figures for 2015 and 2016 are provisional. In this chart provisional estimates are indicated with a 'p' when hovering the mouse over the series.
- Up to year ending Dec 2009, estimates are only available annually.
- Acc./join means accompanying or joining.
Download this chart Figure 5: Long-Term International Migration estimates of immigration to the UK, by main reason for migration, 2006 to 2016 (year ending March 2016)
Image .csv .xlsIPS data show that, of those whose main reason for long-term migration was work-related, the majority (62%) were EU citizens, whereas of those whose main reason for migration was study, the majority (72%) were non-EU citizens. The difference in reason for immigration likely reflects the differing rights of EU and non-EU citizens to migrate to the UK as well as the impact of government policies and other factors (such as economic conditions in origin countries).
Immigration for work
The most commonly stated reason for immigration to the UK is work (Figure 5). In YE March 2016, 303,000 people immigrated for work, the second highest estimate on record (YE December 2015 being the highest at 308,000). Of these, 176,000 (58%) had a definite job to go to and 127,000 arrived looking for work (comparing with 108,000 the previous year).
Figure 6: International Passenger Survey estimates of immigration to the UK for work-related reasons by citizenship, year ending March 2013 to year ending March 2016

Source: Office for National Statistics, International Passenger Survey
Notes:
- Figures for 2016 are provisional. In this chart provisional estimates are represented by a cross.
- These are rolling year estimates, and peaks are shown with the appropriate “year ending” data.
- Note that the EU total given in published tables and the text of this report includes Malta, Cyprus and Croatia, so will be slightly different from the total of the 3 EU charts shown in Figure 6.
Download this image Figure 6: International Passenger Survey estimates of immigration to the UK for work-related reasons by citizenship, year ending March 2013 to year ending March 2016
.png (38.4 kB) .xls (30.2 kB)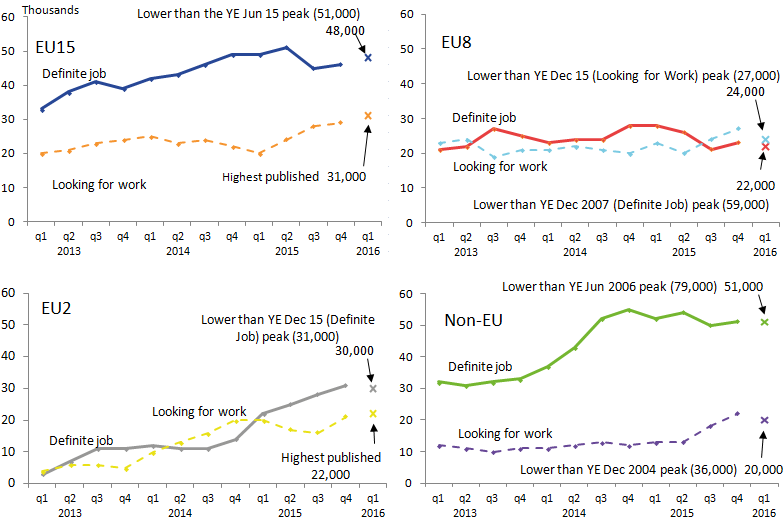
IPS estimates show around 62% of immigrants arriving for work were EU citizens, 24% were non-EU citizens and 14% were British citizens. In YE March 2016, 179,000 EU citizens arrived for work, compared with 162,000 in YE March 2015. Approximately 56% (101,000) of all EU immigrants arriving for work-related reasons reported they had a definite job to go to. The equivalent percentages for each EU citizenship group were:
- EU15: 61%
- EU8: 48%
- EU2: 58%
These proportions compare with the previous year’s figures of 71%, 55% and 52% respectively. Of the 77,000 EU citizens specifically looking for work, 40% (31,000) were EU15 citizens, a statistically significant increase from 20,000 the previous year, possibly in part reflecting weaker labour market conditions in some southern EU15 states.
Of the non-EU immigrants who arrived for work-related reasons, 51,000 (72%) had a job to go to.
Work-related visas (non European Economic Area nationals)
In YE June 2016, the number of sponsored skilled work (Tier 2) visas rose by 1% to just under 94,000, including dependants. There were 166,544 work-related visas (including dependants) granted in all work categories in YE June 2016, down 1% (-1,961), but the total number of work visas granted to non-EU national main applicants increased by 1% to 123,172.
Table 2: Work-related visa grants by category, UK, year ending June 2015 and year ending June 2016
| Type of visa granted | YE Jun 2015 | YE Jun 2016 | Difference | % change to previous year |
| Total work-related visas | 168,505 | 166,544 | -1,961 | -1% |
| Tier 1 visas | 7,917 | 4,535 | -3,382 | -43% |
| Tier 2 (skilled) visas | 92,567 | 93,935 | 1,368 | 1% |
| Tier 5 (youth mobility and temporary) visas | 44,629 | 43,356 | -1,273 | -3% |
| Non-PBS/Other work visas | 23,392 | 24,718 | 1,326 | 6% |
| Source: Home Office | ||||
| Notes: | ||||
| 1. Figures include dependants. | ||||
Download this table Table 2: Work-related visa grants by category, UK, year ending June 2015 and year ending June 2016
.xls (27.1 kB)The fall in total work visa numbers may be accounted for by the continued reductions in the Tier 1 General visa route following the closure of that scheme.
Indian nationals accounted for 57% of total skilled work visas granted (53,548 of 93,935), with USA nationals the next largest nationality group (10,019 or 11% of the total).
Trends in visa numbers reflect both changes to the immigration rules and the prevalent economic environment. There were falls in numbers of work-related visas granted following the introduction of the points-based system and the onset of the economic downturn, in 2008. More recently, the closure of the Tier 1 General and Tier 1 Post-study categories to new applicants has led to further reductions in work visas for dependants (see Home Office Immigration Statistics release - Work topic).
IPS long-term immigration estimates for work and formal study among non-EU nationals broadly follow the same long-term trends as visas granted for work and study. However, IPS estimates will be lower than the visa figures because the IPS estimates exclude those individuals who intend to stay for less than 1 year and there will be other differences in categorisation. Furthermore, the dependants of those granted a visa to work or study are included in the work and study visa figures, whereas the reason for migration for such individuals, in most cases, is likely to be recorded as accompanying or joining others by the IPS. For more information see the Home Office Immigration Statistics April to June 2016 bulletin.
National Insurance number (NINo) allocations to adult overseas nationals
NINo and IPS estimates should not be directly compared. NINo figures include short-term migrants and the figures are based on the recorded registration date on the National Insurance recording and Pay As You Earn system (NPS) (after the NINo application process has been completed) and so are not a direct measure of when a person migrated to the UK. As such, there will be differences between the NINo registration data shown in Table 3 and the estimates of long-term international migration. More detailed information on these differences is discussed in the publication from 12 May 2016.
The number of NINo registrations in the year ending June 2016 was 631,000 for EU citizens and 193,000 for non-EU citizens. Both show a fall from the previous year (to June 2015), however, latest quarterly figures show NINo registrations remaining level.
Table 3: National Insurance number registrations to adult overseas nationals entering the UK, year ending June 2016
| thousands | ||||
| World area | YE June 2015 total | YE June 2016 total | Difference | % change to previous year |
| Total | 917 | 825 | -93 | -10% |
| European Union | 697 | 631 | -66 | -10% |
| (of which) EU15 | 263 | 229 | -35 | -13% |
| (of which) EU8 | 216 | 174 | -42 | -20% |
| (of which) EU2 | 214 | 224 | 11 | 5% |
| Non-European Union | 218 | 193 | -25 | -12% |
| Source: Department for Work and Pensions. | ||||
| Notes: | ||||
| 1. Figures for the year to June 2015 are higher than would normally be the case because a proportion of NINos which would normally have been registered in the period April to June 2014 were only registered in July to September 2014 thus increasing the year to June 2015 baseline figures. | ||||
| 2. The figures are based on recorded registration date on the National Insurance Recording and Pay As You Earn System, ie after the NINo application process has been completed, and are not a direct measure of when a person migrated to the UK. | ||||
| 3. The number of new registrations of NINos to non-UK nationals over a given period is not the same as the total number of non-UK nationals who hold a NINo. | ||||
| 4. The total number of non-UK nationals who have been allocated a NINo is not the same as the number of non-UK nationals working in the UK. This is because people who have been allocated NINos may subsequently have left the UK, or they may still be in the UK but have ceased to be in employment. | ||||
| 5. Some people arriving into the UK may already hold a NINo from a previous stay in the UK. Once a person has been allocated a NINo, they do not need to reapply in order to work in the UK. | ||||
| 6. There are a small number of cases where the nationality of an individual is not recorded on the source system - therefore the sum of world areas may differ from the total. | ||||
| 7. Differences may vary from calculations derived from the totals due to rounding. | ||||
Download this table Table 3: National Insurance number registrations to adult overseas nationals entering the UK, year ending June 2016
.xls (30.2 kB)
Figure 7: National Insurance number allocations to adult overseas nationals entering the UK from the EU and non-EU, year ending September 2006 to year ending June 2016
Source: Department for Work and Pensions, National Insurance number registrations to adult overseas nationals
Notes:
- The figures are based on recorded registration date on the National Insurance Recording and Pay As You Earn System (NPS), that is, after the NINo application process has been completed, and are not a direct measure of when a person migrated to the UK.
- Although figures do accurately reflect the number of NINos registered over time, a change to the process of recording NINos during the quarter April to June 2014, means that the volume of NINo registrations recorded were lower in that quarter and then higher in the subsequent quarter July to September 2014 than would otherwise be the case. Comparisons of NINo registrations over time between these periods should be viewed with caution.
Download this chart Figure 7: National Insurance number allocations to adult overseas nationals entering the UK from the EU and non-EU, year ending September 2006 to year ending June 2016
Image .csv .xlsThe sharp rise in registrations to EU2 nationals in 2014 to some extent mirrors the long-term migration trend over an extended period. However, in the last year, the growth in EU2 registrations has been offset by a fall in registrations from other EU member states.
Table 4 shows the top registrations for individual EU and non-EU nationalities.
Table 4: Top 5 EU and non-EU nationalities for NINo registrations, UK, year ending June 2016
| thousands | ||||||||||
| EU nationality | NINo registrations | Non-EU nationality | NINo registrations | |||||||
| Romanian | 185 | Indian | 34 | |||||||
| Polish | 105 | Australian | 14 | |||||||
| Italian | 59 | Chinese | 13 | |||||||
| Spanish | 48 | Pakistani | 12 | |||||||
| Bulgarian | 40 | Nigerian | 9 | |||||||
| Source: Department for Work and Pensions | ||||||||||
Download this table Table 4: Top 5 EU and non-EU nationalities for NINo registrations, UK, year ending June 2016
.xls (26.1 kB)Labour market statistics
There have been increases for all nationality groupings in the employed UK labour force in April to June 2016, compared with the same quarter for the previous year (Table 5).
Table 5: Change in labour market activity, April to June 2016, UK
| thousands | ||||
| Nationality grouping | Total in employment, Apr to Jun 2015 | Total in employment, Apr to Jun 2016 | Difference | % Change from previous year |
| Total | 31,047 | 31,661 | 614 | 2.0% |
| British | 27,838 | 28,211 | 373 | 1.3% |
| Non-UK | 3,206 | 3,447 | 242 | 7.5% |
| Non-EU | 1,209 | 1,213 | 3 | 0.3% |
| EU | 1,996 | 2,235 | 238 | 11.9% |
| EU15 | 847 | 944 | 97 | 11.4% |
| EU8 | 963 | 1,007 | 44 | 4.6% |
| EU2 | 179 | 266 | 87 | 48.8% |
| Source: Office for National Statistics | ||||
| Notes: | ||||
| 1. Figures may not sum due to rounding | ||||
Download this table Table 5: Change in labour market activity, April to June 2016, UK
.xls (26.6 kB)Labour market statistics are a measure of the stock of people working in the UK and are not designed to provide a measure of migration flows. As a result, changes in the labour market stock cannot be directly compared with changes in long-term net migration.
The growth in overall employment over the last year was 614,000. Of this, 61% can be accounted for by growth in employment for British nationals and 39% by growth in employment among non-UK nationals, where nationality is known.
Note that these estimates relate to the number of people in employment rather than the number of jobs and therefore show NET changes in the number of people in employment. They do not indicate the proportion of new jobs that have been filled by UK and non-UK workers.
Immigration for study
Long-term immigration to the UK for all immigrants for study was estimated to be 164,000 in YE March 2016, a statistically significant reduction from 192,000 in March 2015. This is the lowest estimate since YE December 2007.
IPS estimates show 23% of those arriving to study were EU citizens and 72% were non-EU citizens (the remaining 5% being British citizens). There was a statistically significant decline in the number of non-EU citizens migrating to the UK to study, from 134,000 in the previous year to 111,000. Of the 111,000, 72% were citizens of Asian countries, though there was a statistically significant decline in citizens of South Asia, with the number coming to study having almost halved.
IPS figures cover those who state study as their main reason for long-term immigration when sampled. Home Office visa data provide additional detail for non-EU migrant students1. Over the same period (year ending March 2016), there were 206,125 visas granted to non-EU nationals for the purposes of study, for all lengths of study but excluding the short-term student category (formerly known as “student visitors”). This was a fall of 5% compared with YE March 2015.
In YE June 2016, sponsored visa applications (as opposed to grants) from non-EU nationals (main applicants only) to study fell by 3% to 197,9792. There were falls in visa applications to study for main applicants for:
- universities (to 163,338, -2%)
- English language schools (to 2,445, -25%)
- further education sector and other educational institutions (to 15,848, -8%)
There were 82,318 visas granted to short-term students (formerly known as “student visitors”), a rise of 28%.
Table 6 shows that more than one-third of non-EU study visas were granted to Chinese students and together the 4 largest nationalities made up half of the non-EU foreign students granted visas in YE June 2016.
Table 6: Top 5 nationalities for study, UK, year ending June 2016 (main applicants)
| Nationality | Study visa granted | % of total |
| Total | 204,859 | 100% |
| China | 70,194 | 34% |
| United States | 14,245 | 7% |
| India | 10,664 | 5% |
| Malaysia | 9,478 | 5% |
| Hong Kong | 9,069 | 4% |
| Other non-EEA nationalities | 91,209 | 45% |
| Source: Home Office. | ||
Download this table Table 6: Top 5 nationalities for study, UK, year ending June 2016 (main applicants)
.xls (25.6 kB)For more information on immigration to the UK for study, see the Home Office topic report on study and the Home Office research report on short term study (formerly known as “student visitors”).
Immigration to accompany or join others
The third most common reason for migrating to the UK is to accompany or join others. This category can include people who are arriving to marry a UK resident as well as people coming as a family member of another migrant coming for other reasons, such as to work3. In YE March 2016, 13% (80,000) of long-term migrants arrived in the UK to accompany or join others (Figure 5), similar to the 84,000 the year before.
Home Office entry clearance visa statistics for non-European Economic Area (EEA) nationals show that 38,805 family route visas were granted in YE June 2016, an increase of 10% compared with YE June 2015 (35,159), but almost half the peak level in YE March 2007 (72,894).
Further information on visas granted for family reasons has been published by the Home Office.
Asylum applications
There were 44,323 asylum applications (including dependants) in the YE June 2016, an increase of 34% compared with the previous year (33,111). This is the sixth successive year in which asylum applications have risen, although the number of applications is still less than half the level of the peak in 2002 (103,081) and relatively low compared with some other European countries (the UK received the eighth highest number of asylum seekers of the 28 EU member states in the YE June 2016).
A total of 11,659 people were granted asylum or an alternative form of protection in the YE June 2016, an overall grant rate of 35% at initial decision.
Table 7 shows the 5 nationalities with the highest number of applications for asylum to the UK in the YE June 2016.
Table 7: Nationalities with highest number of asylum applications, UK, year ending June 2016
| Nationality | Asylum applications | Change since last year | Proportion granted at initial decision | ||||||||||||
| Iran | 5,466 | +2920 | 43% | ||||||||||||
| Pakistan | 3,980 | +648 | 16% | ||||||||||||
| Iraq | 3,948 | +2756 | 13% | ||||||||||||
| Afghanistan | 3,460 | +1520 | 35% | ||||||||||||
| Eritrea | 2,818 | -805 | 48% | ||||||||||||
| Source: Home Office. | |||||||||||||||
| Notes: | |||||||||||||||
| 1. Figures include dependants | |||||||||||||||
Download this table Table 7: Nationalities with highest number of asylum applications, UK, year ending June 2016
.xls (26.6 kB)There were 2,806 asylum applications from Syrian nationals (including dependants) in the YE June 2016, the sixth highest nationality and an increase of 15% compared with the previous year (2,436). There were 2,156 grants of asylum or an alternative form of protection (including dependants) to those giving Syrian as their nationality in the YE June 2016, which is a grant rate of 87% of the total initial decisions made for Syrian nationals in that period. In addition, 2,682 people were granted humanitarian protection under the Syrian Vulnerable Persons Resettlement Scheme in the YE June 2016 (2,898 since the scheme began in January 2014).
Further detail is provided in the Home Office topic report on asylum.
Settlement in the UK
The number of non-EEA nationals granted permission to stay permanently in the UK fell by 36% to 67,414 in YE June 2016. The number of grants is low relative to the peak in YE September 2010 (241,586). The decrease in the latest 12 months was driven by falls in family (-9,286) and work-related grants (-9,352). This may partly reflect changes to the family rules in July 2012 on how quickly partners qualify for settlement and other factors affecting the number of visas and extensions granted in previous years.
For more information on settlement in the UK, see the Home Office topic report on settlement.
In February 2016, the Home Office published its “Migrant journey: sixth report”, which shows how non-EEA migrants change their immigration status and the immigration routes used prior to achieving settlement in the UK.
In May 2016, the Home Office published an update to the article “Extensions of stay by previous category”. Looking at extensions data by individuals’ previous category, 7,226 former students were granted extensions for work in 2015 (main applicants).
Notes for Immigration to the UK was among the highest recorded levels
There are a range of reasons why LTIM and IPS figures for long-term migrants for study may be different from Home Office figures for study visas granted. For example, the Home Office visa statistics include short-term students migrating to the UK for less than 1 year, but only record students who are non-EU nationals.
Note that this figure relates to Certificates of Acceptance to Study (CAS) data used in the application process for a visa, which will differ from the number of study visas granted (given earlier), although the number is likely to be similar as sponsors are expected to only issue CAS to legitimate students. The applications data from CAS refer to YE June 2016, whereas grants data from visas are YE March 2016 to compare with the LTIM figures for the same period.
Much more detail can be found in the Home Office Immigration Statistics User Guide.
6. Emigration from the UK was 306,000, with most leaving for work
The latest emigration estimate for the year ending (YE) March 2016 was 306,000 with a confidence interval of +/-21,000, similar to the 308,000 (+/-21,000) in YE March 2015 (not statistically significant).
(From here on, any reference to change, such as increase or decrease, refers to YE March 2016 compared with YE March 2015. All estimates quoted within this section are Long-Term International Migration (LTIM)-based estimates, and comparisons are not statistically significant, unless otherwise stated.)
Recent levels of emigration have remained fairly stable though they continue to follow a general decline from the high of 427,000 in 2008.
In YE March 2016, work-related reasons remain by far the main reason1 given for emigration, accounting for 169,000 (55%) of emigrants, similar to 167,000 the previous year.
Figure 8: Emigration from the UK by citizenship, 2006 to 2016 (year ending March 2016)
Source: Office for National Statistics, Long-Term International Migration
Notes:
- Figures for 2015 and 2016 are provisional. In this chart provisional estimates are shown separated by a break in the series.
- This chart is not consistent with the total revised net migration estimates as shown in Figure 1. Please see guidance note for further information.
Download this chart Figure 8: Emigration from the UK by citizenship, 2006 to 2016 (year ending March 2016)
Image .csv .xlsBritish citizens
In YE March 2016, 126,000 British citizens emigrated from the UK (41% of all emigrants), compared with 133,000 the previous year. This decrease in British emigration continues the gradually reducing trend seen over the past 10 years.
IPS-only data show that of 116,000 British emigrants, reasons given for emigration were:
- work-related reasons (58,000, of whom 76% had a definite job to go to)
- accompanying or joining others (14,000)
- formal study (8,000)
- “other” or “not stated” (36,000)
EU citizens
The estimated number of EU citizens emigrating from the UK was 89,000 in YE March 2016, similar to the estimated number of EU citizens who emigrated in YE March 2015 (86,000).
IPS data show that of the EU emigrants, 53% left for work-related reasons.
Of the 35,000 emigrants who, in the IPS, stated their main reason for migration as “going home to live”, just over two-thirds (24,000) were EU citizens.
Non-EU citizens
The latest estimates show 92,000 non-EU citizens emigrated from the UK (similar to the 90,000 in the previous year). Of the non-EU emigrants, 60% were of Asian citizenship.' to be 'Of the non-EU emigrants, 60% had citizenship of countries in Asia.
Of all non-EU emigrants, 69% were emigrating for work-related reasons.
Emigration from the UK by previous main reason for immigration
The IPS asks emigrants about their main reason for originally coming to the UK. Of the 287,000 individuals shown in IPS data to be emigrating from the UK, 86,000 were “new” long-term emigrants (individuals who had not previously lived away from the UK for 12 months or more) and 201,000 were long-term emigrants who had formerly immigrated to the UK.
More detailed estimates derived from this IPS question can be found in Tables 4a and Table 4b in the accompanying datasets for this MSQR release.
A recent Office for National Statistics (ONS) report, “International Student Migration – what do the statistics tell us” explores the reasons for the apparent gap between student immigrants and emigrants who previously arrived to study.
Notes for Emigration from the UK was 306,000, with most leaving for work
- Note that for former immigrants, the reason a person emigrates may not reflect their original reason for immigration. For more, see the “Emigration from the UK by previous main reason for immigration” section.
7. Where can I find more information?
There is a lot more detail within the charts and tables found in the accompanying download of provisional datasets alongside this report, including a breakdown of the statistics by main reason or by citizenship grouping.
Today the Office for National Statistics (ONS) also publishes The Local Area Migration Indicators (LAMI) suite presenting indicators of migration at local authority level. This annual output has been updated with the latest available estimates. The MSQR does not provide commentary on the LAMI. An interactive quiz providing an introduction to the LAMI and data on population by country of birth will supplement the LAMI suite. The quiz will be available on the Visual.ONS website.
Accompanying this MSQR is the report and tables on the Population of the UK by Country of Birth and Nationality, based on the Annual Population Survey, providing information on non-UK born and non-British nationals by local authority and single country.
Short-Term International Migration estimates for England and Wales, mid-2014 were published in May 2016 and cover migrants coming to or leaving the UK for 1 to 12 months.
If you are new to migration statistics, you might find it helpful to read our “Migration statistics first time user guide” or for more detailed information on how our migration statistics are used, along with information on their strengths and limitations, please see the articles “Quality and Methodology Information for Long-Term International Migration (LTIM) releases” and “Long-Term International Migration Estimates Methodology”, as well as the “Note on Sampling and Uncertainty” section later in this bulletin.
There are also links to several other relevant publications and articles, as well as a glossary of the terms used in this report, in the List of Products and Glossary article.
If you would like to subscribe to our newsletter, please send an email to population.statistics@ons.gov.uk with the subject title “Subscribe to ONS Population Statistics Newsletter”, or you can also follow our statistician @PaulVickers_ONS on Twitter for the latest population statistics news and updates and join in the conversation.
Back to table of contents8. Changes in this release
Some of the content from previous versions of this bulletin has been reduced or removed to make the report more accessible and less cumbersome, in line with ONS's move towards more modern, brief outputs supported by tables that users can access,, as well as making sure that the content that does remain is easier to absorb and clearer.
We have also moved the glossary and list of products to a separate document, linked above. This helps reduce the size of this report, while providing a more-easily updatable repository of information that can span all of our international migration outputs.
The main messages and important information on which we report are still contained in this document, just made concise and clearer, and all data relevant to the MSQR can be found published in accompanying download tables on our website, or the websites of other government departments.
Back to table of contents9. Understanding the main terms used in this report
Here is a quick overview of 6 of the main terms used throughout the report. More can be found in the List of Products and Glossary article.
Immigration
This refers to those people coming into the UK. Our estimates sometimes refer to EU or non-EU immigrants, but the estimates of total immigration include EU, non-EU AND British immigrants.
Emigration
This refers to those people leaving the UK and, as with immigration, totals include EU, non-EU AND British emigrants.
Net migration
Net migration is the difference between immigration and emigration. If immigration is higher than emigration, meaning more people come to the UK than leave the UK, then net migration will be a positive (+) number. If more people leave the UK than come to the UK then net migration will be a negative (-) number.
EU2
The EU2 are the 2 countries that joined the EU on 1 January 2007: Bulgaria and Romania. Between 2007 and 2013, in the first 12 months of stay, working Bulgarian and Romanian nationals were subject to restrictions on the types of work they could undertake in the UK. These restrictions were lifted on 1 January 2014.
EU8
The EU8 are the 8 central and eastern European countries that joined the EU on 1 May 2004: Czech Republic, Estonia, Hungary, Latvia, Lithuania, Poland, Slovakia and Slovenia. The EU8 does not include the 2 other countries that joined on that date: Cyprus and Malta.
EU15
The EU15 consists of Austria, Belgium, Denmark, Finland, France, Germany, Greece, Italy, Luxembourg, Netherlands, Portugal, Republic of Ireland, Spain, Sweden and the United Kingdom. However, our EU15 statistics exclude British citizens (and as a result in some other publications the EU15 are referred to as the EU14).
Back to table of contents10. A note on sampling and uncertainty
Surveys gather information from a sample of people from a population. Using the International Passenger Survey (IPS) as an example, the population is passengers travelling through the main entry and exit points from the UK including airports, seaports and the Channel Tunnel. The estimates produced are based on only one of a number of possible samples that could have been drawn at a given point in time. Each of these possible samples would produce an estimated number of migrants. These may be different from the true value that would have been obtained if it were possible to ask everyone passing through about their migration intentions. This is known as sampling variability.
The published estimate is based upon the single sample that was taken and is the best estimate of the true value based on the data collected. However, to account for sampling variability, the estimates we publish include a “95% confidence interval”.
The confidence interval is a measure of the uncertainty around the estimate. Confidence intervals become larger (meaning there is more uncertainty) for more detailed estimates (such as citizenship by reason for migration). This is because the number of people in the sample who have these specific characteristics (for example, EU8 citizens arriving to study) is smaller than the number of people sampled in higher level categories (such as the total number of EU citizens arriving to study). Where possible, it is better to use the highest level breakdown of data available.
We use the widely accepted 95% confidence interval, meaning that over many sampling repetitions under the same conditions, we would expect the confidence interval to contain the true value 95 times out of 100. Equivalently, we can say that there would be a 1 in 20 chance that the true value would lie outside of the range of the 95% confidence interval.
Estimates from a survey could change from one period to the next simply due to sampling variability. In other words, the change may be due to which individuals were selected to answer the survey and may not represent any real-world change in migration patterns.
Statistical tests can be used to determine whether any increases or decreases that we see in the estimates could be due to chance, or whether they are likely to represent a real change in migration patterns. If the tests show that the changes are unlikely to have occurred through chance alone, and are likely to reflect a real change, then the change is described as being “statistically significant”. The usual standard is to carry out these tests at the 5% level of statistical significance. This means that in 1 out of 20 differences identified as statistically significant, it is not possible to assert that the difference is the result of a real change.
For information on the accuracy of these statistics, comparing different data sources and the difference between provisional and final figures, please see the “MSQR Information for Users”.
Revisions to net migration estimates in light of the 2011 Census
In April 2014, we published a report examining the quality of international migration statistics between 2001 and 2011, using the results of the 2011 Census. A main finding of the report was that, over the 10 year period, annual net migration estimates were a total of 346,000 lower than total net migration implied by the 2011 Census. However, the report also showed that the quality of international migration estimates improved following changes made to the IPS in 2009.
Within the report, we published a revised series of net migration estimates for the UK. Published tables have been updated on our website to include the revised estimates. The report, a summary and guidance on how to use these revised figures are available on our website. Users should be aware that no revisions were made to separate immigration and emigration estimates at the time the net migration estimates were revised – ONS analysis of the differences between the Census and population estimates suggest immigration figures could have been higher in the mid-2000s as a result of migration from Eastern Europe.
Back to table of contents11. Future releases
1 December 2016 - for the year ending June 2016
23 February 2017 - for the year ending September 2016 (the first MSQR to include statistics for the quarter following the EU referendum)
25 May 2017 - for the year ending December 2016
24 August 2017 - for the year ending March 2017
12. Quality and methodology
The Long-Term International Migration Quality and Methodology Information document contains important information on:
- the strengths and limitations of the data and how it compares with related data
- users and uses of the data
- how the output was created
- the quality of the output including the accuracy of the data
Long term international migration QMI
International migration methodology
Back to table of contents