1. Methodology background
| National Statistic | |
| Frequency | Annual |
| How compiled | Administrative data, survey data |
| Geographic coverage | UK (England, Wales, Scotland, Northern Ireland) |
| Last revised | 12 December 2018 |
2. About this Quality and Methodology Information report
This quality and methodology report contains information on the quality characteristics of the data (including the European Statistical System five dimensions of quality) as well as the methods used to create it.
The information in this report will help you to:
- understand the strengths and limitations of the data
- learn about existing uses and users of the data
- understand the methods used to create the data
- help you to decide suitable uses for the data
- reduce the risk of misusing data
3. Important points
Life expectancy and health state life expectancies are important high-level measures of a population’s health status.
Period life expectancy (LE) at a given age for an area is the average number of years a person would live, if he or she experienced the particular area’s age-specific mortality rates for that time period throughout his or her life.
Health state life expectancies add a quality of life dimension to estimates of life expectancy (LE) by dividing expected lifespan into time spent in different states of health or disability.
Healthy life expectancy (HLE) estimates lifetime spent in “very good” or “good” health and is based on how individuals perceive their general health.
Disability-free life expectancy (DFLE) estimates lifetime free from a limiting persistent illness or disability; this is based upon a self-rated assessment of how health conditions and illnesses reduce an individual’s ability to carry out day-to-day activities.
National deciles of area deprivation are created through ranking small geographical populations known as Lower layer Super Output Areas (LSOAs) by ranking them according to their deprivation score and grouping them into 10 divisions.
Each decile represents approximately 10% of the national population, with decile one containing the 10% most deprived LSOAs and decile 10 the 10% least deprived.
4. Overview
Health state life expectancies are summary measures of population health and important indicators of the well-being of society, providing context to the effects of policy changes and interventions at both national and local levels.
Health state life expectancies (HSLEs) are extensions of life expectancies (LE) that combine mortality data with both general and functional health status data to produce estimates of the span of life that a person can expect to live in “very good” or “good” health – healthy life expectancy (HLE), or without activity restriction or disability associated with a longstanding physical or mental illness or condition, disability-free life expectancy (DFLE).
This partitioning of length of life into periods spent in various health states provides a quality dimension to LE. These metrics provide an informative summary measure of the health status of the population, which provides a context to changing patterns in lifespan.
The publication provides figures for males and females at national, regional and local level. The figures presented are three-year rolling averages to ensure they are sufficiently robust at all geographic levels.
Recent improvements
There have been two recent changes to note, which are designed to improve the quality of these statistics.
Previously we published life expectancy, national health and disability-free life expectancy, healthy life expectancy for local areas in England and disability-free life expectancy for local areas in separate bulletins. These have now been streamlined into one bulletin called Health state life expectancies.
Following last year’s consultation paper and feedback from stakeholders, we have implemented a new method for calculating health state life expectancies (HSLEs). We previously calculated these estimates, using health state prevalence data available from the Annual Population Survey (APS). However, the new method is based on modelling health and disability-free state prevalence by combining data from the APS and the Census 2011.
Uses and users
Life expectancy provides users with an indicator of longevity, which can be used to inform policy needs and planning for services, and provide context for further research in both the public and private sectors in areas such as health, population, pensions and insurance. The main users of life expectancy data include the Department of Health and Social Care (DHSC), Public Health England, Public Health Wales, NHS England, National Records Scotland, Northern Ireland Statistics and Research Agency, Ministry of Housing, Communities and Local Government, Department for Work and Pensions, local public health departments, local authorities, combined authorities and private pensions and insurance companies.
Life expectancy figures are used at regional and local levels to focus on health monitoring and planning in specific areas. They are also published as part of the Regional Health Profiles, which are produced by Public Health England (PHE). The profiles comprise an important package of indicators, which are designed to support action by local governments and primary care trusts to tackle health inequalities through greater targeting of interventions and health improvement. Life expectancy figures are also presented for local authority areas in PHEs Public Health Outcomes Framework.
In the private sector, life expectancy figures are used by pensions and insurance companies for planning their financial services.
Our health state life expectancies (HSLEs) statistics are reported in a number of our other publications such as National well-being – health. The main external users of our HSLE statistics include:
Department of Health and Social Care – increases in HLE and reductions in the differences in HLE between communities are high-level outcomes of the Public Health Outcomes Framework
Department for Work and Pensions – Health expectancies inform policy around ageing in the UK, fitness for work and extending working lives, and making judgements about fairness when setting the State Pension age
Department for Environment, Food and Rural Affairs – HLE and DFLE are headline indicators of sustainable development
the Healthy Life Years (HLY) indicator is in the core set of the European Structural Indicators and its importance was recognised in the Lisbon Strategy
academia, actuaries and the media
5. Quality characteristics of the health state life expectancies data
This report provides a range of information that describes the quality of the data and details any points that should be noted when using the output.
We have developed Guidelines for Measuring Statistical Quality; these are based upon the five European Statistical System (ESS) Quality Dimensions. This report addresses these quality dimensions and other important quality characteristics, which are:
- relevance
- timeliness and punctuality
- coherence and comparability
- accuracy
- output quality trade-offs
- assessment of user needs and perceptions
- accessibility and clarity
More information is provided about these quality dimensions in the following sections.
Relevance
(The degree to which statistical outputs meet users’ needs.)
Our health state life expectancies output has two components, each of which has a different population coverage. The two components are:
- estimates of period life expectancy
- estimates of health state life expectancy
Estimates of period life expectancy (LE) cover the UK and constituent countries. In addition, for England they cover regions, counties, metropolitan counties, combined authorities and local authority districts and for national deprivation deciles in England and Wales as measured by the Index of Multiple Deprivation and the Welsh Index of Multiple Deprivation.
Estimates of health state life expectancy cover the UK and constituent countries, and:
- for England, they cover regions, metropolitan counties, combined authorities and upper-tier local authorities; and clusters of Lower-layer Super Output Areas (LSOAs) grouped according to their area deprivation decile as measured by the Index of Multiple Deprivation (IMD)
- for Wales, they cover unitary authorities and Welsh health boards, and clusters of LSOAs grouped according to their area deprivation decile as measured by the Welsh Index of Multiple Deprivation (IMD)
- for Scotland, they cover council areas
for Northern Ireland, they cover local government districts
Figures are not calculated for City of London or Isles of Scilly because the numbers of deaths are too small to produce statistically robust estimates.
The harmonised standards included on the APS for defining disability and producing statistical measures of disability improves relevance. Health state life expectancy measures are estimates of years lived in favourable states of health, such as years spent in good general health and years lived free from disabling health conditions. They provide an overview of the health of a population and enable sub-groups of the population to be compared spatially and socioeconomically. The coverage of current estimates includes all local areas of the UK and sub-groups of the population of England and Wales exposed to greater and lesser amounts of deprivation.
Health state life expectancies are important for public health monitoring and decision-making as:
they are included in Public Health England’s (PHE) overarching indicators in the public health outcomes framework, where they are used to monitor health improvement locally and health inequality nationally
healthy life expectancy and disability-free life expectancy provided evidence to the state pension age review as important indicators of fitness to work to higher State Pension ages and its fairness in different locations and among those exposed to different levels of deprivation
Department of Health and Social Care (DHSC) use these statistics as high-level outcome indicators to evaluate policies designed to improve the health of the poorest, fastest and narrow health inequalities.
Healthy life expectancy measurement has been recently extended as a high-level measure of health status in the combined authorities of Greater Manchester and the West Midlands. The Greater Manchester Population Health Plan has HLE as a measure of health need and a guide to target health improvement actions. West Midlands Combined Authority has commissioned us to provide HLE by quintiles of deprivation for measurement of inequalities within the combined authority area, and is used as an indicator in their inclusive growth strategy.
Improving lives: the future of work, health and disability was published by the Work and Health Unit, part of the Department for Work and Pensions and the Department for Health and Social Care. It sets out their joint strategy, using disability-free life expectancy to illustrate the gaps in years lived with and without health conditions that cause activity restriction. The presence of such a wide inequality was cited as a primary obstacle to entering and maintaining a place in the labour market.
The Pensions Act 2014 introduced a requirement for the Secretary of State of the Department for Work and Pensions to periodically review the rules on State Pension age and report to Parliament. Health state life expectancy at sub-national level and by measures of socioeconomic status were used in the most recent review in 2017. With the State Pension age set to increase in future years, an assumption will be to extend working lives to higher State Pension ages. An important judgement to support such an assumption is fitness to work at older ages, and whether improvements in health state life expectancy are keeping track with life expectancy.
Accuracy
(The degree of closeness between an estimate and the true value.)
All figures of life expectancy are period-based measures. Period expectation of life at a given age for an area in a given time period is an estimate of the average number of years a person of that age would survive if he or she experienced the particular area’s age-specific mortality rates for that time period throughout the rest of his or her life. The figure reflects mortality among those living in the area in each time period, rather than mortality among those born in each area. It is not therefore the number of years a person in the area in each time period will be expected to actually live, both because the death rates of the area are likely to change in the future and because many of those in the area may live elsewhere for at least some part of their lives. The measure does though reflect the mortality rates prevailing at the time and therefore gives an authentic measure with which to compare different populations both spatially and temporally.
The subnational life expectancy calculations use abridged life tables (based on grouping ages) rather than complete ones (based on single year of age). Through procedures that have been extensively tested, these abridged tables are more suitable than complete life tables (based on single year of age) for calculating subnational life expectancy due to small numbers of deaths by single year of age, particularly among younger ages and in smaller local authorities. They are created using numbers of deaths registered in calendar years and mid-year population estimates. Life expectancy figures are calculated as three-year rolling averages to provide large enough numbers to ensure that the results are sufficiently precise.
A template, which shows how abridged life tables are calculated, is available.
Before the annual release, life expectancy figures for local and unitary authorities are calculated as part of the process for quality assuring mid-year population estimates for England and Wales. The analyses highlight potential outliers in the distribution of new life expectancy estimates and compare results with those calculated for the previous period.
For information about the underlying mortality and population data used for life expectancy calculations, please see the following links:
- Deaths registered in England and Wales
- Deaths registered in Scotland
- Deaths registered in Northern Ireland
- Mid-year population estimates
Health state life expectancies are secondary analyses of published survey, mortality and mid-year population estimates. As such, the data have already been subject to rigorous quality control procedures. Our health state life expectancies are calculated subject to a rigorous documented quality control procedure. Calculations are performed independently by two members of our Health Analysis team using STATA®, SAS®, Excel and R packages. Inconsistency and missing data checks are initially performed on the survey data. An example of an inconsistency would be where a person is reported not to have a long-standing illness but at the same time is recorded as having activity restriction resulting from a long-standing illness. Missing data and inconsistencies are deleted from the final survey dataset.
Life and health state life expectancy estimates are published with 95% confidence intervals (CIs) to allow the user to judge their precision and identify significant differences between data points (area, sex, age and time period). Health state life expectancy (HSLE) CI calculations are calculated from weighted prevalence and unweighted survey counts, outlined by the Sullivan method and include an adjustment to improve the accuracy of the standard error by accounting for the multi-stage sampling design effects of the survey sources. While more formalised and accurate methods of significance testing are available, the non-overlapping CI method is used because it is both simple to calculate and easily understood. However, a formal statistical test of the difference from England is also calculated and where such a test shows the difference is significant, this is identified in datasets.
Coherence and comparability
(Coherence is the degree to which data that are derived from different sources or methods, but refer to the same topic, are similar. Comparability is the degree to which data can be compared over time and domain, for example, geographic level.)
Life expectancy and health state life expectancies are indicators of mortality and population health, which take into account differences in the age structures of populations. Results for local areas and area deprivation strata can therefore be meaningfully compared, as can results for males and females.
Life expectancy estimates at subnational level used to be calculated using an abridged life table closed at age 85 years and over. Estimates for local areas in the UK using this life table method are available between 1991 to 1993 and 2010 to 2012, and for England and Wales only to 2012 to 2014. However, because of increases in the older population, an abridged life table closed at age 90 years and over was introduced for the release health state life expectancies for local areas in the UK: 2013 to 2015 and a back series was produced from 2001 to 2003. This means that life expectancy estimates are comparable for local areas back to 2001 to 2003 using a life table closed at age 90 years and over. The impact of closing the life table at age 90 years and over has been reported on by Office for National Statistics (ONS) in the publication Method changes to life and health state expectancies.
On 1 April 2009, there was a re-organisation of local government in England, which created nine new unitary authorities (based on the merging of 37 local authorities). Life expectancy figures based on both the old and new boundaries are available.
Individual deaths are assigned to geographical areas by linking the postcode of usual residence of the deceased to the latest version of the National Statistics Postcode Directory (NSPD). This means that figures for each three-year period may be based on slightly different boundaries, where, for example, postcodes are re-allocated from one area into another. The impact on life expectancy results is minimal and comparability over time is not therefore affected.
Deaths of non-residents are excluded from local area life expectancy estimates, since they cannot be assigned to a geographical area. However, when life expectancy estimates are calculated for England and Wales as a whole, non-residents are included as they do not need to be assigned to a specific geographical area.
The national interim life tables provide the definitive life expectancy figures for the UK and constituent countries. These are calculated using complete life tables (based on single year of age) and should be used when comparing results with other countries.
To provide comparisons for regional and local area figures, national life expectancy results are also produced within this output using the same method as the subnational results, with abridged life tables in which death and population data are aggregated into age groups. Therefore, the two sets of national figures may differ very slightly (usually by less than 0.1 years).
Figures for England will also differ slightly from the national interim life table results because of a difference in the handling of deaths of non-residents. For this output, the deaths of non-residents are included in the mortality figures for England and Wales but are excluded from the figures for England and Wales separately. However, for the national interim life tables, the deaths of non- residents in England and Wales are included in the mortality data for England, but not in Wales.
Scotland produces estimates of healthy life expectancy (HLE), Scottish healthy life expectancy (SHLE), that differ slightly from our estimates of HLE. This is because different survey sources are used; SHLE is based on the Scottish Health Survey.
There are a number of issues that arise when trying to compare health state life expectancies (HSLEs) derived from different sources or methods. In general, HSLEs are sensitive to:
- measurement instruments used to collect the prevalence of health status, as the concept or definition of health may vary by survey or country
- the survey mode, for example, face-to-face interview, telephone interviews or postal or online surveys
- exclusion or inclusion of institutionalised persons
Differences between HSLEs for different countries can often be explained by differences in these issues. It is therefore important that they are considered before attempting comparisons between countries.
HSLEs are calculated in other European member states and the issues described in this section have also been highlighted in a comprehensive review (Bone and others, 1995).
Health state life expectancies have previously been available for the UK and constituent countries back to 2000 to 2002. These estimates combine data from the General Lifestyle Survey (GLF) (formerly known as the General Household Survey (GHS)) for Great Britain and from the Continuous Household Survey (CHS) for Northern Ireland and Health Survey Northern Ireland (HSNI) from 2010.
Data for Great Britain and England are available dating back to 1980 to 1982, although there are gaps for the years 1995 to 1997, 1997 to 1999 and 1999 to 2001 due to suspension of the GHS in 1997 and 1999.
In 2005, the GHS underwent two changes. The first was a change in survey design, from a purely cross-sectional survey to one with a longitudinal rotating panel design, becoming the GLF. There was a consequent loss of precision, and possibly accuracy in our estimates of healthy life expectancy (HLE) and disability-free life expectancy (DFLE), evidenced by a widening in the 95% confidence intervals (CI) surrounding each estimate. This change, along with an improvement in the method to account for sample selection, was reported in Health Statistics Quarterly (HSQ) and Update to the methodology used to calculate health expectancies for the UK and constituent countries (PDF, 610.7KB).
Also, the general health survey question used in the calculation of HLE was harmonised to the European Union Statistics on Income and Living Conditions (EU-SILC) Minimum European Health Module question containing five health state categories. This change in the data input and the derived definition of “good” general health led to a substantial fall in the absolute value of HLE, which was reported in HSQ (for more information, see An investigation into the impact of question change on estimates of General Health Status and Healthy Life Expectancy (PDF, 275.3KB).
A simulated time series of HLE was developed to provide users with a consistent synthetic series between 2000 to 2002 and 2004 to 2006, leading to the adoption of the harmonised measure of HLE in 2005 to 2007. Our HLE is now broadly comparable with that of other EU member states and has the added advantage of consistency with data available from the 2011 Census.
From 2016, a new UK HLE and DFLE time series was published, which has estimates from 2009 to 2011 based on the Annual Population Survey (APS). This is not comparable with previous estimates and encompasses local areas in the four constituent countries, together with combined authorities and Welsh Health Boards.
Accessibility and clarity
(Accessibility is the ease with which users are able to access the data, also reflecting the format in which the data are available and the availability of supporting information. Clarity refers to the quality and sufficiency of the release details, illustrations and accompanying advice.)
Our recommended format for accessible content is a combination of HTML web pages for narrative, charts and graphs, with data being provided in usable formats such as CSV and Excel. Our website also offers users the option to download the narrative in PDF format. In some instances, other software may be used, or may be available on request. Available formats for content published on our website but not produced by us, or referenced on our website but stored elsewhere, may vary. For further information please refer to the contact details at the beginning of this report.
For information regarding conditions of access to data, please refer to the following links:
In addition to this Quality and Methodology Information, basic quality information relevant to each release is available in the quality and methodology section of the relevant statistical bulletin.
Timeliness and punctuality
(Timeliness refers to the lapse of time between publication and the period to which the data refer. Punctuality refers to the gap between planned and actual publication dates.)
The annual release of Health state life expectancies by national deprivation deciles, England and Wales is announced on the GOV.UK release calendar 12 months in advance. Results are published in March each year, this is following the release of the LSOA population in October.
The annual release of health state life expectancy for local areas of the UK figures is also announced on the GOV.UK release calendar 12 months in advance. Results are published in December each year (12 months after the end of the reference period), following the release of annual death registrations data and mid-year population estimates for the previous year in England and Wales and Scotland (usually by the end of August); however, access to Northern Ireland data is not available until November. Results are produced on a three-year rolling average basis, to provide large enough numbers to ensure that the figures are sufficiently robust. Life expectancy figures have been released at roughly the same time every year since the release was expanded to encompass health state life expectancies and extension of coverage to the UK, and have always been punctual.
Previously, there has been a delay in producing the health state life expectancies. These will now be produced at the same time as the life expectancies and will be released in December. For more details on related releases, the GOV.UK release calendar provides 12 months advance notice of release dates. If there are any changes to the pre-announced release schedule, public attention will be drawn to the change and the reasons for the change will be explained fully at the same time, as set out in the Code of Practice for Statistics.
Concepts and definitions
(Concepts and definitions describe the legislation governing the output and a description of the classifications used in the output.)
Expectations of life can be calculated in two ways: period life expectancy (as used in this output) and cohort life expectancy. Cohort life expectancies are calculated using age-specific mortality rates, which allow for known or projected changes in mortality in later years and are therefore regarded as a more appropriate measure of how long a person of a given age would be expected to live, on average, than period life expectancy.
For example, period life expectancy at age 65 years in 2000 would be worked out using the mortality rate for age 65 years in 2000, for age 66 years in 2000, for age 67 years in 2000, and so on. Cohort life expectancy at age 65 years in 2000 would be worked out using the mortality rate for age 65 years in 2000, for age 66 years in 2001, for age 67 years in 2002, and so on.
Period life expectancies are a useful measure of mortality rates actually experienced over a given period and, for past years, provide an objective means of comparison of the trends in mortality over time, between areas of a country and with other countries. Official life tables in the UK and in other countries, which relate to past years, are generally period life tables for these reasons. Cohort life expectancies, even for past years, usually require projected mortality rates based on a set of assumptions for their calculation and so, in such cases, involve an element of subjectivity. More information on the differences between period and cohort life expectancies is available.
Health state life expectancies add a quality of life dimension to estimates of life expectancy (LE) by dividing expected lifespan into time spent in different states of health or disability. Healthy life expectancy (HLE), which estimates lifetime spent in “very good” or “good” health, is based on how individuals perceive their general health. The second is disability-free life expectancy (DFLE), which estimates lifetime free from a limiting persistent illness or disability. This is based upon a self-rated assessment of how health conditions and illnesses limit an individual’s ability to carry out day-to-day activities.
We use the following definitions of health to calculate both healthy life expectancy (HLE) and disability-free life expectancy (DFLE).
HLE is defined as the number of remaining years that an individual can expect to live in “very good” or “good” general health. Rates of “very good” and “good” general health by sex and five-year age band are captured from the following survey general health question on the APS:
How is your health in general; would you say it was…
- Very good?
- Good?
- Fair?
- Bad?
- Very bad?
DFLE is defined as the number of remaining years that an individual can expect to live without an activity restriction in carrying out normal day-to-day activities associated with a long-standing physical or mental health condition or illness. Rates of activity restriction by sex and five-year age band are captured from the following survey questions asked in the APS:
Do you have any physical or mental health conditions or illnesses that have lasted or are expected to last 12 months or more?
Response: Yes or No
If “Yes” the respondent is then asked:
Does your condition or illness/any of your conditions or illnesses reduce your ability to carry out normal day to day activities?
- Yes, a lot
- Yes, a little
- Not at all
The questions to elicit activity restriction prior to the introduction of the primary harmonised standards in April 2013 are presented in Table 1, together with the current questions.
| Labour Force Survey questions (before April 2013) | Harmonised questions (from April 2013) |
|---|---|
| LNGLIM Do you have any health problems or disabilities that you expect will last for more than a year? 1. Yes 2. No | LNGLST (replacing LNGLIM) Do you have any physical or mental health conditions or illnesses lasting or expected to last 12 months or more? 1. Yes 2. No |
| HEALIM Do these health problems or disabilities, when taken singly or together, substantially limit your ability to carry out normal day-to-day activities? 1. Yes 2. No | LIMACT (replacing HEALIM) Does your condition or illness/do any of your conditions or illnesses reduce your ability to carry out day-to-day activities? 1. Yes, a lot 2. Yes, a little 3. Not at all |
Download this table Table 1: Comparison of current and previous activity restriction survey questions
.xls .csvAnnual Population Survey (APS)
The APS is a continuous survey of households in the UK, which is produced quarterly and contains annual data. Each dataset (known as a quarterly rolling annual dataset) consists of wave 1 and 5 of the quarterly Labour Force Survey (LFS) and additional boost cases in England, Wales and Scotland, which are added to ensure that a sufficient number of interviews are conducted with economically active people in each local education authority area.
Each APS dataset contains approximately 170,000 households and 320,000 individuals. The primary purpose of the APS is to provide estimates for labour market and socio-economic analyses at subnational level and the APS is the recommended source of statistical information for analysis at unitary authority and local authority district level.
Although the design of the APS has a longitudinal element, the aggregated three-year period used in the subnational analyses of DFLE and HLE ensures the study population used excludes duplicate survey responders. The APS is intended to be representative of subnational populations including regions, upper and lower tier local authorities. The following chart shows how the study population for the subnational DFLE and HLE estimates are constructed from distinct waves of the LFS and APS boost.
Figure 1: Labour Force Survey and Annual Population Survey dataset structure
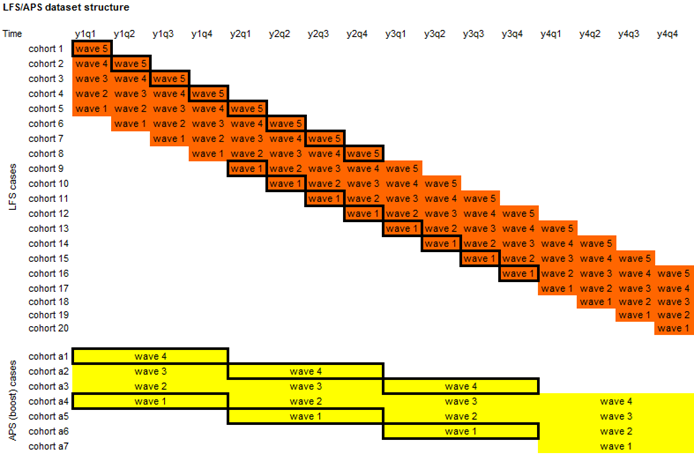
Source: Office for National Statistics
Download this image Figure 1: Labour Force Survey and Annual Population Survey dataset structure
.png (92.8 kB)
Survey data are weighted to match age, sex and regional profiles with mid-year population estimates. This calibration process ensures consistency between survey and population estimates and, additionally, compensates for potential bias that might arise from differential non-response among different subgroups in the sample selected for the survey.
Data for the APS are adjusted to account for sample selection and multi-household addresses. The cross-sectional elements of the APS are further weighted for non-response while the longitudinal elements of these surveys are weighted for attrition after first interview. Further information on survey data weighting is given in the Integrated Household Survey User Guide.
Indices of multiple deprivation
The national deprivation deciles are scores based on the area as a whole and not everyone within a Lower layer Super Output Area (LSOA) necessarily experiences the same level or type of deprivation. For example, some unemployed individuals live in less deprived LSOAs, while some higher-income individuals live in more deprived LSOAs. Similarly, deciles are a broad grouping and the levels of deprivation and the underlying factors determining the LSOA-level deprivation score will vary within the decile. Those LSOAs at the higher and lower end of each specific decile may vary considerably from each other. The widest variation is generally found between deciles 1 and 10.
England’s measure of deprivation is based on the Index of Multiple Deprivation (IMD). In 2019 the IMD was updated (IMD 2019) so for the period 2016 to 2018 IMD 2019 is used, prior to that IMD 2015 is used. The IMD is calculated using seven domains:
- income
- employment
- education, skills and training
- health and disability
- crime
- barriers to housing and services
- living environment
Wales’s measure of deprivation is based on the Welsh Index of Multiple Deprivation. In 2019 the WIMD was updated (WIMD 2019) so for the period 2016 to 2018 WIMD 2019 is used, prior to that WIMD 2014 is used. The WIMD is calculated using eight domains:
- income
- employment
- health
- education
- access to services
- community safety
- physical environment
- housing
Why you can trust our data
ONS is the UK’s largest independent producer of statistics and is the country's National Statistics Institute. The Data Policies and Information Charter, available on the ONS website, detail how data are collected, secured and used in the publication of statistics. We treat the data that we hold with respect, keeping it secure and confidential, and we use statistical methods that are professional, ethical and transparent. More information about our data policies is available.
Back to table of contents6. Methods used to produce the data
Life expectancy is calculated using the standard Chiang II abridged life table method. However, a minor modification has been added to the Chiang II life table calculations. This was to enable the calculation of a confidence interval at the final age group, 90 years and over. For this, a method developed by Silcocks and others (2001) has been used and its impact has been published in a methods paper in 2016.
Our statistics on health state life expectancy (HSLE), healthy life expectancy (HLE) and disability-free life expectancy (DFLE), all use the same core methodology, the Sullivan method. This method combines survey data, self-assessed general health and activity restriction from the Annual Population Survey (APS), with life expectancy to calculate the average number of years lived in a given state of health from a given age.
To prepare the survey data for the Sullivan method, a set of adjustments are applied to the three years APS pooled dataset. It is aimed to smooth the fluctuations in the subnational health prevalence, and to impute a plausible health prevalence at both younger and older ages. Both adjustments use the Census 2011 health data as they are considered a robust estimate of self-reported health and cover the entire UK population.
This new smoothing method adjusts APS self-reported health using a least squares regression method that includes a quadratic explanatory age variable and the 2011 Census health data. It was found that the mid-point of any age band, together with its square and the self-reported health prevalence at the 2011 Census, were good estimators of age specific self-reported health states across most local areas. This improves the capture of the relationship between health and age found in 2011 Census data and elsewhere.
The MS Excel template provides a detailed description of the standard methods and notation associated with the calculation of health state life expectancy.
Health state life expectancy by national deprivation deciles, England and Wales is also produced using the Annual Population Survey (APS) health data. This output compares deprivation deciles and quantifies the socioeconomic gap between the least and most deprived populations, using the Slope Index of Inequality.
The prevalence of “good” and “not good” general health is computed for each decile using APS data starting with the period 2011 to 2013 and annually moving forward. These data are combined with mortality data to compute expectation of life for each decile in “good” general health. Prevalence of "good" is modelled in the same way as in the local areas of the UK release.
Disability-free life expectancy is also provided for the period 2014 to 2016 and will be updated annually. Prevalence of no activity restriction (disability-free) is also modelled using the APS data, but the data items used to derive statistical measures of disability were changed in April 2013. For this reason, disability-free life expectancy has only been introduced for the release on socioeconomic contrasts from 2014 to 2016. The socioeconomic inequality in health state life expectancy measures, including life expectancy, is measured using the Slope Index of Inequality, which measures the absolute gap in years of life lived in total, and additional lived in "good" general health and disability-free.
Slope Index of Inequality
Inequality is measured in absolute terms using the range and the Slope Index of Inequality (SII). The range is the absolute difference between the most and least deprived deciles. The SII can be interpreted in the same way as the range but takes into account inequality across the whole distribution, as well as giving greater weight to larger populations and less weight to smaller populations. This means that the higher the SII, the more unequal the population is with regard to the outcome of interest.
The Slope Index of Inequality (SII) was used to assess the absolute inequality in life expectancy (LE) and each health state life expectancy between the least and most deprived deciles. This indicator measures the gaps by taking account of the inequality across all adjacent deciles of relative deprivation, rather than focusing only on the differencing of the two extremes.
It is worth noting that Public Health England (PHE) also calculate the SII, which is published in the Public Health Outcomes Framework (PHOF) back to 2010 to 2012, with slightly differing methodology for those aged over 65 years.
To calculate the SII the following method was used.
Deciles were ordered by decreasing area deprivation, that is, from the most to the least deprived. The fraction of the total population in each decile (f) was calculated. The cumulative frequency (ci), that is, the cumulative sum of the population in successively less deprived deciles, was also obtained and the relative deprivation rank (x) for each decile was calculated. This is explained through the following formula:
The formula calculates the relative deprivation rank for use in the SII calculation.
The SII (a line of best fit) was then estimated by regressing the outcome measures (LE, HLE and DFLE) separately against the relative deprivation rank (x), weighted by the population in each decile.
Confidence interval details for SII indicators
The confidence intervals for the SII are calculated using a simulation program. Simulation is a method used to estimate the degree of uncertainty for measures where the statistical distributions underpinning the measure are too complex to analyse mathematically.
For each decile, the life expectancy (LE), healthy life expectancy (HLE) and disability-free life expectancy (DFLE) have been calculated along with its standard error (SE). These SEs give information about the degree of uncertainty around each of the health state life expectancy values: essentially, it describes a statistical distribution for each decile.
Using a random-number-generating algorithm, a random value is taken from each decile LE and HLE distribution and the SII recalculated. This is repeated many times (for example, 10,000), to build up a distribution of SII values based on random sampling from the decile LE distributions. The 2.5% and 97.5% values from this distribution of SII values are then reported as the 95% confidence interval for the SII, rather than that based on 10 observations representing the deciles.
Note that previously the confidence intervals were calculated based purely on the SII regression slope, ignoring the distributional information about the decile LEs and HLEs. This method generally overestimated the width of the confidence intervals, that is, it was overly conservative in most cases. The current method allows greater discrimination between areas and over time and greater opportunity to detect significance change over time.
Back to table of contents7. Other information
Output quality trade-offs
(Trade-offs are the extent to which different dimensions of quality are balanced against each other.)
Life expectancy figures are not routinely calculated by us for areas smaller than local authorities due to small numbers of deaths and populations. More information can be found in a report titled Life expectancy at birth: methodological options for small populations. However, for five-year periods centred on the census year, we have produced health state life expectancies for Middle layer Super Output Areas (MSOAs) and Census 2011 Wards.
Assessment of user needs and perceptions
(The processes for finding out about use and users, and their views on the statistical products. are maintained with a range of users including those from government and academics.)
Understanding user needs is important to us, and we invite feedback from users regarding both the statistical bulletin and this Quality and Methodology Information report. Face-to-face meetings and email and telephone correspondence is maintained with a range of users including government users, academics, students and interested individuals.
A user consultation to review health expectancy statistics that we produce took place in 2008 and the response to the 2008 review is available.
A user consultation was held in 2017 to review the proposed method changes to UK health state life expectancies and the response to the 2017 review is available.
Users were also consulted as part of the UK Statistics Authority assessment of compliance with the Code of Practice for Statistics.
The Health Analysis Team maintains a list of known users including which statistical outputs they use and how they use them. All known users will be invited to participate in any future consultation.
Feedback is also received through our regular attendance at Royal Statistical Society Health Statistics User Group meetings and academic conferences.
We welcome your feedback. If you have any comments or questions about the statistical bulletin or this Quality and Methodology Information, please get in touch using the email address provided.