Table of contents
1. Main points
- Of responding businesses, 92% said they were trading between 29 June and 12 July 2020, compared with 86% of responding businesses between 1 and 14 June 2020 before non-essential retail was allowed to reopen in England, according to the Business Impact of Coronavirus (COVID-19) Survey (BICS).
- The proportion of adults wearing a face covering when leaving the home increased from 61% to 71% according to the latest Opinions and Lifestyle Survey (OPN).
- On 17 July, overall footfall rose to two-thirds of its level the same day a year ago, the highest since lockdown began.
- Between 10 and 17 July, the total volume of job adverts increased to just over 50% of their 2019 average.
- Overall, prices of items in the high-demand product (HDP) basket decreased by 0.7% between the week ending 12 July and the week ending 19 July, the largest decrease since the series started on 16 March.
- In the week commencing 13 July, Energy Performance Certificate (EPC) lodgements for existing dwellings across all English regions returned to similar levels observed at the end of February, while EPC lodgements for new dwellings were around 25% lower across England and Wales.
- Average daily visits of all ships remained stable for a third consecutive week.
The Business Impact of Coronavirus (COVID-19) Survey (BICS) is voluntary and currently unweighted, so it may only reflect the characteristics of those that responded. Online price change analysis is experimental and should not be compared with our regular consumer price statistics. Results presented are experimental.
2. Business impact of the coronavirus
This section includes initial results from Wave 9 of the Business Impact of Coronavirus (COVID-19) Survey (BICS) for the period 29 June to 12 July 2020, which closes on 26 July 2020. Out of 24,493 businesses sampled, 21% had responded as of 21 July 2020.
Figure 1: 39% of businesses who had furloughed staff, were providing pay top-ups to the Coronavirus Job Retention Scheme, covering 65% of their furloughed workforce
Headline indicators from the Business Impact of Coronavirus Survey, 29 June to 12 July, UK
Embed code
Source: Office for National Statistics – Business Impact of Coronavirus Survey
Notes:
- All percentages are a proportion of the number of businesses who responded apart from the workforce percentages on furlough leave and receiving pay top-ups, which are apportioned by workforce size.
Figure 2 shows a comparison of trading status between businesses responding to Wave 7 (reference period 1 to 14 June), Wave 8 (reference period 15 to 28 June) and Wave 9 (reference period 29 June to 12 July). However, please note that Wave 9 results are still provisional at this stage and that the estimates are not weighted; therefore, the estimates for each wave are dependent on which businesses responded to the survey, which may be different in different waves.
Figure 2: 92% of responding businesses said they were trading between 29 June and 12 July, compared with 86% between 1 and 14 June
Percentage of businesses by trading status and wave, UK, 1 June to 12 July 2020
Source: Office for National Statistics – Business Impact of Coronavirus (COVID-19) Survey
Notes:
- Initial results, Wave 9 of the Office for National Statistics (ONS) Business Impact of Coronavirus (COVID-19) Survey (BICS); therefore, they are subject to change.
- The percentages in this chart might not sum to 100% because of rounding and the exclusion of businesses permanently ceased trading.
- Estimates are not weighted; therefore, the estimates for each wave are dependent on which businesses responded to the survey, which may be different in different waves.
Download this chart Figure 2: 92% of responding businesses said they were trading between 29 June and 12 July, compared with 86% between 1 and 14 June
Image .csv .xlsOf businesses currently trading, 7% of their total workforce had returned from furlough in the two weeks prior to completing the questionnaire and 4% had returned from remote working. In businesses still trading or intending to restart trade in the next two weeks, 6% of the workforce are expected to return from furlough and 4% are expected to return from remote working.
The Coronavirus Job Retention Scheme (CJRS) was the most popular government scheme applied for, with 79% of all businesses currently trading applying for this. A higher percentage of businesses that had temporarily paused trading had applied for each of the government schemes compared with businesses continuing to trade.
Of businesses continuing to trade, 41% reported that they had less than six months of cash reserves and 4% reported they had no cash reserves. These figures were both higher for businesses that had paused trading, with 62% reporting less than six months of cash reserves and 7% reporting no cash reserves. Of businesses continuing to trade:
- 17% reported there had been more innovation during the coronavirus pandemic, while 6% reported there had been less
- 6% reported that their capital expenditure had increased, 23% said that it had decreased and 15% said that capital expenditure had stopped
- 12% had diversified to provide new goods or services as a result of the coronavirus pandemic
Table 1 shows the financial performance of businesses currently trading.
| Turnover has increased by more than 50% | 1% |
| Turnover has increased between 20% and 50% | 3% |
| Turnover has increased by up to 20% | 6% |
| Turnover has not been affected | 26% |
| Turnover has decreased by up to 20% | 21% |
| Turnover has decreased between 20% and 50% | 21% |
| Turnover has decreased by more than 50% | 15% |
| Not sure | 6% |
Download this table Table 1: 57% of trading businesses reported that their turnover had decreased below what is normally expected for this time of year
.xls .csvMore about coronavirus
4. Footfall
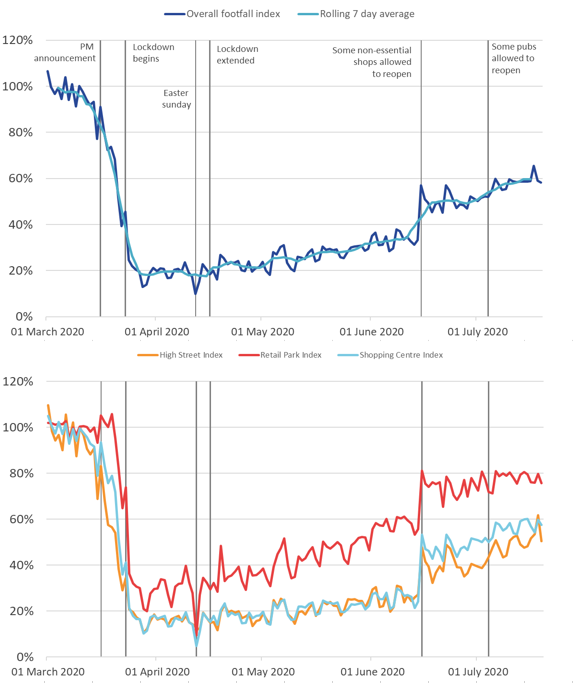
These figures are provided by Springboard, a provider of data on customer activity. They measure the volume of footfall compared with the same day the previous year at the overall level and across the categories of high streets, retail parks and shopping centres. For example, Tuesday 14 July 2020 was compared with Tuesday 16 July 2019.
Figure 4: On Friday 17 July overall footfall rose to two-thirds of its level the same day a year ago, the highest since lockdown began
Volume of footfall, year-on-year percentage change between footfall on the same day, UK, 1 March to 19 July 2020
Source: Springboard and the Department for Business, Energy and Industrial Strategy
Notes:
- Many essential shops were allowed to open on 15 June 2020 in England, 12 June 2020 in Northern Ireland and 22 June in Wales. In Scotland, some non-essential shops were allowed to reopen from 29 June, and more from 13 to 15 July.
- ‘Prime Minister’s announcement’ refers to the advisory announcement on 16 March 2020 to avoid non-essential travel, bars, restaurants and other indoor leisure venues, and to work from home if possible.
- Pubs were allowed to reopen on 4 July in both England and Northern Ireland, with beer gardens allowed to reopen on 6 July in Scotland and 13 July in Wales. Pubs were also allowed to reopen indoors in Scotland on 15 July.
Download this image Figure 4: On Friday 17 July overall footfall rose to two-thirds of its level the same day a year ago, the highest since lockdown began
.PNG (107.0 kB)
Since the re-opening of non-essential shops and businesses in England on 15 June, overall levels of footfall have been gradually increasing. The seven-day average is now at 60% of the footfall level the same day a year ago, the highest reported since 20 March 2020. On Friday 17 July, overall footfall reached two-thirds of the level the same day a year ago.
Footfall in retail parks and shopping centres remained relatively stable in the latest week (13 to 19 July), while high street footfall rose on Saturday 18 July 2020 to just over 60% of its level on Saturday 20 July 2019.
Back to table of contents5. Online job adverts
These figures use job adverts provided by Adzuna, an online job search engine. These estimates are experimental and will be developed over the coming weeks to include NUTS1 regional breakdowns. The number of job adverts over time is an indicator of the demand for labour.
Figure 5: Between 10 July and 17 July 2020, the total volume of job adverts increased to just over 50% of their 2019 average
Total weekly job adverts on Adzuna, UK, 4 January 2019 to 17 July 2020: index 2019 average = 100
Embed code
Notes:
- The observations were collected on a roughly weekly basis; however, they were not all observed at the same point in each week, leading to slightly irregular gaps between each observation.
- These series have a small number of missing weeks, mostly in late 2019, and the latest is in January 2020. These values have been imputed using linear interpolation. The data points that have been imputed are clearly marked in the accompanying dataset.
- Further category breakdowns are included in the Online job advert estimates dataset, and more details on the methodology can be found in Using Adzuna data to derive an indicator of weekly vacancies.
Between 10 and 17 July, the volume of total online job adverts increased slightly from 48% to 52% of its 2019 average, having remained at around half of their 2019 average over the last month. The current level is higher than the lockdown low point of 42%, reached on 1 May 2020.
Almost all Adzuna categories saw small increases in job adverts from the previous week, including those of health and social care, education, and catering and hospitality. Only two categories saw a decrease compared with the previous week; these were wholesale and retail (negative 0.4 percentage points) and the unknown category (negative 0.3 percentage points).
The categories presented here were selected because of user interest and because they more closely track trends in the Office for National Statistics (ONS) vacancies data. Note that the Adzuna categories used do not correspond to Standard Industrial Classification (SIC) categories, so these values are not directly comparable with the ONS Vacancy Survey.
Back to table of contents6. Online price change for high-demand products (HDPs)
A timely indication of weekly price change for high-demand products (HDPs) has been developed, covering the period 16 March to 19 July 2020. A timeline of developments for these indicators can be found in Online price changes of HDPs methodology. This analysis is experimental and should not be compared with our regular consumer price statistics.
Figure 6: Overall, prices of items in the HDP basket decreased by 0.7% between week 17 and week 18, the largest decrease since the series started on 16 March
Online price change of high-demand products, UK, percentage change between week 17 (6 to 12 July 2020) and week 18 (13 to 19 July 2020)
Source: Office for National Statistics – Faster indicators
Notes:
- More information on the strengths and limitations of the online price changes data is available in the Online price changes for high-demand products methodology article.
Download this chart Figure 6: Overall, prices of items in the HDP basket decreased by 0.7% between week 17 and week 18, the largest decrease since the series started on 16 March
Image .csv .xlsFigure 6 shows in addition to the overall HDP items index, the prices for all food also fell by 0.7% in the latest week (13 to 19 July) compared with the previous week (6 to 12 July), while prices for all household and hygiene goods fell by a greater 1.1%.
The downward movement in all household and hygiene goods was primarily driven by an 8.9% decrease in the price of nappies, as a result of price reductions seen in multiple retailers. Nappy prices have been quite volatile compared with other HDP items since the series started in mid-March, with Figure 7 showing that they have fluctuated heavily as products go on and off promotion across multiple retailers.
Figure 7: In the latest week, prices for nappies were at their lowest point since the series began in mid-March
Online price change of selected high-demand products 16 March to 19 July: index week 1 (16 to 22 March 2020) = 100, UK
Source: Office for National Statistics – Faster indicators
Notes:
- Index movements may not be exactly the same as percentage changes shown in Figure 6 as a result of rounding.
- Week 1 refers to the period 16 to 22 March 2020, and week 18 refers to the period 13 July to 19 July.
- The time series for all individual high-demand product (HDP) items are published in a dataset alongside this release.
Download this chart Figure 7: In the latest week, prices for nappies were at their lowest point since the series began in mid-March
Image .csv .xls7. Energy Performance Certificates
This release includes weekly Energy Performance Certificates (EPCs) for new and existing domestic properties in England and Wales and split by NUTS1 English regions, which are included for the first time in this release.
An EPC contains information on the energy efficiency of a property and is a requirement when a property is built, sold or rented in England and Wales. New building(s) or conversions of existing buildings require an EPC once construction has been completed. More information on the EPC methods, strengths and limitations is available in the Coronavirus and the latest indicators for the UK economy and society methodology.
The EPCs for domestic properties are published weekly by the Ministry of Housing, Communities and Local Government (MHCLG) on the Live tables on Energy Performance of Buildings Certificates. As such, they can be used as a timely indicator for the number of completed constructions and number of transactions.
Figure 8 shows in the week commencing 13 July, existing EPC lodgements across all English regions returned to similar levels observed at the end of February, while new EPC lodgements for England and Wales combined were around 25% lower than at the end of February. EPC lodgements for both new and existing dwellings started to recover towards the end of May after reaching a low in early April, though EPCs for new dwellings recovered at a slower rate. A reduction in construction would contribute to the delay in EPC assessments of new dwellings.
The spike in the number of EPCs for existing dwellings seen in Wales during the weeks commencing 8 and 15 June 2020 was caused by local authorities in Wales reviewing their social housing stock.
Figure 8: In the week commencing 13 July, EPC lodgements for existing dwellings across all English regions returned to similar levels observed at the end of February, whilst EPC lodgements for new dwellings were around 25% lower across England and Wales
Existing and new Energy Performance Certificates lodgements by region, non-seasonally adjusted, February 2020 to July 2020. Percentage change since week commencing 24 February 2020
Embed code
Source: Ministry of Housing, Communities and Local Government (MHCLG) Domestic Energy Performance Certificate Register
Notes:
Further notes are available in the weekly EPCs for domestic properties dataset.
Week commencing 24 February 2020 is when the weekly time series begins; we will look to extend this in the future.
8. Shipping
These shipping indicators are based on counts of all vessels, cargo and tanker vessels and passenger vessels. As discussed in Faster indicators of UK economic activity: shipping, we expect the shipping indicators to be related to the import and export of goods.
Figure 9: Between 13 and 19 July, average daily visits of all ships remained stable for a third consecutive week, while the visits of passenger ships increased slightly
Daily movements in shipping visits, seasonally adjusted, UK, 1 January 2020 to 19 July 2020
Source: exactEarth
Notes:
- The number of visits for Hull are included in these data from 1 June 2020 onwards.
- The seasonally adjusted and trend estimates are estimated using a modified version of the seasonal adjustment method TRAMO-SEATS. More information is available in the Coronavirus and the latest indicators for the UK economy and society methodology
- The seasonal adjustment method may be limited as this is a short time series.
- Daily and weekly shipping visits and unique visits are available by port in the dataset, along with non-seasonally adjusted aggregate series.
Download this chart Figure 9: Between 13 and 19 July, average daily visits of all ships remained stable for a third consecutive week, while the visits of passenger ships increased slightly
Image .csv .xlsWhile the volume of daily visits of all ships increased substantially through June, in the most recent three weeks it has stabilised to normal levels of traffic, similar to pre-lockdown levels.
On a seasonally adjusted basis, daily visits of all ships remained stable for a third consecutive week with an average of 374 visits over the most recent week, 13 to 19 July. In comparison, the daily average for the previous week was 377. Cargo ships also remained stable at a weekly average of 91 daily visits, compared with 93 in the previous week. Visits of passenger ships saw a small increase in their daily average from 78 the week before to 83 visits between 13 and 19 July.
Back to table of contents9. Data
Weekly and daily shipping indicators
Dataset | Released 23 July 2020
The weekly and daily shipping indicators dataset associated with the faster indicators of UK economic activity.
Online price changes for high-demand products
Dataset | Released 23 July 2020
Weekly online price changes of selected high-demand products (HDPs).
Online job advert estimates
Dataset | Released 23 July 2020
Experimental job advert indices covering the UK job market.
Back to table of contents
10. Glossary
Faster indicator
A faster indicator provides insights into economic activity using close-to-real-time big data, administrative data sources, rapid response surveys or experimental statistics, which represent useful economic and social concepts.
High-demand product (HDP) basket
The high-demand product (HDP) basket contains everyday essential items that were identified at the beginning of the crisis to have high consumer demand, including items from food, health and hygiene categories. The selection of these items was based on anecdotal evidence on patterns of consumer spend. The basket does not cover all items within these categories.
Back to table of contents11. Measuring the data
Detailed information on the data sources, quality and methodology of the different indicators included in this bulletin is available in the Coronavirus and the latest indicators of the UK economy and society methodology.
We will summarise any crucial updates to the quality or methodology in this section in the future.
Back to table of contents12. Strengths and limitations
Detailed information on the strengths and limitations of the different indicators included in this bulletin is available in the Coronavirus and the latest indicators of the UK economy and society methodology.
We will summarise any crucial updates or warnings in this section in the future.
Back to table of contents
3. Social impacts of the coronavirus on Great Britain
This section includes some headline results from Wave 18 of the Opinions and Lifestyle Survey (OPN) covering the period 15 to 19 July 2020. The full results will be published in Coronavirus and the social impacts on Great Britain on 24 July 2020.
Figure 3 shows that the proportion of adults wearing a face covering when leaving the home continued to increase in the latest week to 71%, from 61% the previous week. This continues an increasing trend after face coverings became mandatory on public transport in England on 15 June and in Scotland on 22 June as well as in shops in Scotland on 10 July.
The proportion of working adults travelling to work at some point during the previous week rose above 50% for the first time since data started being collected in mid-May, while the proportion working at home exclusively remained stable at 27%.
Figure 3: The proportion of adults wearing a face covering when leaving the home increased to 71% from 61% in the previous week
Proportion of adults, Great Britain, 14 May to 19 July 2020
Source: Office for National Statistics – Opinions and Lifestyle Survey
Notes:
Download this chart Figure 3: The proportion of adults wearing a face covering when leaving the home increased to 71% from 61% in the previous week
Image .csv .xls