Table of contents
- Main points
- Excess winter mortality in England and Wales
- Daily deaths
- Excess winter mortality by sex and age
- Excess winter mortality by cause of death
- Weekly deaths and influenza activity
- Mortality and temperature
- Excess winter mortality across regions
- Excess winter mortality data
- Glossary
- Measuring the data
- Strengths and limitations
- Related links
1. Main points
There were an estimated 23,200 excess winter deaths which occurred in England and Wales in the 2018 to 2019 winter, the lowest since the winter of 2013 to 2014.
The excess winter mortality index in England in 2018 to 2019 was statistically significantly lower than the 2016 to 2017 and 2017 to 2018 winters.
The excess winter mortality index in Wales in 2018 to 2019 was statistically significantly lower than all years since the 2013 to 2014 winter.
Excess winter mortality continued to be higher in females compared with males and highest in females aged 90 years and over compared with females at younger ages.
Respiratory diseases continued to be the leading cause of excess winter deaths which occurred in 2018 to 2019.
2. Excess winter mortality in England and Wales
The mortality data in this bulletin is based on death occurrences (the date on which a death occurred) rather than death registrations (the date on which a death was registered). Provisional excess winter deaths (EWD) data are produced for the most recent winter using special estimation methods to adjust for late registrations.
Looking for information on the coronavirus?
In the 2018 to 2019 winter period (December to March), there were an estimated 23,200 EWD in England and Wales (Figure 1). This was substantially lower than the 49,410 EWD observed in the 2017 to 2018 winter and lower than all recent years since 2013 to 2014 when there were 17,280 EWD.
Figure 1: The five-year moving average increased for the third consecutive year
Excess winter deaths and five-year central moving average (based on death occurrences), England and Wales, between 1950 to 1951 and 2018 to 2019
Source: Office for National Statistics
Notes:
- Figures are based on deaths occurring in each period (August through to the following July). Numbers of deaths from January to July 2019 are provisional and have been adjusted to take account of late registrations.
- Provisional figures for the latest winter are rounded to the nearest 100, figures for all other winters are final and are rounded to the nearest 10.
- Data from 1991 to 1992 onwards have been revised using the most up-to-date death occurrence data. As a result, figures may not match those previously published.
- Central moving averages were calculated using the winter period of interest, along with the two winter periods before and two periods after.
- Figures for England and Wales combined include deaths of non-residents.
Download this chart Figure 1: The five-year moving average increased for the third consecutive year
Image .csv .xlsLarge fluctuations in EWD between years are common, so a five-year moving average is included in Figure 1 to smooth out short-term fluctuations and make the trend over time clearer. Generally, historical trends in EWD in England and Wales show that the steady decreases since the 1950 to 1951 winter period have levelled off and most recently increased for the third consecutive year.
The excess winter mortality (EWM) index in 2018 to 2019 showed that 14.2% more deaths occurred in the winter months in England compared with the non-winter months, while 13.1% more deaths occurred in the winter in Wales compared with the non-winter (Figure 2). The most recent EWM index for England was statistically significantly lower than the 2016 to 2017 and 2017 to 2018 winters. Wales’ EWM index however was statistically significantly lower than all years since the 2013 to 2014 winter.
Figure 2: Excess winter mortality index in 2018 to 2019 statistically significantly lower than 2017 to 2018
Excess winter mortality index (based on death occurrences) by country, England and Wales, between 1991 to 1992 and 2018 to 2019
Source: Office for National Statistics
Notes:
- Figures are based on deaths occurring in each period (August through to the following July). Numbers of deaths from January to July 2019 are provisional and have been adjusted to take account of late registrations.
- The excess winter mortality (EWM) index is calculated as excess winter deaths (EWD) divided by the average non-winter deaths, expressed as a percentage.
- Figures for England and Wales exclude deaths of non-residents.
Download this chart Figure 2: Excess winter mortality index in 2018 to 2019 statistically significantly lower than 2017 to 2018
Image .csv .xls3. Daily deaths
For the 2018 to 2019 winter period in England, the highest peak in daily deaths occurred on 1 February 2019 (Figure 3a). This coincided with the coldest winter day on the 31 January 2019 with a maximum temperature in England of 1.7 degrees Celsius. This peak is much later than in previous winters where an increase in deaths normally occurs towards the beginning of January, as observed by the five-year average. The number of daily deaths during the 2018 to 2019 winter was below the five-year average throughout the majority of the period (97 out of 121 days). In contrast, the number of daily deaths during the non-winter months of April to July were above the five-year average for the majority of the period (80 out of 122 days), which would have an impact on excess winter deaths (EWD).
Figure 3a: The number of daily winter deaths in England was lower than the five-year average for most days
Daily deaths and five-year average daily deaths (based on death occurrences), August 2018 to July 2019
Source: Office for National Statistics
Notes:
- Figures are based on deaths occurring each day. Numbers of deaths from January to July 2019 are provisional and have been adjusted to take account of late registrations.
- Five-year averages for each day are calculated using data from the previous five years excluding the current year.
- Figures for England exclude deaths of non-residents.
Download this chart Figure 3a: The number of daily winter deaths in England was lower than the five-year average for most days
Image .csv .xlsIn Wales, the highest peak in daily deaths during the 2018 to 2019 winter was on the 13 February 2019 (Figure 3b), which like England was later than previous winters. In comparison with the five-year average, daily winter deaths in Wales were lower across the majority of days (87 out of 121 days).
The decrease in daily deaths across England and Wales during the winter of 2018 to 2019 coincided with milder winter temperatures and low to moderate levels of influenza activity (PDF, 2.14MB).
Figure 3b: The number of daily winter deaths in Wales was lower than the five-year average for most days
Daily deaths and five-year average daily deaths (based on death occurrences), August 2018 to July 2019
Source: Office for National Statistics
Notes:
- Figures are based on deaths occurring each day. Numbers of deaths from January to July 2019 are provisional and have been adjusted to take account of late registrations.
- Five-year averages for each day are calculated using data from the previous five years excluding the current year.
- Figures for Wales exclude deaths of non-residents.
Download this chart Figure 3b: The number of daily winter deaths in Wales was lower than the five-year average for most days
Image .csv .xls4. Excess winter mortality by sex and age
In England there were an estimated 21,900 excess winter deaths (EWD) in 2018 to 2019 with 46% among males (10,100 EWD) and 54% (11,800 EWD) among females. EWD are generally higher among females which may partly be explained by the higher proportion of females aged 90 years and over compared with males.
In comparison with the previous winter period, the EWM index in England has statistically significantly decreased for both sexes across all age groups. The largest percentage point differences between the winters of 2017 to 2018 and 2018 to 2019 were among those aged 90 years and over, with the females’ index decreasing from 47.0% to 19.3% and males decreasing from 40.2% to 18.1%.
The highest EWM index during 2018 to 2019 was for males and females aged 90 years and over (18.1% and 19.3% respectively) which was statistically significantly higher than all other ages. Interestingly, the EWM index for males aged 85 to 89 years was statistically significantly lower than all years since the beginning of the time series in 1991 to 1992. In contrast, the EWM index for males aged 0 to 74 years was statistically significantly higher than winters 2015 to 2016 and 2016 to 2017 but was statistically significantly lower than 2017 to 2018.
Figure 4a: Excess winter mortality index was statistically significantly lower across all age groups than last winter in England
Excess winter mortality index (based on death occurrences) by age group and sex, England, between 2017 to 2018 and 2018 to 2019
Source: Office for National Statistics
Notes:
- Figures are based on deaths occurring in each period (August through to the following July). Numbers of deaths from January to July 2019 are provisional and have been adjusted to take account of late registrations.
- The excess winter mortality (EWM) index is calculated as excess winter deaths (EWD) divided by the average non-winter deaths, expressed as a percentage.
- Figures for England exclude deaths of non-residents.
Download this chart Figure 4a: Excess winter mortality index was statistically significantly lower across all age groups than last winter in England
Image .csv .xlsIn Wales, there were an estimated 1,400 EWD in 2018 to 2019; like England, there were more EWD among females than males.
In comparison with the previous winter period, the EWM index in Wales statistically significantly decreased for both sexes across all age ranges. Like England, the largest percentage point differences between 2017 to 2018 and 2018 to 2019 were observed in those aged 90 years and over with the female index decreasing from 52.3% to 22.1% and the male from 41.5% to 16.5%.
The highest EWM index during 2018 to 2019 was observed for females aged 90 years and over (22.1%), which was statistically significantly higher than all other ages. For males, the highest EWM index was observed in those aged 75 to 79 years (21.1%) which was statistically significantly higher than all age groups except 90 years and over. Interestingly, the EWM index for males aged 80 to 84 years was statistically significantly lower than all years since 2001 to 2002.
Figure 4b: Excess winter mortality index in Wales decreased in 2018 to 2019 for both sexes compared to last winter
Excess winter mortality index (based on death occurrences) by age group and sex, between 2017 to 2018 and 2018 to 2019
Source: Office for National Statistics
Notes:
- Figures are based on deaths occurring in each period (August through to the following July). Numbers of deaths from January to July 2019 are provisional and have been adjusted to take account of late registrations.
- The excess winter mortality (EWM) index is calculated as excess winter deaths (EWD) divided by the average non-winter deaths, expressed as a percentage.
- Provisional excess winter deaths (EWD) figures for the latest winter are rounded to the nearest 100. Where there are instances when EWD are below 100, an excess winter mortality (EWM) index is not presented. This is the case for females aged 75 to 79 years in 2018 to 2019.
- Figures for Wales exclude deaths of non-residents.
Download this chart Figure 4b: Excess winter mortality index in Wales decreased in 2018 to 2019 for both sexes compared to last winter
Image .csv .xlsThe substantial reductions observed in both England and Wales since the previous winter shows the fluctuations in EWM. The recent decreases are likely related to the milder weather experienced in the winter months compared with the previous winter and the lower impact of influenza on the elderly in 2018 to 2019, and supports improvement in the efficacy of influenza vaccines (Public Health England, 2019) (PDF, 2.14MB).
Back to table of contents5. Excess winter mortality by cause of death
Figure 5 presents the excess winter mortality (EWM) index by the three leading causes of death: circulatory diseases (defined as International Classification of Diseases, 10th Revision (ICD-10) codes I00 to I99), respiratory diseases (defined as ICD-10 codes J00 to J99) and dementia and Alzheimer’s disease (defined as ICD-10 codes F01, F03 and G30).
Respiratory diseases remained the leading cause of EWM in 2018 to 2019, with 48.2% (8,900 excess winter deaths (EWD)) and 39.6% (600 EWD) more respiratory deaths in the winter months compared with the non-winter months in England and Wales respectively. This accounted for 40.6% of all EWD in England and 42.9% of all EWD in Wales. The EWM index for respiratory diseases was statistically significantly lower than the two previous periods in both countries.
Of these excess respiratory deaths, pneumonia (defined as ICD-10 codes J12 to J18) accounted for the largest proportions, making up 34.8% of total excess respiratory deaths in England and 50.0% in Wales. During 2018 to 2019, there were 47.7% (3,100 EWD) more pneumonia deaths in the winter period than the non-winter period in England, and 50.9% (300 EWD) more deaths in the winter period in Wales.
Figure 5: Excess winter mortality index for respiratory diseases statistically significantly decreased in England and Wales since last winter
Excess winter mortality index (based on death occurrences) by underlying cause of death and country, England and Wales, between 2017 to 2018 and 2018 to 2019
Source: Office for National Statistics
Notes:
- Underlying cause of death is defined using the International Classification of Diseases, Tenth Revision (ICD-10) using I00 to I99 for circulatory diseases, J00 to J99 for respiratory diseases and F01, F03 and G30 for dementia and Alzheimer’s disease.
- Figures are based on deaths occurring in each period (August through to the following July). Numbers of deaths from January to July 2019 are provisional and have been adjusted to take account of late registrations.
- The excess winter mortality (EWM) index is calculated as excess winter deaths (EWD) divided by the average non-winter deaths, expressed as a percentage.
- Figures for England and Wales exclude deaths of non-residents.
Download this chart Figure 5: Excess winter mortality index for respiratory diseases statistically significantly decreased in England and Wales since last winter
Image .csv .xlsDementia and Alzheimer’s disease accounted for 18.7% and 21.4% of all EWD in England and Wales respectively in the winter of 2018 to 2019, with 22.1% (4,100 EWD) and 30.0% (300 EWD) more deaths occurring in the winter months than the non-winter months. For England, the EWM index was statistically significantly lower than the previous two winters, while the EWM index for Wales was statistically significantly lower than 2017 to 2018.
Circulatory diseases accounted for 22.4% and 14.3% of all EWD in England and Wales respectively, with 12.8% (4,900 EWD) and 7.2% (200 EWD) more deaths occurring in the winter months than the non-winter months. For England, the EWM index for 2018 to 2019 was statistically significantly lower than the previous two periods, and for Wales the EWM index was statistically significantly lower than all periods since the beginning of the time series in 1991 to 1992.
Back to table of contents6. Weekly deaths and influenza activity
Influenza is a respiratory disease caused by a viral infection that affects the lungs and airways (World Health Organization, 2008). Influenza infections can become potentially life-threatening when complications such as bacterial pneumonia occur. Those at greatest risk of developing complications are persons with other underlying health conditions and the elderly and such complications may result in hospitalisation or death.
Figure 6a plots the weekly number of all cause deaths and weekly influenza-like illness (ILI) consultation rates in primary care in England from week 31 in 2004 to week 30 in 2019 (where week 1 is the first week of the year). In 2019, the ILI consultation rate peaked in week 6 (24.7 consultations per 100,000 population) occurring later than in 2018, which peaked in week 2 and was more than double the size (59.2 consultations per 100,000 population). The peak number of deaths in the 2018 to 2019 period occurred in week 1 of 2019 with 11,672 deaths, the same as the 2017 to 2018 period, which had a peak number of 13,217 deaths in week 1 of 2018.
Figure 6a: The highest number of weekly deaths in England occurred in week 1 of 2019
Weekly deaths from all causes (based on death occurrences) and influenza-like illness (ILI), consultation rates per 100,000 population, between 2004 to 2019
Source: Office for National Statistics and The Royal College of General Practitioners Research and Surveillance Centre
Notes:
- Figures are based on deaths occurring each week. Numbers of deaths from January to July 2019 are provisional and have been adjusted to take account of late registrations.
- Influenza-like illness (ILI) consultation rates for England are presented from 2004 onwards as data back to this time point is deemed most reliable due to changes in coding in primary care increasing consistency.
- Figures for England exclude deaths of non-residents.
Download this chart Figure 6a: The highest number of weekly deaths in England occurred in week 1 of 2019
Image .csv .xlsFigure 6b plots the weekly number of all cause deaths and weekly influenza-like illness (ILI) consultation rates in primary care in Wales from week 31 in 1999 to week 30 in 2019 (where week 1 is the first week of the year). In 2019, the ILI consultation rate peaked in week 3 (22.9 consultations per 100,000 population), which was the same as 2018, however it was considerably lower (74.7 consultation per 100,000 population). The highest number of weekly deaths in the 2018 to 2019 period occurred in week 1 of 2019, with 816 deaths. This was a week earlier than the 2017 to 2018 period, which had a peak of 899 deaths in week 2 of 2018.
Figure 6b: The highest number of weekly deaths in Wales occurred in week 1 of 2019
Weekly deaths from all causes (based on death occurrences) and influenza-like illness (ILI), consultation rates per 100,000 population, between 1999 to 2019
Source: Office for National Statistics and Public Health Wales
Notes:
- Figures are based on deaths occurring each week. Numbers of deaths from January to July 2019 are provisional and have been adjusted to take account of late registrations.
- The surveillance system used to calculate influenza-like illness (ILI) consultation rates in Wales changed between 2009 to 2010 and 2010 to 2011 so caution is advised when comparing rates before and after these periods.
- Figures for Wales exclude deaths of non-residents.
Download this chart Figure 6b: The highest number of weekly deaths in Wales occurred in week 1 of 2019
Image .csv .xlsThis season saw low to moderate levels of influenza activity, according to Public Health England’s UK Surveillance report (PDF, 2.14MB), with circulation of influenza A(H1N1)pdm09 followed by influenza A(H3N2) in the latter part of the season. This contrasted with the moderate to high levels observed during the 2017 to 2018 winter, when there was co-circulation of influenza B and influenza A(H3).
During 2018 to 2019, the influenza vaccination uptake was similar to that in 2017 to 2018 in those aged 65 years and over and those in clinical risk groups in both England and Wales. In terms of vaccine effectiveness, vaccinations were most effective in those aged over 65 years with 49.9% effectiveness compared with 48.6% in those aged 2 to 17 years and 44.2% in those aged 18 to 64 years. The increased effectiveness of the influenza vaccination across all age groups along with the lower levels of influenza activity during 2018 to 2019 coincided with a decrease in excess winter deaths (EWD).
Back to table of contents7. Mortality and temperature
Research has shown that as the temperature gets colder mortality increases, but temperature is only able to explain a part of the variance in excess winter mortality (EWM)(PDF, 293KB).
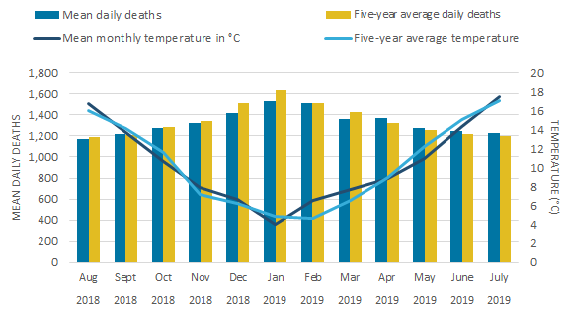
During the winter period (December to March), England had a lower count of mean daily deaths when compared with the five-year average for all winter months apart from February, which had one additional death (Figure 7a). Wales showed a similar pattern with all winter months having a lower death count than the five-year average. Consistent with previous winters, January had the highest mean daily deaths in England (1,531 deaths) and Wales (103 deaths). However, in both countries, the majority of non-winter months had higher mean daily deaths than the five-year average. In England, only August, October and November had slightly lower deaths than the average and in Wales, July, August and October had either the same or slightly lower mean daily deaths.
Above average temperatures were observed in 6 out of 12 months in England and 7 out of 12 months in Wales, particularly during the winter months where December, February and March were all higher than the five-year average in England and Wales.
These warmer than average temperatures for the winter months in 2018 to 2019 could partly explain the decrease in winter deaths. However, decreased EWD are not always coupled with milder winters and conversely winters with increased EWD are not always coupled with colder winter temperatures, indicating factors other than temperature, such as influenza, are also relevant in explaining trends in EWM.
Figure 7a: The majority of winter months had lower counts of mean daily deaths than the five-year average in England
Mean number of daily deaths each month (based on death occurrences) and mean monthly temperatures, August 2018 to July 2019
Source: Office for National Statistics, The Met Office
Notes:
- Daily deaths data is based on deaths occurring in each month. Numbers of deaths from January to July 2019 are provisional and have been adjusted to take account of late registrations.
- Five-year averages for each month are calculated using data from the previous five years excluding the current year.
- Figures for England exclude deaths of non-residents.
Download this image Figure 7a: The majority of winter months had lower counts of mean daily deaths than the five-year average in England
.png (22.1 kB) .xlsx (20.6 kB)
Figure 7b: All winter months had fewer mean daily deaths than the five-year average in Wales
Mean number of daily deaths each month (based on death occurrences) and mean monthly temperatures, August 2018 to July 2019

Source: Office for National Statistics, The Met Office
Notes:
- Daily deaths data is based on deaths occurring in each month. Numbers of deaths from January to July 2019 are provisional and have been adjusted to take account of late registrations.
- Five-year averages for each month are calculated using data from the previous five years excluding the current year.
- Figures for Wales exclude deaths of non-residents.
Download this image Figure 7b: All winter months had fewer mean daily deaths than the five-year average in Wales
.png (20.5 kB) .xlsx (21.2 kB)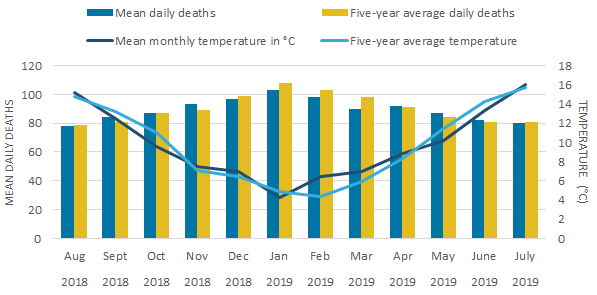
8. Excess winter mortality across regions
In 2018 to 2019, the highest regional excess winter mortality (EWM) index was in Yorkshire and The Humber with 16.5%, followed by the North East (15.4%), the East Midlands (15.3%) and the East of England (15.2%). In all these regions EWM indexes were statistically significantly higher than the England average (14.2%). In comparison, the North West (13.2%), Wales (13.1%) and the West Midlands (13.0) were statistically significantly lower.
Overall, the EWM index in 2018 to 2019 for all English regions and Wales were statistically significantly lower than the previous two periods. The EWM index for four English regions and Wales were also statistically significantly lower than all periods since 2013 to 2014.
Figure 8: Yorkshire and The Humber have the highest excess winter mortality index in 2018 to 2019
Excess winter mortality index (based on death occurrences) for regions of England and in Wales, winter period 2018 to 2019
Embed code
Notes:
- Figures are based on deaths occurring in each period (August through to the following July). Numbers of deaths from January to July 2019 are provisional and have been adjusted to take account of late registrations.
- The excess winter mortality (EWM) index is calculated as excess winter deaths (EWD) divided by the average non-winter deaths, expressed as a percentage.
- Figures for England, English regions and Wales exclude deaths of non-residents.
- Figures are based on boundaries as of May 2019.
9. Excess winter mortality data
Excess winter mortality in England and Wales
Dataset| Released 27 November 2019
Annual figures of excess winter mortality in England and Wales by sex, age group, cause, region and lower geographical areas.
10. Glossary
Excess winter deaths (EWD)
The number of EWD is a statistical measure of the increase in mortality during winter months (December to March) compared with non-winter months (preceding August to November and following April to July).
Excess winter mortality (EWM) index
The EWM index is calculated so that comparisons can be made between sexes, age groups and geographical areas, and is calculated as the number of excess winter deaths (EWD) divided by the average non-winter deaths, expressed as a percentage.
Statistical significance
The term “significant” refers to statistically significant changes or differences. Significance has been determined using the 95% confidence intervals, where instances of non-overlapping confidence intervals between figures indicate the difference is unlikely to have arisen from random fluctuation.
Back to table of contents11. Measuring the data
In common with other countries, more people die in the winter than in the summer in England and Wales. This statistical bulletin presents provisional figures for excess winter deaths (EWD) and the excess winter mortality (EWM) index in England and Wales for the winter period 2018 to 2019 and final figures for the winter period 2017 to 2018. Historical trends from winter of 1950 to 1951 onwards are also provided for comparison. Provisional figures are presented by sex, age, cause of death and region; final figures additionally include breakdowns by lower geographical areas which are available in the dataset. Information on temperature and influenza incidence is also given to add context to the mortality figures.
Figures for England and Wales are calculated using death occurrence data held by the Office for National Statistics (ONS). Mortality statistics are compiled from information supplied when deaths are certified and registered as part of civil registration.
The Excess winter mortality Quality and Methodology Information (QMI) report contains important information on:
- the strengths and limitations of the data
- the uses and users of the data
- how the output was created
- the quality of the output including the accuracy of the data
The User guide to mortality statistics provides further information on the collection, production and quality of the underlying mortality data.
Method for calculating excess winter deaths (EWD)
Johnson and Griffiths (2003) (PDF, 97.4KB) investigated seasonal mortality and reported that historically, above average mortality is typically seen between December and March in England and Wales. Therefore, our standard method defines the winter period as December to March and compares the number of deaths that occurred in this winter period with the average number of deaths occurring in the preceding August to November and the following April to July. The calculation used is:
This produces the number of EWD. Provisional EWD figures are produced for the most recent winter using special estimation methods and so are rounded to the nearest 100 deaths. Final EWD figures for the previous winter are rounded to the nearest 10 deaths.
Method for calculating excess winter mortality (EWM) index
The EWM index is calculated so that comparisons can be made between sexes, age groups and regions and is calculated as the number of EWD divided by the average non-winter deaths:
The EWM index is presented with 95% confidence intervals, which are calculated as:
The EWM index shows the percentage of extra deaths that occurred in the winter and is reported to 1 decimal place.
Early access for quality assurance purposes
We provide early access for quality assurance purposes to a small number of analysts within Public Health England (PHE) and Public Health Wales (PHW). The analysts are not permitted to share the findings or the report wider in their organisations. The report is provided for the analysts to provide technical epidemiological comment on our findings around influenza and weather. However, the ONS independently produces these statistics, including determining the focus, content, commentary, illustration and interpretation of these measures presented in bulletins.
Back to table of contents12. Strengths and limitations
The strengths of the excess winter mortality bulletin include the following:
provisional data are used to enable timely analysis to be completed to monitor excess winter mortality trends
mortality data give complete population coverage and ensure the estimates are of high precision, and representative of the underlying population at risk
The limitations of the excess winter mortality bulletin include the following:
provisional death occurrences data are used to generate the data which means data is always somewhat incomplete because of registration delays
because of rounding of excess winter deaths, there can be differences between totals and their breakdowns