1. Main points
UK labour productivity grew by 0.7% in Quarter 4 (Oct to Dec) 2017, the second consecutive quarter in which productivity growth has exceeded the pre-downturn average of 0.5% per quarter, although output per worker grew by just 0.1% on the quarter.
Revised estimates of labour productivity for the G7 economies suggest that the UK continues to lag other major economies, with labour productivity around 16.3% below the average for the other G7 economies in 2016.
Analysis using new labour productivity data on an industry-by-region basis suggests that London’s financial industry and several regional manufacturing industries account for much of the recent slowdown of productivity growth, relative to the five years prior to the economic downturn.
The productivity of UK public services increased by 0.4% in Quarter 4 2017, only partly offsetting falls in productivity in the first half of 2017, resulting in the first annual fall in public service productivity since 2009.
We have published experimental quarterly estimates of multi-factor productivity (MFP) - the first such estimates produced by a National Statistical Institute - which suggest that part of the slowdown in annual labour productivity growth at the start of 2017 was a result of slowing MFP and changes in the composition of the labour force over this period.
New data on the management practices of businesses in Great Britain – produced in a collaborative effort between the Economic Statistics Centre of Excellence and the Office for National Statistics (ONS) – suggest a strong positive association between management practices and firm-level productivity.
2. Labour productivity
Labour productivity grew by 0.7% in Quarter 4 (Oct to Dec) 2017 – the second consecutive quarter in which productivity growth has exceeded the pre-downturn average of 0.5% – driven largely by a fall in average hours. However, comparing to the same quarter a year earlier, output per hour worked has grown by around 1.0% – well below the pre-downturn average of around 2.0% per year. On an output per worker basis, labour productivity was just 0.1% higher on the quarter and 0.4% higher than the same period in 2016. Both measures remain well below the levels they would have achieved had productivity growth continued at the pre-downturn rate (Figure 1).
Figure 1: Output per hour and output per worker
UK, whole economy, chained volume measure, seasonally adjusted, Quarter 1 (Jan to Mar) 1994 to Quarter 4 (Oct to Dec) 2017
Source: Office for National Statistics
Notes:
- Q1 equals Quarter 1 (January to March), Q2 equals Quarter 2 (April to June), Q3 equals Quarter 3 (July to September), Q4 equals Quarter 4 (October to December).
Download this chart Figure 1: Output per hour and output per worker
Image .csv .xlsWhile the slowdown in productivity growth evident in Figure 1 is not unique to the UK, it does appear to have been more pronounced in the UK than elsewhere in the G7. Alongside these headline labour productivity statistics, we have produced revised estimates of labour productivity in the G7 economies to 2016.
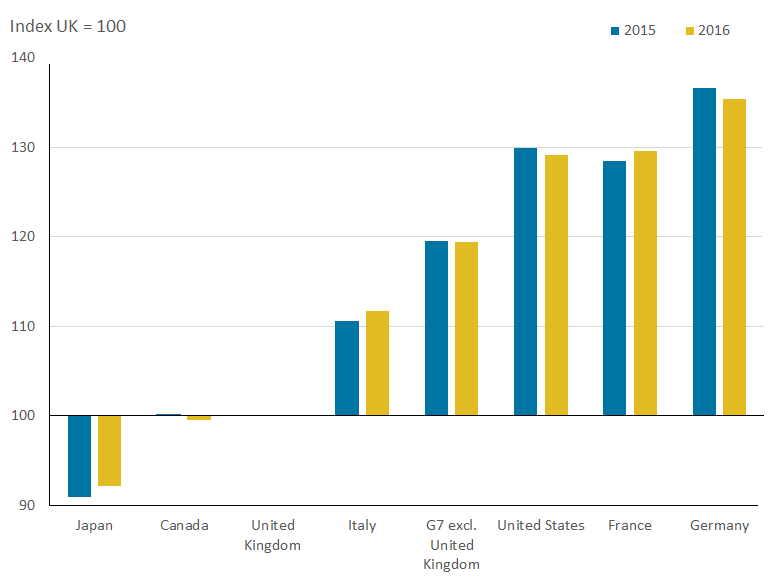
These estimates – calculated using data on gross domestic product (GDP), labour input and purchasing power parity (PPP) exchange rates from the Organisation for Economic Co-operation and Development (OECD) – confirm that labour productivity in the UK economy was around 16.3% below the average level in the other G7 economies in 2016, little changed from either the first estimates of these data or from the previous year (Figure 2). The gap between the UK and the US was around 22.6% in 2016 – down from 23.1% a year earlier – and the gap between the UK and Germany also closed over this period – falling from 26.8% a year earlier to 26.2% in 2016. However, the UK’s gap to both France and Italy widened over the same period, although the marginal size of all these changes did little to reduce a gap that remains strikingly wide. On an output per worker basis, labour productivity in the UK was around 16.6% below the average for the rest of the G7: a slightly narrower gap than a year earlier.
Figure 2: Gross domestic product per hour worked, G7 economies, 2015 and 2016
UK=100
Source: Organisation for Economic Co-operation and Development, Eurostat and Office for National Statistics calculations
Download this image Figure 2: Gross domestic product per hour worked, G7 economies, 2015 and 2016
.png (10.8 kB) .xls (26.1 kB)
These data also suggest that the size of the UK’s “productivity puzzle” is larger than elsewhere in the G7. Figure 3 shows the path of labour productivity in real terms for both the UK and the rest of the G7 economies, indexed to their respective levels in 2007. These data suggest that over the pre-downturn period the UK experienced relatively strong output per hour growth. However, they also suggest that UK labour productivity fell further during the economic downturn and has since grown more slowly than the rest of the G7. As a result of both these trends, the size of the UK’s productivity gap – the difference between the path predicted by the pre-downturn trend and the actual performance – is considerably larger than for the rest of the G7 economies.
Figure 3: Constant price gross domestic product per hour worked
Actual and projections, G7 economies, 2015 and 2016
Source: Organisation for Economic Co-operation and Development, Eurostat and Office for National Statistics calculations
Download this chart Figure 3: Constant price gross domestic product per hour worked
Image .csv .xlsTo improve our understanding of the UK’s recent productivity performance, ONS has been developing a range of new datasets and analysis, which shed light on the movements in these aggregate trends. In April 2017 we published experimental estimates of quarterly regional labour input on a consistent basis with equivalent UK-level metrics. In July 2017 we published new, more detailed estimates of labour productivity by industry, and the first industry-by-region labour productivity estimates for the UK in current price terms; while in February 2018 we updated our estimates of regional productivity to include the latest data from the regional accounts – including the first constant price regional productivity data.
Extending this run of developments, we have published updated experimental estimates of industry-by-region labour productivity – including the first constant price output per hour worked estimates for industry-by-region combinations – as part of this release. These data draw on gross value added (GVA) information published as part of the regional accounts and labour metrics calculated using both the Labour Force Survey (LFS) and the Annual Survey of Hours and Earnings (ASHE). They enable updated comparisons of the level of labour productivity in different industries in different parts of the UK, and permit an assessment of differences in productivity growth rates for those same industry-by-region combinations. These data are now available for a breakdown of 16 industries, for the 12 regions of the UK, covering the period 1997 to 2016: amounting to 192 different labour productivity series.
Back to table of contents3. Contributions to labour productivity growth
To demonstrate one potential use for these new additions to the Office for National Statistics’ (ONS’s) labour productivity statistics, we have also developed a set of analyses to enable users to better understand changes in productivity growth over the course of the economic downturn. Building on the publication of industry-level contributions to labour productivity growth in our February 2018 UK productivity research summary, we have developed a suite of alternative decompositions that focus on different parts of the UK economy. These decompositions are similar in nature to those undertaken by other researchers in the field – notably Tenreyro (2018).
While all of these decompositions derive from a similar approach – based on the Generalised Exactly Additive Decomposition (GEAD), details of which are available in the Appendix – the results that different users generate depend on the selection of time periods and the parts of the UK economy admitted to the analysis. The GEAD approach divides aggregate productivity growth into three components:
the portion of productivity growth that is attributable to growth within specific industries: that is, the contribution of productivity growth within manufacturing, for instance, to aggregate productivity growth
the portion of productivity growth that is accounted for by the changing relative sizes of industries – widely known as the “re-allocation effect”; this captures, for instance, how changes in the amount of labour employed in, or the relative prices of, the manufacturing industries affect overall productivity growth
an interaction term, which captures the combined effect of both changes in industry size and productivity
Using this framework, the contribution of individual industries to overall productivity growth – as well as the “re-allocation” of labour and movements in relative prices – can be calculated for whole economy labour productivity growth, or for the growth of any sub-set of industries. In February 2018, we published the contributions of all industries to whole economy labour productivity growth – highlighting a marked decline in the contribution of these “re-allocation” forces. In this publication we present two alternative decompositions: one that focuses on a measure of labour productivity excluding imputed rental1, and an alternative that decomposes whole economy productivity growth into that due to different industry-by-region combinations.
The first of these decompositions – which excludes imputed rentals – is a standard extension to the analysis of labour productivity. The gross value added (GVA) captured in imputed rentals measures the amount owner-occupied households “pay” themselves for the services provided by the property they own. While it is an integral part of the national accounts and critical for the international comparability of gross domestic product (GDP), as official statistics do not currently collate data on the labour input that produces this output, it can be difficult to interpret when analysing labour productivity. Imputed rentals have a particularly large, positive impact on the apparent productivity of the real estate industry – to which their value accrues. Although excluding imputed rentals from this analysis means that its results differ from ONS’s headline labour productivity statistics, this breakdown provides further, contextual information about the performance of the UK economy.
The results of this alternative decomposition differ notably from those for the whole economy – pointing to a more complex underlying picture of the UK economy. Figure 4 replicates analysis from the February 2018 UK productivity research summary, using low-level industry data to estimate the re-allocation effect on five-year rolling labour productivity growth. As previously, the majority of the slowdown in productivity growth is a consequence of within-industry changes in labour productivity growth. This is shown by the sharply narrowing gap between overall market sector productivity growth and the contribution of the re-allocation effect over the post-downturn period. However, in contrast to the previous analysis, the re-allocation effect is now negative throughout the 2002 to 2017 period.
Much of this change is driven by a shift in the “labour share” component of the re-allocation effect, which moves from pushing up on labour productivity to holding it back. This indicates that the relative weight of labour in relatively less productive industries has been increasing over this period, once imputed rentals have been set aside. This shift also implies that – on this measure – the allocation effect has less of an impact on the slowdown of labour productivity on a rolling five-year basis, although it remains among the largest effects in contribution terms compared with the full set of within-industry effects in recent quarters. ONS will continue to present analysis of these effects in future releases to better understand this finding.
Figure 4: Five-year output per hour growth and the allocation effect of labour, prices and the interaction between labour and prices
UK, whole economy, chained volume measure, seasonally adjusted, Quarter 1 (Jan to Mar) 1994 to Quarter 4 (Oct to Dec) 2017
Source: Office for National Statistics
Notes:
- Q1 equals Quarter 1 (January to March), Q2 equals Quarter 2 (April to June), Q3 equals Quarter 3 (July to September), Q4 equals Quarter 4 (October to December).
Download this chart Figure 4: Five-year output per hour growth and the allocation effect of labour, prices and the interaction between labour and prices
Image .csv .xlsThe second analysis that we have developed examines the contributions of different regional industries to overall UK productivity growth. Using the newly published, constant price output per hour data on an industry-by-region basis and the same GEAD framework set out previously, this analysis points to a particularly large role for London’s financial and insurance industries, and a range of regional manufacturing industries in explaining the slowdown in productivity growth in recent years. While care must be taken when interpreting the results of this decomposition – particularly as they vary with the granularity of the data that are used in the decomposition – the results are instructive and shed considerable light on the industries and regions driving the UK’s recent economic slowdown.
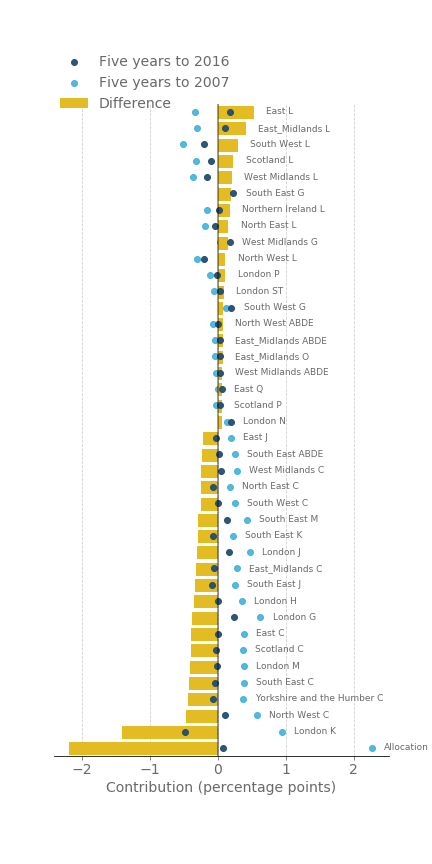
Figure 5 shows the contribution to aggregate productivity growth of industry and region combinations in the five years to 2007 and the five years to 2016, for the 20 effects contributing the most and least to UK productivity growth. The contributions of each industry in each region in each period are shown by the blue points in this schema and reflect the contribution of “within industry-region” productivity growth to the UK’s aggregate labour productivity growth. The change in these contributions – which can be seen in the bars – indicate whether a regional industry has pushed up on UK productivity growth in the past five years compared with the five years leading up to the economic downturn. Finally, these “within industry-region” effects are accompanied by a “between industry-region effect”, which is the equivalent of the “re-allocation” effect shown in Figure 4 previously. The interpretation of this latter effect is the extent to which movements in labour and relative prices between industries and regions have supported aggregate productivity growth in recent years.
Figure 5: Contributions to five-year output per hour growth from the 20 highest and 20 lowest contributors
UK, 2007 and 2016
Source: Office for National Statistics
Notes:
- Extra Regio gross value added has been removed from the data and so the whole economy aggregate labour productivity growth figures will be slightly different to the main labour productivity dataset.
- Industry key:
ABDE: Non Manufacturing Production
C: Manufacturing
G: Wholesale And Retail Trade; Repair Of Motor Vehicles And Motorcycles
H: Transportation And Storage
J: Information And Communication
K: Financial And Insurance Activities
L: Real Estate Activities
M: Professional, Scientific And Technical Activities
N: Administrative And Support Service Activities
O: Public Administration And Defence; Compulsory Social Security
P: Education
Q: Human Health And Social Work Activities
ST: Other Service Activities
Download this image Figure 5: Contributions to five-year output per hour growth from the 20 highest and 20 lowest contributors
.png (58.1 kB) .xls (35.8 kB)
This analysis suggests that the slowdown in productivity growth in several industry-region combinations plays an important role in explaining the slowdown in the UK’s aggregate performance in recent years. In particular, London’s financial services industry (“London K”) and several regional manufacturing industries (C) made a much-reduced contribution to productivity growth in the five years to 2016 than over the five years to 2007. Services industries in London and the South East are also prevalent among the regional industries whose contribution has fallen the most. By contrast – and reflecting the inclusion of imputed rentals – the regional industries whose contributions have increased the most over this time period include the real estate industry (L) in several regions, as well as the wholesale and retail (G) and non-manufacturing production industries (ABDE) in the north and midlands of England.
Notes for: Contributions to labour productivity growth
- To be precise, we have excluded the gross value added, which accrues to the real estate industry as imputed rentals. This differs from a number of other recent decompositions, which exclude the whole real estate industry. The analysis here has also been updated to reflect the most recent vintage of labour productivity data, and consequently differs marginally from those published by ONS recently.
4. Public service productivity
Alongside these estimates of labour productivity growth for the whole economy, we have also published updated experimental estimates of quarterly and annual public service productivity as part of this release. These measures – which differ from measures of labour productivity by taking account of changes in a range of factor inputs, including labour and capital – show that in Quarter 4 (Oct to Dec) 2017, productivity for the public services increased by 0.4%. This growth follows on from growth of 0.6% in the previous quarter and was the result of a 0.4% rise in output, while total public service inputs remained flat over the quarter.
Despite this increase in the final quarter of 2017, public service productivity across the year is estimated to have contracted by 0.2%, as gains made in the most recent quarters did not fully offset contractions experienced earlier in the year (negative 0.2% in Quarter 1 (Jan to Mar) and negative 0.7% in Quarter 2 (Apr to June) 2017). This marks the first contraction in annual total public service productivity since 2009. Decomposing this into the underlying changes in inputs and output, the contraction in public service productivity was driven by growth of 0.3% in inputs over the year, whilst output grew by only 0.1% in 2017. These results – which are experimental – should be treated with caution as they do not include updated quality adjustment information, which only becomes available with a lag.
Figure 6 shows the growth in public service productivity since 1997, combining the latest experimental quarterly estimates – covering Quarter 1 (Jan to Mar) 2016 to Quarter 4 (Oct to Dec) 2017 – with annual estimates for between 1997 and 2015, taken from the Public service productivity estimates: total public service, UK: 2015 release. It suggests that, while maintaining a general upwards trend, growth in public service productivity has experienced some volatility.
Consequently, UK total public service productivity was 3.4% higher in 2017 than in 2010 (equivalent to average annual growth of 0.5%). This was driven by growth in total public service output, which rose by 5.0% over the same period (average annual growth of 0.7%). Inputs, on the other hand, have experienced somewhat slower growth, growing by 1.6% (average annual growth of 0.2%) between 2010 and 2017.
Figure 6: Growth in total UK public service inputs, output and productivity
1997 to Quarter 4 (Oct to Dec) 2017
Source: Office for National Statistics
Notes:
- Estimates from 1997 to 2015 are based on the existing annual series.
- Estimates from Quarter 1 (Jane to Mar) 2016 to Quarter 4 (Oct to Dec) 2017 are based on the experimental quarterly total public service productivity series.
- Estimates for Quarter 1 2016 reflect the growth rate for inputs and output between annualised quarterly estimates for 2015 and Quarter 1 2016
- Estimates of inputs and output for the experimental period are directly seasonally adjusted.
- The greyed-out area references periods were estimates are based on experimental methodology.
Download this chart Figure 6: Growth in total UK public service inputs, output and productivity
Image .csv .xls5. Multi-factor productivity
Among the most striking findings of the recent ONS-commissioned review of other National Statistical Institutes’ (NSI’s) productivity publications was the relative weakness of Office for National Statistics’ (ONS’s) multi-factor productivity (MFP) statistics. Estimates of MFP augment labour productivity estimates by taking account of movements in productive capital (such as machinery and software) and compositional developments in the labour market (for example, an increase in the number of workers with university degrees) as well as hours worked. They consequently provide a more holistic measure of productivity than traditional labour productivity metrics. We have historically published these on an annual basis, around 15 months after the period to which they relate.
In response to the review of international best practice and a main finding of the Bean Review, we have published the first experimental estimates of quarterly multi-factor productivity for the UK market sector and component industries. As far as ONS is aware, these are the only quarterly MFP statistics published by any NSI in the world. User views on the potential uses and usefulness of these statistics are welcome and should be directed to productivity@ons.gov.uk.
These more detailed experimental estimates draw on the recently published quarterly Volume Index of Capital Services (VICS), which have been marginally improved since the latest release through seasonal adjustment. Several small improvements have also been made to quality adjusted labour input (QALI) including the division of hours worked between the market and non-market sector and the calculation of pay weights.
The first results of this development work are shown in Figure 7, which provides a quarterly breakdown of annual growth in market sector output per hour, divided into contributions due to labour composition and capital intensity, and the residual MFP component. Although these experimental statistics should not be over-interpreted, it suggests that the slowdown in market sector labour productivity in the first two quarters of 2017 may be attributable to a slowing in MFP and negative contributions from labour composition. This pattern, as well as the comparative weakness of capital intensity, is reflected across a number of component industries, as shown in the reference table published alongside the quarterly MFP release.
Figure 7: Decomposition of year-on-year growth of output per hour worked, Q1 (Jan to Mar) 2008 to Q2 (Apr to Jun) 2017
UK, market sector
Source: Office for National Statistics
Notes:
- Labour productivity growth is the year-on-year growth in market sector GVA per hour worked expressed as changes in natural logarithms. Columns show contributions of components, calculated by weighting changes in each component by its factor income share. MFP is calculated by residual
Download this chart Figure 7: Decomposition of year-on-year growth of output per hour worked, Q1 (Jan to Mar) 2008 to Q2 (Apr to Jun) 2017
Image .csv .xlsThe weakness of capital deepening, which is evident through much of the post-downturn era, reflects both business decisions about investment and their hiring practices. Figure 8 summarises these movements by showing quarterly labour-capital ratios for the UK market sector and for two component industries: manufacturing, and information and communication. An increase (decrease) in these indices implies that labour input is growing more (less) rapidly than capital inputs, or falling more (less) slowly. These data appear to show a turning point in 2009: up until 2009 the labour-capital ratio trended downwards, as firms substituted capital for labour (alternatively, capital intensity trended upwards), albeit with some cyclical variation. This trend has reversed since 2009, especially in information and communication, as employment has risen more than services from the capital stock.
Figure 8: Quarterly labour-capital ratios, Q1 (Jan to Mar) 1994 to Q2 (Apr to Jun) 2017
UK, market sector and selected industries
Source: Office for National Statistics
Notes:
- Q1 equals Quarter 1 (January to March), Q2 equals Quarter 2 (April to June), Q3 equals Quarter 3 (July to September), Q4 equals Quarter 4 (October to December).
Download this chart Figure 8: Quarterly labour-capital ratios, Q1 (Jan to Mar) 1994 to Q2 (Apr to Jun) 2017
Image .csv .xlsWhile these data provide an important step forward in our development of the ONS growth accounting suite, we are planning a range of further innovations over the course of 2018. In particular, we are planning to reduce the length of time to produce MFP estimates from approximately nine months to just over three months. This would bring our MFP production time scales into line with labour productivity and be among the most timely estimates of MFP published by leading NSIs.
In addition to increasing timeliness of our MFP estimates, we are working on further expanding the industry detail that we produce. VICS estimates are now produced quarterly for 57 industries and to increase the industry granularity of MFP, it is necessary to expand the industry detail of QALI. QALI breaks down labour input into hours worked and labour composition; with the latter capturing differences in the quality of labour. While estimates of total hours worked for more detailed industries are now available from the labour productivity system, the estimation of changes in labour composition at this level of granularity is difficult. This challenge reflects the fact that QALI breaks down each industry into 36 categories of workers (sex (two), age (three) education (six)). Using direct estimates from the Labour Force Survey (LFS) for more detailed industry groups, for 36 categories of workers results in considerable variance in estimates of labour composition. To produce more granular estimates of labour composition it will be necessary to either reduce the number of categories of workers for some industries, or develop a new approach to estimating hours worked for different categories of workers. These developments will form a large part of our work on ONS’s Growth Accounting suite in the coming months.
Back to table of contents6. Management practices
The labour productivity and international comparisons of productivity releases published alongside this release highlight the persistently low levels of productivity growth in the UK – both in comparison with its pre-downturn trend and with other developed nations. In recent times, the role of management practices in explaining this productivity gap has received growing attention in the academic and empirical literature. In this productivity release, we present the initial results of the Management and Expectations Survey (MES), a collaborative work by the Economic Statistics Centre of Excellence (ESCoE) and the Office for National Statistics, aimed at collecting information on the prevalence of structured management practices within British businesses1.
The MES was a voluntary postal survey conducted on 25,000 businesses with employment of 10 or more, in the production and services industries in Great Britain. The sample was randomly selected as a sub-sample of the 2016 Annual Business Survey (ABS), making this one of the first broadly representative management surveys in the UK. Using 12 multiple choice questions covering a range of management practices, we derive a management score for each firm – within a range of zero and one (zero being the least structured practice) – as the average of their scores across all questions. We linked this management data with the Annual Business Survey (ABS) to analyse relationships between management scores and levels of labour productivity.
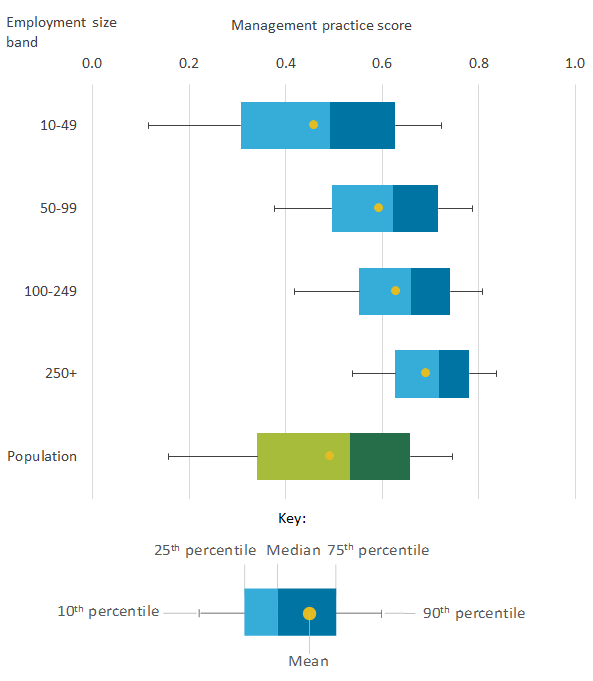
Analysing the management practice scores, we found variations across different business characteristics including size, industry and ownership type. Figure 9 shows how the mean management score (yellow dots) varies across the employment size bands. We observe the prevalence of structured management practices to be higher as we move across the size bands, with the highest average score among the largest businesses (250 or more employment), with an average score of 0.69, and the lowest score among small businesses (10 to 49 employment), scoring on average 0.46. Small businesses, however, account for the majority of our business population (80%) and are consequently closest to the population results.
Figure 9 also shows relative management scores for firms in the 10th and 90th percentiles (the lines), and the inter-quartile range – the difference between the 25th and 50th percentiles (light shaded bar), and between the 50th and 75th percentiles (dark shaded bar) – for each size band. Compared with the other size bands, small firms (10 to 49 employment) were found to have the widest range of scores between the 10th and 90th percentiles and the interquartile range, indicating a wider range of outcomes among firms in this size band. The differences in management scores across the size bands are found to be larger at lower percentiles than higher percentiles, with the scores at the 90th percentile more similar across the size bands than at the 10th percentile.
Figure 9: Mean and percentile distribution of management practice scores by size
Great Britain, 2016
Source: Office for National Statistics
Notes:
- Key: Line: 10th and 90th percentiles, Light shaded box: Difference between 50th and 25th percentiles, Dark shaded box: Difference between 75th and 50th percentiles, Dots: mean score.
- Our population of interest covers businesses in production and services industries with employment of at least 10, in Great Britain.
- The MES sample excludes firms in section A (Agriculture, forestry and fishing) and section K (Financial and insurance activities), and results are weighted to reflect the population of firms.
Download this image Figure 9: Mean and percentile distribution of management practice scores by size
.png (17.4 kB) .xls (33.3 kB)
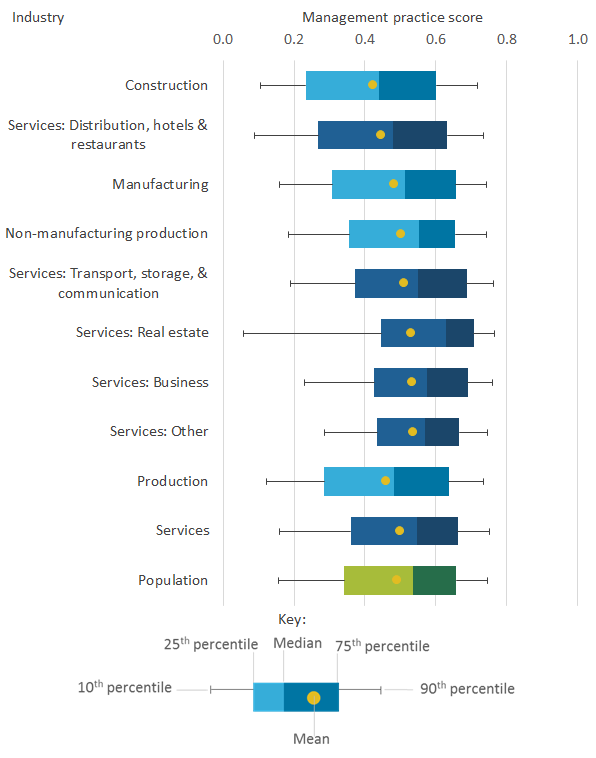
One of the distinct aspects of the MES is its broad industry coverage – including the production industries and most services industries – while most other similar surveys focus on manufacturing firms. At the broad industry level, average management scores were higher in services (0.50) than production industries (0.46) (Figure 10). Within these broad categories, the highest average management scores were in services industries, comprising Other services (0.54), with Business services and Real estate services each scoring 0.53.
Conversely, the three lowest scores comprised Manufacturing (0.48), Distribution, hotels and restaurants (0.45) and Construction (0.42). Similar to the percentile distribution in Figure 9, across the industry groups, we found more similar scores at the 90th percentile than at the 10th percentile. This indicates the presence of firms with comparably high levels of structured practices across all industries.
Figure 10: Percentile distribution of management scores by industry groups
Great Britain, 2016
Source: Office for National Statistics
Notes:
Key: Line: 10th and 90th percentiles, Light shaded box: Difference between 50th and 25th percentiles, Dark shaded box: Difference between 75th and 50th percentiles, Dots: mean score.
Our population of interest covers businesses in production and services industries with employment of at least 10, in Great Britain.
The MES sample excludes firms in section A (Agriculture, forestry and fishing) and section K (Financial and insurance activities), and results are weighted to reflect the population of firms.
Key to industry grouping: Population equals Production and Services; Production equals Non-manufacturing production, Manufacturing and Construction; Services equals Distribution, hotels and restaurants, Transport, storage and communication, Business services, Real estate and Other services; Non-manufacturing production equals B (Mining and quarrying), D (Electricity, gas, steam and air conditioning supply) and E (Water supply; Sewerage, waste management and remediation activities); Manufacturing equals C (Manufacturing); Construction equals Section F (Construction); Services: Distribution, hotels and restaurants equals Sections G (Wholesale and retail trade; Repair of motor vehicles and motorcycles) and I (Accommodation and food service activities); Services: Transport, storage and communication equals Sections H (Transportation and storage) and J (Information and communication); Services: Business equals Section M (Professional, scientific and technical activities) and Section N (Administrative and support service activities); Services: Real estate equals Section L (Real estate); and Services: Other equals Sections P (Education), Q (Human health and social work activities), R (Arts, entertainment and recreation) and S (Other service activities).
Download this image Figure 10: Percentile distribution of management scores by industry groups
.png (30.2 kB) .xls (37.9 kB)
One of the primary aims of the survey is to analyse the relationship between businesses’ management practices and their productivity performance. Figure 11 shows the average level of labour productivity for firms in each decile of management practice score indexed to the labour productivity of businesses in the first decile. We found a positive correlation between higher management practice scores and higher levels of labour productivity, with average productivity of firms in the 10th decile almost three times that of those in the first decile.
In the accompanying article we also conduct conditional analysis of labour productivity, controlling for management practice score and firm characteristics including size, ownership, age, employee skill levels, as well as industry and location. We found a statistically significant relationship between management practice scores and labour productivity, with a 0.1 increase in our derived management score associated with a 9.6% increase in productivity. This would translate to a 19% increase in productivity if the average management score increases from the 25th percentile (0.34) to the median (0.53), and a 12% increase in productivity moving from the median to the 75th percentile (0.66).
Our analysis shows that the relationship between management practices and productivity established in the literature is consistent even within a broader population of firms in both production and services industries. Further work in this area includes exploring the causal “drivers” of variations in structured management practices (see What drives differences in management? (PDF, 678.9KB)) and the impact of management practices in explaining within-country and cross-country total factor productivity (TFP) gaps.
Figure 11: Labour productivity by management score decile
Great Britain, 2016
Source: Office for National Statistics
Notes:
- The table shows GVA per worker by management score decile, normalised to 100 in first decile
- Our population of interest covers businesses in production and services industries with employment of at least 10, in Great Britain.
- The MES sample excludes firms in section A (Agriculture, forestry and fishing) and section K (Financial and insurance activities), and results are weighted to reflect the population of firms.
Download this chart Figure 11: Labour productivity by management score decile
Image .csv .xlsNotes for: Management practices
- This follows a pilot survey, the Management Practices Survey (MPS) conducted by ONS on British manufacturing businesses in 2016.
8. Appendix: The Generalised Exactly Additive Decomposition (GEAD)
To decompose whole economy output per hour growth we use the Generalised Exactly Additive Decomposition (GEAD) proposed by Tang and Wang (2004)1, which states that aggregate labour productivity growth can be decomposed into three components: direct contributions resulting from changes in productivity within industries; a relative size contribution of different industries; and the interaction of the first two capturing the combined effect of growth of productivity and size change2.
To be precise, let the whole economy aggregated productivity growth g(X_t ) over a period be measured as chained volume gross value added (GVA) per hour worked (H). GEAD then takes the following form, where i and t index industries and time respectively:
The first term on the right-hand side of the equation is the direct productivity growth effect. It represents the contribution to whole economy productivity growth from productivity growth within each industry – excluding the effects of changing labour shares or relative output prices. Arithmetically, it is the sum of the weighted industry labour productivity growth rates, where the fixed weights wyi,t-1 equal an industry’s share of current price GVA in the period t-1. Its sign reflects the sign of the industry productivity growth rate while its magnitude is determined by the extent of the change in the industry productivity and the size of the industry share of total nominal output at the beginning of the period.
The second term is the relative size effect and represents the effect of a change in the labour input shares of industries or their relative output prices – which can be interpreted as a change in the size of an industry. It is measured as the weighted sum of the changes in relative size si,t where si,t=H i,t / H t *Pi,t / P t. (Hi,t / Ht) is the labour input share while (Pi,t / Pt) is the relative output price of an industry – that is, the price deflator of an industry divided by the price deflator of the whole economy. This is then multiplied by wxi,t-1, an industry’s relative real labour productivity at the beginning of the period t-1.
A positive size effect indicates that an industry share of total hours worked and/or its relative output price increased over the observation period. A negative effect indicates that one of the two components has decreased. Summing the effects across industries indicates whether prices and labour together shifted in favour of industries with relatively high or low productivity levels. If the effect is positive, there was a shift towards higher productivity industries. If the effect is negative, there was a shift toward lower productivity industries.
Finally, the interaction term captures the additional reallocation through labour or prices to high/low productivity growth industries. It is calculated as the relative real productivity in period t-1 wxi,t-1, the change in an industry’s size ∆si,t, and labour productivity growth within an industry g(Xi,t). A positive effect indicates that whole economy productivity growth was in part due to labour and/or prices causing a general shift toward higher productivity growth industries.
Notes for: Appendix: The Generalised Exactly Additive Decomposition (GEAD)
Tang J and Wang W (2004), ‘Sources of aggregate labour productivity growth in Canada and the United States’, Canadian Journal of Economics, Volume 37, Number 2.
This annex is derived from the work of Giuliana Battisti for ONS and draws from previous work from Peter Gambrill and the Economic Growth Analysis team at the Department for Business, Energy and Industrial Strategy.