1. Main points
UK labour productivity in Quarter 2 (Apr to June) 2018, as measured by output per hour, grew by 1.4% compared with the same quarter a year ago; this continues to perform below the pre-downturn average of 2%, continuing the “productivity puzzle”.
Compared with Quarter 1 (Jan to Mar) 2018, UK labour productivity increased by 0.5% in Quarter 2 2018 due to a fall in the number of actual hours worked and stronger output growth, however, this series is naturally more volatile than comparing over a year.
Today we commence routine quarterly publication of estimates of multi-factor productivity (MFP) on the same timetable as labour productivity, in line with the world’s leading National Statistical Institutes.
The contribution of MFP to market sector labour productivity growth in the year to Quarter 2 2018 was 0.8%, while capital deepening (0.8%) and labour composition (0.1%) also improved.
Public service productivity in Quarter 2 2018 decreased by 0.8% compared with the same quarter a year ago.
Comparing with the previous quarter, total public service productivity decreased by 2.0%, driven primarily by an increase in inputs of 2.1%, while output was broadly unchanged.
New firm-level analysis using a linked e-commerce Annual Business Survey (ABS) dataset suggests there is a productivity premium associated with the use by businesses of technologies for e-commerce or business organisation activities, and that these vary across industries.
2. Understanding the different measures
In delivering quarterly multi-factor productivity alongside labour productivity and public service productivity, a main issue for users is how these different estimates relate to one another, and importantly where they differ.
The economy, and thus productivity measures, can be sub-divided into “market sector” and “non-market sector” components. The market sector encompasses all activity where output is sold for the market price – this is primarily the private sector, but also public corporations which, despite being publicly owned, operate for profit. The market sector produces around 80% of total output in the economy, while the non-market sector (primarily government, but also non-profit institutions, such as charities) makes up the remaining 20%.
Experimental multi-factor productivity estimates are only calculated for the market sector due to challenges in measuring inputs and output in the non-market sector. Growth accounting de-composes the growth in market sector output per hour into that attributable to changes in: labour composition (the skills of the workforce), capital deepening (capital per hour worked) and multi-factor productivity (a residual, encompassing spillovers, and improvements in technology).
Table 1 shows the growth in labour productivity in Quarter 2 (Apr to June) 2018 on the same quarter a year ago, and decomposes it into the market1 and non-market sector components.
| Sector | Share of the economy | UK labour productivity in Quarter 2 (Apr to June) 2018 (quarter on a year ago) |
|---|---|---|
| Whole economy | 100% | 1.4% |
| Market sector | c80% | 1.9% |
| Non-market sector | c20% | -0.6% |
Download this table Table 1: UK labour productivity by sector of the economy
.xls .csvHowever, public service productivity estimates, as published alongside this release, are different to those for the non-market sector in Table 1. Public service productivity in Quarter 2 2018 decreased by 0.8% compared with the same quarter a year ago; this is different from the non-market sector, which we can infer declined by approximately 0.6% over the same period. Can both be right?
There are a number of main differences between public service productivity and the productivity of the non-market sector that explain this, which are detailed in an information note (PDF, 434KB) and are summarised in the rest of this section.
Public service productivity is precisely named, as it measures the productivity of providing public services, not the productivity of the public sector. Many public services in the UK are delivered jointly by private- and public-sector bodies. When measuring public service productivity, we take account of all the different types of providers, so our estimates capture output from both the market and non-market sectors.
The non-market sector includes other parts of the economy outside the public services, notably the non-profit institutions serving households (NPISH) sector. This is made up of non-profit institutions that are not mainly financed and controlled by government and that provide goods or services to households for free or at prices that are not economically significant. Examples include churches and religious societies, sports and other clubs, trade unions and political parties.
Finally, the quarterly estimate of public service productivity is calculated more rapidly than the National Statistic annual public service productivity estimates, using a simplified methodology. The National Statistic is calculated in line with the principles outlined in the Atkinson Review (PDF, 1.07MB), which noted that public service outputs (such as the number of students taught in schools) should be adjusted in line with the change in outcomes that could be attributed to those services (for instance, if pupils achieve better results in their exams, this increases volumes; whereas if they get poorer results, volumes decrease).
Data for these outcomes can be slow to collect, or defined over a long period, so the simplified quarterly method takes the last published quality adjustment and applies this for each quarter until it is revised for the next annual National Statistic. This adjustment is, however, only applied to our public service productivity estimates. Unadjusted public service outputs are still used in the national accounts, which is our data source for our labour productivity statistics, in line with international standards in the European System of Accounts 2010. The fact that quality adjustments are applied to public service productivity, but not labour productivity or multi-factor productivity estimates means these measures cannot be directly compared.
We intend to provide further detail on the differences between our productivity measures in the future.
Notes for: Understanding the different measures
- Note that the figure for productivity growth for the market sector is not consistent with that used in our MFP estimates, which differs from that found in our labour productivity bulletin due to differences in methods and calculation. We intend to align these in future.
3. Labour productivity
Labour productivity grew by 1.4% in Quarter 2 (Apr to June) 2018 compared with the same quarter a year ago, reflecting higher output growth (1.2%) coupled with lower growth in jobs (0.9%) and a decline in total hours worked. This is the seventh consecutive quarter that labour productivity has grown, but this remains below the rate of growth experienced prior to the downturn, which averaged around 2%.
Compared with the previous quarter, output per hour worked grew by 0.5%, reflecting higher output growth (0.4%) compared with growth in jobs (0.1%), along with a slowdown in total hours worked (−0.1%).
On an output per worker basis, labour productivity was up 0.2% compared with a year ago and 0.3% up on the quarter. Labour productivity, as measured by both output per hour and output per worker, remains well below the levels it would have achieved had productivity growth continued at the pre-downturn rate (Figure 1).
Figure 1: Output per hour and output per worker, Quarter 2 (Apr to June) 1994 to Quarter 2 2018
Seasonally adjusted, UK
Source: Office for National Statistics
Download this chart Figure 1: Output per hour and output per worker, Quarter 2 (Apr to June) 1994 to Quarter 2 2018
Image .csv .xlsLabour productivity estimates now include methodological improvements to productivity hours, which have revised the levels of productivity from Quarter 1 (Jan to Mar) 1994 within particular industries. These improvements have relatively little effect on patterns of growth over time for individual industries, and only a small effect on total hours worked across the whole economy (due to a change to use unrounded total hours worked in the calculations).
Since July 2017, we have been publishing an experimental dataset of industry-by-region labour productivity estimates, disaggregating the whole economy into 16 industrial sections, and 12 regions of the UK based on the Nomenclature of Units for Territorial Statistics (NUTS1). The dataset includes estimates of output per hour, output per worker, productivity hours and productivity jobs.
The labour productivity statistical bulletin now includes a dedicated section on experimental industry-by-region productivity statistics. In the bulletin published alongside this release, we present commentary on output per hour for services and manufacturing by NUTS1 regions for 2016, the latest year that data are available. Although London records the highest level of output per hour for services (£42.80), the North West and Scotland record the strongest output per hour for manufacturing, at £42.78 and £42.46 respectively (Figure 2).
Figure 2: Output per hour (current prices) for each region in the UK, 2016

Source: Office for National Statistics
Download this image Figure 2: Output per hour (current prices) for each region in the UK, 2016
.png (30.0 kB) .xls (29.2 kB)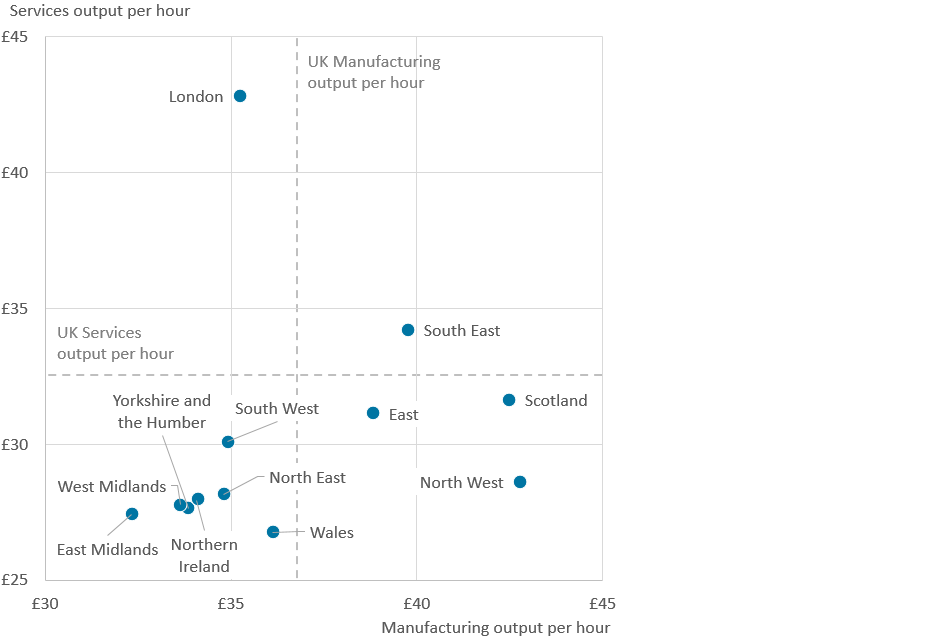
4. Multi-factor productivity
Included in this release is the first in our new series of timely, quarterly estimates of multi-factor productivity (MFP), now published on the same timetable as our labour productivity estimates at approximately 95 days after the end of the reference period. As far as we are aware, these are the only quarterly MFP statistics published by any National Statistical Institute (NSI) in the world. This, along with other developments to Office for National Statistics’ (ONS’s) Growth Accounting suite of statistics, follows a main finding of the Bean Review and the review of international best practice in the production of productivity statistics.
Estimates of MFP augment our labour productivity estimates by taking account of movements in productive capital (such as machinery and software) and compositional developments in the labour market (for example, an increase in the number of workers with university degrees) as well as hours worked. We have also published a new simple guide to MFP.
Figure 3 decomposes cumulative quarterly growth of market sector output per hour worked since Quarter 1 (Jan to Mar) 2008 into contributions from capital deepening (capital per hour worked) and labour composition (the skills make-up of the workforce), and the residual MFP contribution. Labour productivity in the market sector grew by 1.7% in the year to Quarter 2 (Apr to June) 2018, which is explained by improvements in MFP (0.8%), capital deepening (0.8%) and labour composition (0.1%).
Although quarterly movements in these experimental statistics should not be over-interpreted, Figure 3 highlights the prolonged weakness of market sector labour productivity since the financial crisis. More than 10 years on, labour productivity per hour worked is only just ahead of its level in 2008. MFP is still some 4 percentage points lower than in 2008, having grown only slowly and intermittently since 2009, compared with trend growth in MFP of around 1% per year prior to the economic downturn (Figure 4). Capital deepening has also been exceptionally weak by historic standards, reflecting sluggish growth in investment relative to hours worked. On the other hand, labour composition has steadily improved over the last 10 years.
Figure 3: Decomposition of cumulative quarterly growth of output per hour worked, Quarter 1 (Jan to Mar) 2008 to Quarter 2 (Apr to June) 2018
UK, market sector
Source: Office for National Statistics
Notes:
Labour productivity growth is the cumulative quarter-on-quarter log change in market sector gross value added (GVA) per hour worked.
Columns show contributions of components, calculated by weighting log changes in each component by its factor income share.
MFP is calculated by residual.
Download this chart Figure 3: Decomposition of cumulative quarterly growth of output per hour worked, Quarter 1 (Jan to Mar) 2008 to Quarter 2 (Apr to June) 2018
Image .csv .xlsFigure 4 highlights the structural break at the time of the economic downturn in 2008, where capital deepening stopped growing and MFP demonstrated a level-shift downwards. Slow growth from labour composition and MFP since then have so far failed to reverse this change.
Further information, including MFP breakdowns for 10 component industries, longer runs of annual data and supporting data on capital and labour composition, is available in the datasets published alongside the quarterly MFP article.
Figure 4: Decomposition of cumulative quarterly growth of output per hour worked, Quarter 1 (Jan to Mar) 1994 to Quarter 2 (Apr to June) 2018
UK, market sector
Source: Office for National Statistics
Notes:
Labour productivity growth is the cumulative quarter-on-quarter log change in market sector gross value added (GVA) per hour worked.
Columns show contributions of components, calculated by weighting log changes in each component by its factor income share.
MFP is calculated by residual.
Download this chart Figure 4: Decomposition of cumulative quarterly growth of output per hour worked, Quarter 1 (Jan to Mar) 1994 to Quarter 2 (Apr to June) 2018
Image .csv .xlsFurther to the estimates of capital services included within the MFP release, we have published new experimental statistics on infrastructure. The article details developments to estimates of investment by government and the market sector in infrastructure capital, as well as improved detailed breakdowns of the supply of new infrastructure by the construction industry. We also present experimental estimates of the value of the stock of infrastructure capital held by the market sector, and a case study on the valuations of the infrastructure stock in the water and sewerage industry. In future work, we intend to explore the contribution of infrastructure to productivity in a growth accounting framework.
Back to table of contents5. Public service productivity
Alongside these estimates of quarterly productivity growth for the whole economy and UK market sector, we have also published updated experimental quarterly and annual estimates of public service productivity as part of this release. These measures differ from labour productivity measures of the non-market sector by taking account of changes in a range of factor inputs, including labour and capital. The approach is similar to that used for estimates of multi-factor productivity (MFP), but MFP estimates published alongside this release focus on the market sector.
In Quarter 2 (Apr to June) 2018, productivity for UK public services fell by 2.0%. This fall in productivity was the result of a 2.1% rise in inputs, while total public service output was broadly unchanged over the quarter.
As shown in Figure 5, this most recent contraction more than offset gains experienced in 2016 and 2017, although the experimental quarterly series is noticeably volatile. As a result, total UK public service productivity is now marginally lower than what it was in 2015.
Looking at the longer-term trend, Figure 5 also shows the growth in public service productivity since 1997, combining the latest annualised experimental estimates – covering 2016 to 2017 – with estimates for between 1997 and 2015, taken from the Public service productivity estimates: total public service, UK: 2015 release. It suggests that, while maintaining a general upward trend, total UK public service productivity growth is estimated to have contracted by 0.3% in 20171. Although revised up from previous estimates, this marks the first contraction in annual total public service productivity since 2009.
Figure 5: Total UK public service productivity, 1997 to Quarter 2 (Apr to June) 2018
Source: Office for National Statistics
Notes:
Estimates from 1997 to 2015 are based on the existing annual series.
Annual estimates from 2016 to 2017 are based on the annualised experimental series. These series are displayed in the third quarter of the year.
Estimates from Quarter 1 2016 to Quarter 2 2018 are based on the experimental quarterly total public service productivity series.
Estimates of productivity for the experimental period are indirectly seasonally adjusted, calculated using seasonally adjusted inputs and seasonally adjusted output.
The greyed-out area references periods where estimates are based on experimental methodology.
Download this chart Figure 5: Total UK public service productivity, 1997 to Quarter 2 (Apr to June) 2018
Image .csv .xlsNotes for: Public service productivity
- Using annualised quarterly data.
6. ICT use and productivity
We have also published new firm-level analysis combining the Annual Business Survey (ABS) with data from the E-commerce Survey to explore the relationship between the use of technologies and productivity. While adoption rates of basic information and communication technologies (ICT) (such as use of computers and access to the internet) are near saturation, more sophisticated technologies are less utilised and may be drivers of variation of productivity outcomes across businesses. To analyse the impact of ICT use on productivity, we construct three indicators of ICT use:
e-commerce indicator – businesses conduct website sales, and/or electronic data interchange (EDI) sales, and/or e-purchases
business organisation indicator – businesses use software for enterprise resource planning (ERP), and/or customer relationship management (CRM), and/or supply chain management (SCM)
ICT resources indicator – businesses resource ICT services by employing ICT specialists, and/or providing ICT training to employees, and/or outsourcing ICT services
For the businesses in the linked sample, which is skewed towards large businesses1, e-purchase is by far the most common type of e-commerce activity; this is true across production and services industries. In general, we find a significant productivity premium for engaging in e-purchases of around 10%, but the relationship between productivity and web-sales or EDI sales is weaker. However, the intensity with which businesses use web-sales and EDI sales is also correlated with productivity – the more sales they conduct through these channels, relative to more traditional channels, the more productive they are likely to be. All these effects are present for businesses in production and services industries, but are mostly found in businesses with higher levels of employment.
The use of all types of business organisation technologies in our measures are associated with a productivity premium of around 10%. A large share (24%) of businesses in our sample do not use any of these technologies to organise their business activities, but of those that do, CRM and ERP are the most common. The use of software for ERP is associated with the strongest productivity premium and businesses that use software for CRM and/or SCM as well tend to be even more productive. These findings mainly hold for businesses in the services industries.
Most businesses (64%) in our sample engage in all the ICT resourcing activities we have identified and all activities appear to provide a productivity premium. Providing ICT training to employees provides no productivity premium when controlling for other activities, unless combined with either employing ICT specialists or outsourcing ICT services. Businesses in the services industries only experience a productivity premium when using a combination of ICT resourcing methods.
Notes for: ICT use and productivity
- The linked e-commerce-ABS dataset covers firms with employment of 10 or more and is limited to the scope of industries covered by the E-commerce Survey. The data are also skewed towards large businesses who are more routinely sampled in both surveys.
7. International comparisons of productivity
Due to an ongoing review of the methodology, the International comparisons of UK productivity: first estimates 2017 will not be published as part of this release. Further information can be found in the previous statistical bulletin International comparisons of UK productivity (ICP), final estimates: 2016.
Back to table of contents8. Development plan
Finally, this is your opportunity to let us know your thoughts on our plans for future improvements and analysis on productivity statistics. Responses can be sent via email to productivity@ons.gov.uk.
Back to table of contents