Table of contents
1. Introduction
Survey response rates have been declining over the years across all modes of data collection worldwide (de Leeuw, Hox and Luiten, 2018). Declining survey response is a major problem for gaining accurate survey estimates; this is especially a problem for policymakers such as government, local authorities and businesses. This is because they require accurate data to estimate and provide efficient services to employees and revenue services, including local opportunities for jobs or training and school and health services provision.
Survey non-response can be attributed to survey respondents not being contactable, refusing to participate or choosing not to participate because of circumstantial reasons at the time of the data collection, which may include poor health, language difficulties or being too busy (Brick and Williams, 2013).
In the UK, the general public are becoming more resistant to taking part in surveys because of increased general demand for survey participation in people's day to day lives. The Office for National Statistics (ONS) is the largest statistics producer, therefore by nature a lot of surveys are conducted by the ONS. Data on ONS survey response trends show that response rates over the last 14 years have been decreasing gradually. Typical survey response rates in the most recent years range between 50% and 60%, whereas in 2004 response rates ranged between 55% and 75%. The downward trajectory has been most marked for the Labour Force Survey (LFS), where first issue response rates in 2004 were around 75% and in 2018 stood at just under 55%.
Studies have shown that monetary incentives play an increasingly important role in helping to increase and maintain survey response (Singer and Ye, 2013; Groves, 2009; Simmons and Wilmot, 2004). However, use of incentives is associated with higher survey costs, which are in addition to the normal data collection costs. Survey-taking organisations often use existing evidence, which guides their strategies to employ the most cost-effective incentive strategy (Luiten, 2016).
Currently there is a limited number of empirical studies exploring how face-to-face interviewers may moderate the overall effects of incentives on survey response rates. In the studies that did research on this topic, evidence is mixed and more research is encouraged (Singer, Hoewyk, and Maher, 2000; Kibuchi et al., 2018). It is essential to know what incentives work and how interviewers influence non-response in interviewer-mediated modes of data collection, given the presence of incentives as they become more prevalent in surveys.
The aims of the research were:
to investigate what factors affect incentives' effectiveness
to find solutions to maximise monetary incentive effectiveness on survey response rates
to contribute towards empirical research that addresses previous research limitations and extends existing research exploring face-to-face interviewer-mediating effects on monetary incentives on survey research
to provide possible recommendations on how monetary incentives' effectiveness could be maximised through use of face-to-face interviewers as an intermediary
This article reviews existing research and draws on existing findings and theories to explore whether interviewers influence survey response and the reasons behind any influences. Furthermore, we explore the evidence of how interviewers influence the effectiveness of the incentives in examples where social surveys employ the incentive approach. A multilevel cross-classified response propensity logistic model is used to decompose LFS response outcomes into household, interviewer and area levels. This modelling technique was chosen as it allows separation of the effects on the response outcome at each level (that is, household, interviewer and area).
Back to table of contents2. Background
Declining response trends in surveys
Falling response rates is a phenomenon affecting government as well as academic surveys (de Leeuw and de Heer, 2002). A study looked at response data from 10 different surveys including the labour force surveys in 16 different countries, including the UK's Labour Force Survey (LFS). The findings concluded that although response differed between countries, this included different variations in proportions of non-contact and refusal rates in different countries. There was an overall declining trend present in response consistently year on year. It was also found that there was an average annual increase in non-contact of 0.2%. The study highlighted that declining public engagement in surveys could be an international concern. A follow up study was carried out by de Leeuw, Hox and Luiten in 2018, which merged the new data up to 2015 to the old data from the previous study for the LFS only. They found that the non-response increased by 1.46% every two years on the LFS, which also replicated Beullens et al.'s (2018) findings for the European Social Survey. Response in different countries was compared using a multilevel modelling approach, where factors such as mandatory or voluntary nature of the survey and sampling differences were controlled for. Further, it was found that the speed of decline did not vary much between countries. Analysis is currently ongoing to determine whether the speed of decline is slowing down in the more recent years. The variance between countries was larger than variance between surveys; this means that there are some undefined country-specific factors that are contributing to decline in response.
Brick and Williams (2013) suggest that surveys are social activities; therefore, the decline in response rates must be looked at in the contexts in which surveys are taken as societal factors could affect both contact and refusal rates. One of the explanations for response decline in this context proposed by them is the general decline in social capital: "society's level of trust in major survey organisations, such as government and academia, has declined and, in turn, depressed response rates" (Brick and Williams, 2013, page 47). They take "high civic engagement" and "trust in the community" as major components of social capital. As privacy and confidentiality are increasingly becoming a central concern for both researchers and members of the public, this explanation is an important area of interest.
Impact of decreasing survey response rates
The response rate is defined as the number of successfully completed units divided by the number of eligible sample units (American Association for Public Opinion Research, 2006). This indicator is often used to evaluate the quality of surveys and how accurate the estimates produced from these surveys may be. Most social surveys use probability sampling methods to select participants (Groves and Peytcheva, 2008). When using probability sampling, researchers can measure sampling errors and produce unbiased estimates. However, this operates under an assumption that 100% response rates are achieved. When survey response is low, there is no certainty that the survey estimates are going to be reliable. Therefore, within the probability sampling paradigm, high response rates are preferred. The use of a probability sampling method means that survey non-response may cause survey error, specifically non-response bias (Groves, 2006).
Bolling and Smith (2017) explain that non-response bias is the difference between survey estimates based on respondent data and the true overall population values. Non-response bias can increase when there is a correlation between a specific survey variable. If the non-response is directly related to the main variable that the study is trying to measure, that becomes more problematic (that is, if the survey measures employment and employed people are the ones that tend to respond less). Groves and Peytcheva (2008) note that it is advisable to strive for high response rates as that reduces the risk of a possibility in non-response bias.
Incentives use and survey response rates
One strategy that organisations often implement to increase the response rates is introducing some form of incentive offered to respondents who are selected to take part in the study. In the literature, the most common theory for explaining why incentives are effective is the social exchange theory, which explains that respondents are more likely to respond when they trust that the ratio of rewards to costs will be proportionate. Where giving an incentive, an increase in response can be explained by respondents feeling obligated to take part because of the norm of reciprocity. That is, households who have received an incentive would consider completing the survey as a reciprocal act (Dillman, 2000). Another explanation of the effectiveness of incentives is provided by the monetary exchange theory, where the incentive is a payment for their response, where the monetary figure acts as a "precise measure of the worth of one's actions" (Dillman, 2000). This theory could also explain an incentive payment for high-burden surveys. Dillman explains that survey participation depends on three things:
rewards (people expect a gain from actions)
costs (what is required to obtain the reward)
trust (long-term expectation that rewards will outweigh the costs)
A meta-analysis conducted by Singer et al. (1999) found that incentives, undifferentiating of their amount, are effective in increasing survey response in any mode. They explain this conclusion by reviewing theories that may suggest why incentives are effective at increasing survey response. The theory of reasoned action may explain why incentives may have an effect of persuading otherwise reluctant respondents to participate, as it proposes that people decide whether to take action based on whether the benefits of doing so outweigh the costs (Ajzen and Fishbein, 1980). Therefore, incentive may be perceived as a benefit by a respondent. The offer of an incentive for taking part in a survey may create other motivations needed to appeal to potential survey respondents. The offer may also substitute for the need for motivations arising from the decline in social capital, such as civic engagement and duty that today's respondents are lacking.
There are two mainstream types of incentive that are offered in surveys: unconditional or pre-paid and conditional or post-paid incentives (Singer et al., 1999). Empirical evidence suggests that unconditional incentives tend to be more effective at increasing the response rates than the conditional incentives (Goyder, 1994; Church, 1993). This may be explained by the Gouldner's (1960) norm of reciprocity. This theory suggests that people are more likely to do something in return for those who have done something for them. Therefore, if the respondent receives an incentive upfront, an unconscious obligation to return the favour is fulfilled by taking part in the study. In addition, respondents may be encouraged to take part because of the need to reduce cognitive dissonance (Festinger, 1957). This is a phenomenon that means that psychological discomfort may be experienced when the incentive is received and no action to respond to a survey is taken by a respondent.
More specifically, many studies have provided evidence that monetary incentives are more effective than non-monetary gifts. They may work better because they appeal to people's egoistic motives. Kropf and Blair (2005) have shown that people tend to respond better when they are offered a personal incentive, which provides a personal benefit to them directly.
Interviewer-mediating effects on incentives and survey response rates
Research shows that surveys conducted using face-to-face-interviewers tend to have higher response rate when compared with all other modes including telephone, mail and web (Bowling, 2005). Singer et al. (1999) suggest that respondents may also be more willing to participate when the interviewer is present, because the interviewer reduces the respondent burden when completing the survey. However, we need to determine whether the same conclusion about interviewers' influence on response can be made when respondents are offered an incentive for participation. The following studies will review the existing evidence to investigate how face-to-face interviewers could mediate incentive effects on survey response rates.
Singer and Ye (2013) discuss that interviewers could become more confident when approaching a household if they are aware that the respondent received an incentive, and this in turn could result in achieving cooperation at the household.
Singer et al. (1999) meta-analysis considering incentives effects in interviewer-mediated surveys concluded that although incentives have a greater effect on response in mail surveys where no interviewer-respondent interaction is present, the incentives also significantly increase the response in face-to-face surveys. Furthermore, their findings showed that the extent of the incentives' effectiveness on increasing the response is directly associated with an initial response rate without the incentive, when the lower the response rate the greater the impact of incentive on increasing the response and vice versa.
However, there are studies that show that interviewers may not contribute to the effectiveness of the incentives. In a study by Singer, Van Hoewyk and Maher (2000), a telephone survey sample was split into three experimental groups. In the first group, selected participants received an advance letter with a $5 incentive, the second group of potential respondents also received the advance letter with the same incentive but in this group the interviewers working on the cases were informed about the presence of the incentive, whereas in the first group the incentive assignment was not communicated to the interviewers. Lastly, the third group was a control where no incentive was issued. The researchers found that response increased in both incentive groups irrespective of interviewers knowing about the incentive as there was no significant difference between the response for two experimental groups. This may be because interviewers in both groups approached the cases in the same manner as they would have without the incentive, therefore an additional reminder about the incentive may have not been needed or not implemented by the interviewers. Researchers did not discuss what protocol interviewers were instructed with. There was also no mention of the call recording, which may indicate that interviewers' approach when dealing with the cases in either experimental group was not taken into consideration in the analysis.
Further, Willmack et al. (1995) also conducted an experimental study to investigate face-to-face interviews' effects on incentives. In the study, the incentive offered was a prepaid non-monetary incentive: a pinball pen. Interviewers were not aware if they were working on the cases that received incentive or the ones that did not. The group that received an incentive had a significantly higher response rate than the control group. This suggest that even if interviewers are unaware of the incentive, the incentive alone can positively impact on the response.
The studies reviewed so far lend support that in most instances, incentives positively influence survey response rates in any mode. Research may also suggest that interviewer behaviours and expectations may contribute towards achieving positive outcomes, which may further enhance the results achieved from incentives alone. However, research investigating this joined influence of incentives' effects on survey cooperation mediated by face-to-face interviewers is somewhat limited to date, and the results are mixed. It is still unclear whether the interviewer effects are consistent and have a significant effect on moderating all types of incentives in a similar manner or whether it varies by incentive type. Factors that would explain between-interviewer variation also remain to be uncovered.
The following research example is more recent study by Kibuchi et al. (2018), which used a multilevel model approach to investigate face-to-face interviewer influences on the effectiveness of incentives in achieving survey cooperation. The researchers used data from three UK face-to-face surveys, where conditional incentives of varying amounts were issued to boost the response rates. Study findings suggested that there was a significant variance in how effective the interviewers were at using the incentives in order to gain cooperation. This was observed across all three surveys. However, the study could not explain which factors specifically predicted the variation between interviewers. They looked at the interviewer's gender, age, experience and overall performance, but none of these characteristics were significant at explaining between-interviewer variability in the effectiveness of incentives on cooperation. Kibuchi et al. (2018) highlighted that their study had a few limitations, which should be addressed in future research. The limitations included not being able to link all the data to the area characteristics, meaning it was not possible to look at the cross-classification between area and interviewer characteristics, which would have helped to separate interviewer effects from external area effects and may have reduced between interviewer variance. Furthermore, they highlighted that the data on interviewer attitudes, beliefs and behaviour was not available and previous research (Jäckle et al., 2011; Durrant et al., 2010) suggests that these characteristics may have helped to explain between-interviewer variance.
The research paper aimed to extend Kibuchi et al.'s (2018) work by investigating how face-to-face interviewers influence the effectiveness of the mixed-monetary unconditional incentives in achieving survey cooperation on the UK LFS. The limitations, such as lack of data detailing interviewer behaviours and attitudes and inclusion of area-level variables, were also addressed in the present study.
Back to table of contents3. Method
The respondents for the Labour Force Survey (LFS) are randomly sampled within areas, and the cases are allocated to field interviewers non-randomly. Each field interviewer is allocated work in a few Interviewer Areas, which are in set geographic boundaries that do not change over time; this is done to optimise the efficiency and reduce the travelling times between cases. Therefore, this constitutes a non-random assignment of cases to interviewers as the random-allocation approach otherwise called interpenetrating design (Hox, 1994) would be too costly to implement and would not be practical for a large country-wide survey such as the LFS.
To accurately study interviewer effects using conventional regression models, the interpenetrating design method is required. Since the LFS interviewers are allocated cases within specific geographic boundaries, the natural clustering is present in the data, and the multilevel model approach for data analysis is more appropriate in this instance. Therefore, the current data follow a hierarchical structure where interviewers and interviewer areas are cross-classified. In this case, the standard analysis assuming independence of observations in the data would then lead to under-estimation of the standard errors of the estimators and, thus, inflate the statistical significance. Furthermore, the dependent variable in the current data is a binary variable, therefore logistic regression methods with a multilevel structure will be used.
Preliminary analysis to investigate possible clustering in the study data was carried out where simple logistic regression was used in model one and a second model was a random intercept model with two-levels, which allows for a group-specific effect by including a random effect for interviewers in the model. Both models included also included one predictor variable, which was the incentive dummy. Table 1 compares the results from each model. The reduction in the Deviance Information Criterion that is much greater than three suggests that in the second model, adding a random intercept at an interviewer level and accounting for the hierarchical structure in the data significantly improved the model fit (Rasbash et al., 2019; Browne, 2017). This suggests that the multilevel approach is more suitable for analysing the data.
| Model | DIC | DIC Change |
|---|---|---|
| 1: model 1 (logistic regression) | 45840.969 | - |
| 2: model 1 + random intercept (interviewers) | 44619.714 | 1221.255 |
Download this table Table 1: Deviance Information Criterion (DIC) values and DIC change for the initial two-level models
.xls .csvIn addition, the Variance Partition Coefficient (VPC) was calculated to quantify the clustering effect in the data. Owing to the outcome variable being binary, calculation of the VPC is not as straightforward as it would be if the outcome variable was continuous. Several methods for calculating the VPC in logistic regression exist. These include:
linearisation method
simulation-based method
latent variable or threshold method
naive linear model method (Li, Gray and Bates, 2008)
However, some of the methods are computationally demanding, so the latent variable or threshold method was the most advantageous in this case. The VPC calculation for this method can be expressed as:
Therefore, the estimated VPC value from the second model was equal to 0.047 (VPC = 0.163/(0.163+3.29) = 0.047). This suggests a clustering effect in the data, which needs to be addressed by using an appropriate statistical analysis.
Variables summarising area characteristics were matched to the survey outcomes data. Therefore, having these variables in the model will allow separation of the area effects from the interviewer effects through the use of cross-classified multilevel model. Studies have shown that when studying interviewer effects, area effects are often ignored, which can lead to overestimation of the interviewer effects (Haunberger, 2010; Blom et al., 2010; Vassallo et al., 2016). Specifying cross-classification in a multilevel model can also help to prevent confounding effects in data where there is an overlap between interviewer assignments and areas (that is, where interviewers are allocated cases in several geographic areas and cases within the same geographical area can be allocated to several interviewers (Vassallo et al., 2016)). Because there is an overlap between interviewer assignment and areas in the LFS, the final model was specified as a cross-classified model.
Because we specified cross-classification in the model, Markov Chain Monte Carlo (MCMC) methods will be used to estimate the models; this will be carried out in the MLwiN version 3.02 (Browne, 2016; Rasbash et al., 2005). Cross-classification between levels in the model is not possible using the frequentist-only estimation methods in this software. The MCMC method can cope with more complex structures, as this method is simulation based, which means that many iterations are run and after each iteration, an estimate for each parameter is produced. From the fitted model, probability distributions are produced for each model parameter; this is referred to as the posterior distribution (Browne, 2015).
The significance of the coefficients and the model fit will be assessed using the Deviance Information Criterion (DIC). Spiegelhalter et al. (2002) proposed a Bayesian model comparison criterion, DIC, which weighs up goodness of fit and model complexity. DIC measures the fit via the deviance and the complexity is measured by estimating the effective number of parameters, which is posterior mean deviance with deviance evaluated at the posterior mean of the parameters subtracted. When comparing the models using DIC value, a reduction of at least three points in DIC value indicates a better model fit in the model with lower value. The model with the smallest DIC is deemed to be the model that would best predict a replicate dataset that has the same structure as that currently observed (Spiegelhalter et al., 2002).
A total of 10 models were run and for models one to nine, the DIC value was significantly reduced, compared with the previous model (Table 5, Appendix 1). Models one to seven included only one covariate, which was the incentive dummy. There was one exception in model three, when instead of specifying a random intercept on interviewers (as in model two), the random intercept was specified on the area. When the area random intercept model was compared with the interviewer random intercept model, the DIC value increased, but these two models were not nested. However, when two intercepts for both area and interviewer and the cross-classification was specified in model five, the DIC value reduced significantly when comparing it with both model two and model three. Further, it should be noted that when the cross-classification was specified in model five and this was compared with the same model without the cross-classification specified (model four), the interviewer variance increased. This suggests that interviewer variance was underestimated in model four, when the cross-classification was not specified.
Based on the DIC value improvement (Table 5, Appendix 1), we decided that the final model will be model nine. This model includes two random intercepts on both interviewer and area and two random coefficients on the incentive dummy for both interviewer and area; the cross-classification was also taken into account. The final model also includes six area characteristic variables at an area level and seven variables measuring interviewers' attitudes about the introductory approach, refusal and incentives at an interviewer level. In model 10, we also tried interaction terms between the incentive dummy and significant interviewer-level variables; however, the DIC value for this model increased from the previous one and the interaction terms were not significant. Therefore, model 10 was not chosen as the final model.
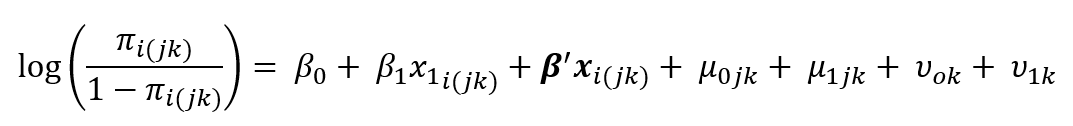
The final model that is applied in the analysis has the following mathematical expression:
In the model, yi(jk) is the binary cooperation outcome for the LFS wave one case i (i=1,…,i), which is interviewed by an interviewer j (j=1,…,j) and is located in an area k (k=1,…,k). The outcome variable in the model is assumed to follow a Bernoulli distribution, which has conditional response probabilities (Snijders and Bosker, 2012).
In the model equation stated earlier, x1i(jk) indicates the incentive amount allocation for case i, which is assigned to interviewer j and falls within area k. Further, xi(jk) is a vector of the remaining case, and interviewer and area-level covariates, β', is a vector of coefficients. The following denote the random effects in the model, which represent unobserved area and interviewer effects: υ0k is a random intercept for area k and υ1k is a random coefficient for area k on the incentive variable. Similarly, μ0jk is a random intercept for interviewer j, and μ1jk is a random coefficient for interviewers on the incentive variable.
The random intercept and coefficient variances are assumed to follow a normal distribution with zero mean and constant variances: μ0jk ~ 𝑁(0,𝜎2𝜇0) , μ1jk ~ 𝑁(0,𝜎2𝜇1); υ0k ~ 𝑁(0,𝜎2υ0), υ1k ~ 𝑁(0,𝜎2υ1). The interviewer random coefficient on incentives variable produces a covariance (𝜎𝑢10) between interviewer-level random effects: 𝜇0𝑗k and 𝜇1𝑗k. Further, the area random coefficient also produces covariance between area-level random effects: υ0k and υ1k.
The initial values for the parameter estimates (fixed effects) will be produced using RIGLS method in MLwiN, which is a second-order penalised quasi-likelihood (PQL) estimation method. Starting values for the random parameters will be used as vague priors. Further, the diffuse inverse Wishart prior distribution will be applied for the variance components (Browne and Draper, 2000).
Back to table of contents4. Results
Descriptive analysis
Table 2 shows Labour Force Survey (LFS) cooperation rates for the £10 incentive condition were 1.57 percentage points higher than the cooperation rates for the £5 condition. This was a result of the lower refusal rate in the £10 condition. The difference was statistically significant (t = 3.23, p = 0.0012), after proportions t-test was carried out (95% confidence intervals: £5 condition [66.91; 68.31]; £10 condition [68.54; 69.82]).
Further descriptive analysis was done on the raw survey outcomes data, prior to matching with other data sources, to show all response outcomes. These survey outcomes are displayed in Table 3. It shows that the £10 incentive condition resulted in a significantly higher response rate (by 0.9 percentage points, t = 3.4, p = 0.0006) and significantly lower refusal (by 1.9 percentage points, t = 7.8 p < 0.0001) when comparing it with the £5 incentive condition. However, the non-contact rate was significantly higher (by one percentage point, t = 5.6 p < 0.0001) in the £10 incentive condition than in the £5 incentive condition. The difference between incentive conditions was tested using the proportions t-test.
| Incentive amount | Total cases | Interview count | Cooperation rate (%) | Refusal count | Refusal rate (%) |
|---|---|---|---|---|---|
| £5 | 16,998 | 11,493 | 67.61 | 5,505 | 32.39 |
| £10 | 19,777 | 13,682 | 69.18 | 6,095 | 30.82 |
Download this table Table 2: Labour Force Survey cooperation and refusal rates by incentive condition
.xls .csv
| LFS wave 1 outcomes | £5 incentive (%) | £10 incentive (%) |
|---|---|---|
| Response rate | 55.9* | 56.8* |
| Refusal rate | 31.3* | 29.4* |
| Non-contact rate | 12.8* | 13.8* |
| Total cases | 72,836 | 70,016 |
Download this table Table 3: Response outcome summary by incentive condition
.xls .csvSince the preliminary analysis showed that LFS outcomes varied between two incentive conditions, further analysis using cross-classified multilevel models will be carried out to investigate if cooperation varies between interviewers given the presence of mixed-monetary incentives for all cases.
The results from the final model are presented in Table 2. The table shows the regression coefficients, coinciding standard deviation values, and credible intervals for fixed and random effects in the model. Credible intervals are specific to Bayesian inference, and they can be interpreted more naturally than frequentist confidence intervals. Credible intervals can be interpreted in such a way that there is 0.95 probability that the interval contains the population mean rather than frequentist confidence intervals' interpretation that 95% of confidence intervals would contain the population mean if the study was repeated multiple times (Bijak and Bryant, 2016). If the range of values in the 95% credible interval do not contain zero, the associated variable can be interpreted as being significantly associated with the outcome variable.
The parameter coefficients, standard deviations and 95% credible intervals presented in Table 3, are the means, standard deviations and quantiles of the posterior distribution produced following 50,000 runs, after a burn-in of 10,000.
Results for the fixed effects in the model
As shown in Table 3, if the case was issued incentive of £10, it was associated with an increased probability of cooperation, compared with cases that were issued a £5 incentive. This result was significant as the credible interval for the higher incentive coefficient did not contain zero.
Looking at the area characteristics at the area level, two of the variables were significantly associated with cooperation. The analysis showed that if the social disadvantage in the area was higher, the probability of cooperation would decrease. Urbanicity was also found to be negatively associated with cooperation. As the negative coefficient for urbanicity indicates, with an increase in urbanicity the cooperation is predicted to decrease. The age profile, housing structure and crime rate variables had negative coefficients, suggesting negative association with cooperation. However, these associations were not found to be statistically significant. Population mobility was the only characteristic that had a positive coefficient, suggesting positive association with cooperation outcome; however, this association was also not found to be significant. As shown in Table 5 (Appendix 1), when the area characteristics' variables were included in model eight, this reduced Deviance Information Criterion (DIC) value by 81 compared with previous model without the covariates; this indicates a significant improvement in model fit despite some of the variables not being significant predictors of cooperation. However, the non-significant variables were kept in the following models owing to theoretical interests.
Three interviewer-level variables were also found to be significantly associated with cooperation. When interviewers agreed or strongly agreed to the statement that when they get a refusal it is a result of respondent being uncooperative, probability of cooperation declined in relation to the reference category, which was neither agreeing nor disagreeing to this statement. On the other hand, when interviewers disagreed or strongly disagreed with the same statement, no significant association with cooperation was found. A self-reported interviewer introductory approach behaviour was also found to be significantly associated with cooperation. When interviewers said that they always or usually describe how the household was selected in their introduction, this was positively associated with cooperation. No significant association between rarely or never using this introductory approach and cooperation was found. Also, the coefficient for this category of the variable was positive, which indicates positive association with cooperation. The final interviewer-level variable that was significantly associated with cooperation was interviewers' opinions on which incentive type was most effective. When interviewers were asked, "From your experience, which type of incentive is most effective for gaining cooperation?", and answered that pre-paid incentive was most effective for gaining cooperation, the probability of cooperation was shown to decrease in relation to the reference category (stating that pre-paid and post-paid incentives are both as effective). When interviewers stated that from their experience, post-paid incentives that are offered after participation are more effective at gaining cooperation, this was found to be positively associated with cooperation, but this effect was not statistically significant. Other interviewer-level covariates that were included in the final model related to interviewer opinions and behaviours in regard to incentives; however, none of the other covariates were found to be significantly associated with cooperation. Despite further associations not being significant, there were few notable findings. When interviewers agreed or strongly agreed that offered incentives helps them gain cooperation, the coefficient was positive, suggesting positive association, and the opposite was found when interviewers disagreed or strongly disagreed with the same statement. Also, when the interviewers were asked if the £10 incentive that is offered to some LFS respondents is too much, too little or about right, for those who said it was too much (compared with about right), probability of cooperation increased, and for those who said it was too little, probability of cooperation decreased.
When the interviewer-level characteristics were added in the model nine, in addition to parameters in the previous model with random effects, incentive dummy and area characteristics as covariates, this vastly improved the model fit as the DIC value decreased by 2,591 (see Table 5, Appendix 1). Despite an addition of 16 extra parameters, the improvement in the model fit was very large, indicating that interviewer characteristics' variables were important covariates in terms of model fit. For theoretical interest purposes, the non-significant variables regarding interviewers' attitudes about incentives were kept in the final model. Other non-significant variables regarding introductory, doorstep and refusal conversion approaches were removed because of the large number of variables available.
Results for the random effects in the model
In Table 5 (Appendix 1), when comparing models two and three it can be seen that random intercept for interviewers improved the model fit to a greater extent that when in model three only random intercept for area was added. Comparing it to the base model, the DIC values reduced by 1,221 in the model with random intercept for interviewers and by 487 in the model with random intercept for areas. This suggests that between-interviewer variability is greater than between-area variability. When in model five intercepts for both area and interviewers were added (cross-classification taken into account), this further reduced the DIC value when compared with both models two and three, suggesting that there is significant between-interviewer and area variation in cooperation.
In models six and seven, random coefficients on the incentive dummy (lower incentive as reference category) were added for interviewers and then both interviewers and areas. DIC values decreased by 17 and 42 respectively, comparing these with the previous model; this suggests an improved model fit. Further, in model seven random coefficient values for area (0.027(0.010)) and for interviewer (0.028(0.009)) were both significant, which indicates that there was significant between-interviewer and area variability in how incentives affected the cooperation rate (see Table 5, Appendix 1). In both models, cross-classification between the levels was specified, which helps to adjust for the effects of multiple nesting within the same level in the estimates (Durrant et al., 2010).
Inclusion of the area-level covariates in model eight reduced both the between-area and the interviewer variation on cooperation as well as the between-interviewer and area variation on the effects of incentive on cooperation. However, although this significantly improved the model fit (DIC reduced by 81 relative to model seven), both random intercepts and coefficients for area and interviewer remained significant in model eight. This implies that area characteristics added in the model did not sufficiently explain the variation and there is still variation that is caused by unknown factors. After controlling for area characteristics in the model, significant between-interviewer variation in how effective the incentive was on cooperation suggests that the variation is likely be because of differences in interviewer attitudes and behaviours when it comes to utilising the incentive. To test this, interviewer characteristics' covariates were added in the final model nine.
As shown in Table 5 (Appendix 1), addition of interviewer-level covariates vastly improved the model fit as the DIC value further reduced by 2,591 compared with the previous model. However, as demonstrated in Table 4, the additional covariates measuring interviewer attitudes and behaviours failed to decrease between-interviewer variance, which was attributed to random effects. Both random intercept and coefficient values were significant for interviewers, indicating that even after controlling for some of the interviewer attitudes, behaviours and area characteristics, there still was a significant between-interviewer variation in both cooperation and in how they moderated the effect of incentives on cooperation. From the final model, the interviewer random intercept suggests that one standard deviation increase in unobserved interviewer characteristics is associated with a 50% increase in the odds of cooperation1.
Further, the interviewer random coefficient suggests that one standard deviation increase in unobserved interviewer characteristics is associated with an 18% increase in the odds of how effective incentive is on cooperation1.
The interviewer covariance value in the final model was found to be non-significant (covariance value of negative 0.017). This meant that the effect of the incentive on cooperation was unaffected by interviewer overall cooperation rates for their overall workload.
Moreover, looking at the random effects for area from the final model, as demonstrated in Table 4, similar results were also found. Both area random intercept and coefficient remained significant, indicating the presence of unobserved area characteristics that contribute towards between-area variability on cooperation and on how difference in area moderates incentives' effects on cooperation. Following the same logic as for interviewer random effects, one standard deviation increase in unobserved area characteristics could be associated with a 13% increase in cooperation and a 17% increase in the incentives' effects on cooperation. Covariance of area random effects was not significant at the 5% level, but significance was found at the 10% level. This suggests that there is some evidence that the effect of incentives would be lesser for the areas with lower overall cooperation rates.
| Variable (reference category) | Posterior | ||||
|---|---|---|---|---|---|
| Category | β | SD | 2.5% Quantile | 97.5% Quantile | |
| Intercept | 0.595* | 0.139 | 0.336 | 0.866 | |
| Incentive (£5 unconditional per hhld) | £10 unconditional per hhld | 0.106* | 0.036 | 0.035 | 0.176 |
| Area characteristics | |||||
| Social disadvantage | -0.088* | 0.018 | -0.123 | -0.053 | |
| Urbanicity | -0.094* | 0.018 | -0.129 | -0.059 | |
| Population mobility | 0.001 | 0.015 | -0.028 | 0.03 | |
| Age profile | -0.025** | 0.014 | -0.052 | 0.002 | |
| Housing structure | -0.02 | 0.015 | -0.048 | 0.009 | |
| Crime rate | -0.026 | 0.03 | -0.086 | 0.033 | |
| Interviewer attitudes | |||||
| Refusal is a result of respondent being uncooperative (neither agree nor disagree) | Strongly agree/Agree | -0.139* | 0.064 | -0.262 | -0.01 |
| Refusal is a result of respondent being uncooperative (neither agree nor disagree) | Disagree/Strongly disagree | -0.076 | 0.074 | -0.22 | 0.072 |
| Describe how the household has been selected to take part (Sometimes) | Always/Usually | 0.276* | 0.116 | 0.065 | 0.505 |
| Describe how the household has been selected to take part (Sometimes) | Rarely/Never | 0.202 | 0.248 | -0.294 | 0.683 |
| From your experience, which type of incentive is most effective for gaining cooperation? (Both are as effective) | Other | -0.003 | 0.088 | -0.171 | 0.172 |
| From your experience, which type of incentive is most effective for gaining cooperation? (Both are as effective) | Offered to respondents after participation | 0.036 | 0.067 | -0.095 | 0.168 |
| From your experience, which type of incentive is most effective for gaining cooperation? (Both are as effective) | Pre-paid incentive offered before participation | -0.151* | 0.079 | -0.305 | -0.023 |
| When respondents are offered an incentive, it helps me gain their cooperation (neither agree nor disagree) | Strongly agree/Agree | 0.023 | 0.065 | -0.101 | 0.154 |
| When respondents are offered an incentive, it helps me gain their cooperation (neither agree nor disagree) | Disagree/Strongly disagree | -0.029 | 0.114 | -0.254 | 0.194 |
| If incentives are offered, I mention it to (Some households) | All/Most households | -0.065 | 0.067 | -0.195 | 0.067 |
| If incentives are offered, I mention it to (Some households) | A few/none households | -0.04 | 0.085 | -0.207 | 0.13 |
| I find it uncomfortable mentioning an incentive to a potential respondent (neither agree nor disagree) | Strongly agree/Agree | 0.024 | 0.113 | -0.192 | 0.251 |
| I find it uncomfortable mentioning an incentive to a potential respondent (neither agree nor disagree) | Disagree/Strongly disagree | 0.033 | 0.075 | -0.114 | 0.177 |
| On the LFS some respondents are offered £10 incentive, do you think it is..? (about right) | Too much | 0.074 | 0.09 | -0.102 | 0.25 |
| On the LFS some respondents are offered £10 incentive, do you think it is..? (about right) | Too little | -0.094 | 0.095 | -0.274 | 0.098 |
| On the LFS some respondents are offered £10 incentive, do you think it is..? (about right) | Don’t know | -0.139 | 0.094 | -0.327 | 0.041 |
| Random intercept for area k | 𝜎2 υ0 | 0.016* | 0.005 | 0.009 | 0.028 |
| Covariance for area k | 𝜎 υ10 | -0.007** | 0.005 | -0.02 | 0.001 |
| Random coefficient on incentive for area k | 𝜎2 υ1 | 0.025* | 0.009 | 0.012 | 0.048 |
| Random intercept for interviewer j | 𝜎2𝜇0 | 0.163* | 0.024 | 0.121 | 0.215 |
| Covariance for interviewer j | 𝜎𝑢10 | -0.017 | 0.015 | -0.05 | 0.01 |
| Random coefficient on incentive for interviewer j | 𝜎2𝜇1 | 0.027* | 0.009 | 0.013 | 0.049 |
Download this table Table 4: Coefficients, standard deviations and 95% credible interval values estimated from the final model (model nine)
.xls .csvNotes for Results:
- Calculation used the methodology proposed by Durrant et al. (2010, page 14).
5. Discussion
Existing research indicates that the offer of incentives positively influences survey response rates in any survey mode. However, in face-to-face surveys, this effect may be lesser than in self-completion modes, given already high baseline response associated with this mode. This was attributed to the interviewer effects in face-to-face mode (Singer and Ye, 2013; Groves et al., 2009; Simmons and Wilmot, 2004).
The number of studies examining interviewer effects in surveys where incentives are used is quite limited. The findings of the existing studies indicate that interviewers may further enhance the results achieved from incentives alone, but the underlying mechanisms that explain why incentives may be more effective for some interviewers than others are not clear (Kibuchi et al., 2018; Lynn, 2001). This indicates that more research is needed to increase the knowledge and understanding about interviewer effects on survey cooperation given the use of incentives. This is particularly important as the use of incentives is becoming more widespread in UK surveys to attempt to reverse the downward trend in survey response (SRA, 2017).
This article attempted to examine interviewer effects on both survey cooperation and how these effects may moderate the effectiveness of incentives further. This was done using a cross-classified multilevel model to separate true interviewer effects on survey cooperation from other confounding factors.
When £5 unconditional incentive effectiveness was compared with the effectiveness of a £10 incentive, we found that the higher incentive increased the probability of cooperation; this effect was significant even after controlling for area and interviewer characteristics. This finding may suggest that the £10 incentive reflects the participant burden required to complete the survey better than the £5 incentive, thus higher incentive still produces a higher cooperation in this instance. This would be in line with existing evidence, which suggests that the incentive should be large enough to counteract the survey burden and make it worthwhile for a respondent to take part (Hsu et al., 2017; Cantor et al., 2007).
Further, study findings indicated that social disadvantage and urbanicity area characteristics were significantly associated with cooperation. The findings suggested that as the socio-economic disadvantage score increased, the probability of cooperation decreased. This shows that in areas where there is a higher number of single-parent households, households that are unemployed and/or receive benefits, more rented properties and fewer households where the residents work in managerial and professional occupations, it may be more difficult to achieve cooperation even after the receipt of an incentive is taken into consideration.
Social exchange theory (Goyder, 1987) may offer an explanation of this finding. It suggests that individuals who believe they have received few or poor services from government and those feeling disadvantaged may be less inclined to respond to government requests. This conclusion seems to remain based on current study findings, even when the households were offered an incentive for participation.
Higher urbanicity was also negatively associated with cooperation. This meant that cooperation after incentive is still more challenging to achieve in areas with higher population density. This finding is supported by Durrant and Steele (2009) who also found that urban areas, areas with a higher proportion of single parents and households where the main householder had lower qualifications were associated with lower cooperation.
The age profile was a significant factor, suggesting that as the proportion of young people increased, the cooperation decreased. A higher proportion of younger age groups in areas was found to be significantly associated with higher refusal in a study by Durrant et al. (2010), without accounting for incentives. This may suggest that incentives could help to bridge the gap between different cooperation propensities that are normally associated with younger and older age groups in survey research.
The current study found that the effectiveness of unconditional incentives on Labour Force Survey (LFS) cooperation rates varied by interviewer. Therefore, this supported and extended Kibuchi et al.'s (2018) findings, suggesting that this effect persisted given a different type (unconditional) of incentive used on the LFS. This was an interesting finding as it may be hypothesised that interviewer effects may hold less weight when an incentive is issued directly to a respondent rather than by an interviewer themselves. This is because of the different cognitive processes occurring given the use of different types of incentives. Unconditional incentives produce feelings of reciprocity, which is an automatic and often subconscious process, whereas conditional incentives rely on respondents' rational thinking to assess cost and benefits of taking part and then receiving a reward (Singer et al.,1999). Therefore, it would be assumed that interviewers would have more influence when the incentive is offered conditionally on participation as they could influence respondents' rational thinking and thus a decision to take part in a survey. Current study findings show that interviewer behaviours and attitudes have a significant effect on cooperation even when the incentive is issued unconditionally.
Further, the study attempted to explain the variance between interviewers by including variables collected via the Interviewer Attitudes Survey (2018)1. These data included unique insights of what interviewers thought about incentives and their behaviours related to incentive utilisation as part of gaining cooperation as well as some of their attitudes and behaviours regarding introductory and refusal-conversion approaches. Unfortunately, the interviewer characteristics considered were not sufficient in explaining between-interviewer variance. After the interviewer variables were included, the between-interviewer variance resulting from unknown characteristics remained significant. This suggested that other interviewer characteristics that were not quantified are influencing between-interviewer variation.
The findings of the current study also showed that between-interviewer variance on incentives' effectiveness was greater than between-area variance, although between-area variance was also found to be significant. This supports O'Muircheartaigh and Campanelli's (1999) and Durrant et al.'s (2010) findings, which also suggest stronger effects of interviewers rather than areas on response outcomes.
Finally, the study findings showed that variability in incentives' effectiveness was not related to the overall response rate achieved by an interviewer, which echoed Kibuchi et al.'s (2018) findings. Although the reasons for this finding are not clear, this may suggest that other measures of interviewer performance, such as contact success or the variation in the calling patterns, which were not considered in the current study, may be contributing towards the variability in the effectiveness of incentives on cooperation.
However, this study has limitations. The interviewer- and area-level variables included failed to explain between-interviewer and between-area variation in the effectiveness of incentives on cooperation. The previous research reviewed may suggest that including household-level characteristics may have helped to explain between-area variance. Further, having more objective measures for interviewer behaviour and attitudes may have helped to explain between-interviewer variance. Future research in this area should try and obtain such data. It should also be considered to include other interviewer performance measures in the model, such as number of successful contact calls made to the household and number of appointments made. This would require investigation of case-related call records with corresponding interviewer information.
Notes for Discussion
- The Interviewer Attitudes Survey (2018) was adapted from a standard Office for National Statistics Interviewer Attitudes Survey. Specific questions used can be obtained by contacting the author of this paper.
6. Appendix 1
| Model | Interviewer variance | SD | Area variance | SD | DIC | DIC Change (from previous model) |
|---|---|---|---|---|---|---|
| 1: model 1 (Base – logistic regression) | - | - | - | - | 45840.969 | - |
| 2: model 1 + random intercept (interviewers) | 0.162 | 0.015 | - | - | 44619.714 | 1221.255 |
| 3: model 1 + random intercept (areas) | - | - | 0.067 | 0.009 | 45353.695 | 733.981 |
| 4: model 1 + 2 random intercepts (areas and interviewers) | 0.131 | 0.016 | 0.033 | 0.009 | 44616.922 | -742.773 |
| 5. model 4 + cross-classification specified | 0.164 | 0.018 | 0.007 | 0.004 | 44579.05 | -37.872 |
| 6: model 4 + random coefficient (interviewers) cross-classification specified | Intercept 0.173 | Intercept 0.025 | 0.006 | 0.004 | 44562.211 | -54.711 |
| Coefficient 0.028 | Coefficient 0.010 | |||||
| 7: model 4 + 2 random coefficients (interviewers and area) cross-classification specified | Intercept 0.170 | Intercept 0.024 | Intercept 0.017 | Intercept 0.005 | 44519.93 | -42.281 |
| Coefficient 0.028 | Coefficient 0.009 | Coefficient 0.027 | Coefficient 0.010 | |||
| 8: model 6 + area characteristics covariates | Intercept 0.165 | Intercept 0.023 | Intercept 0.015 | Intercept 0.004 | 44438.129 | -81.801 |
| Coefficient 0.026 | Coefficient 0.009 | Coefficient 0.024 | Coefficient 0.008 | |||
| 9: model 7 + interviewer attitudes covariates | Intercept 0.163 | Intercept 0.024 | Intercept 0.016 | Intercept 0.005 | 41846.641 | -2591.488 |
| Coefficient 0.027 | Coefficient 0.009 | Coefficient 0.025 | Coefficient 0.009 | |||
| 10: model 8 + interaction terms with incentive dummy | Intercept 0.161 | Intercept 0.023 | Intercept 0.016 | Intercept 0.005 | 41849.471 | 2.83 |
| Coefficient 0.030 | Coefficient 0.011 | Coefficient 0.025 | Coefficient 0.009 |
Download this table Table 5: Final model selection summary
.xls .csvContact details for this Methodology
philip.lowthian@ons.gov.uk / lina.lloyd@ons.gov.uk
Telephone: +44 (0)207 592 8640 / +44 (0)1329 444813