1. Other bulletins in this release
Commentary on topics covered in the Annual Survey of Hours and Earnings (ASHE) is split between three separate bulletins in 2018. This is part of our ongoing work to improve bulletins. Other commentary from the latest ASHE data can be found on the following pages:
Back to table of contents2. Analysis of employee earnings
Median full-time weekly earnings increased 3.5% compared with 2017, to £569
Figure 1: Median full-time gross weekly earnings, UK, April 2006 to 2018
Source: Annual Survey of Hours and Earnings (ASHE) - Office for National Statistics
Notes:
- Footnotes applicable to all charts in this bulletin can be found in Section 5: Measuring these data.
Download this chart Median full-time weekly earnings increased 3.5% compared with 2017, to £569
Image .csv .xlsIn April 2018, median gross weekly earnings for full-time employees were £569, up 3.5% from £550 in 2017 (Figure 1). The 3.5% growth seen this year is the highest growth in earnings since 2008.
Adjusted for inflation, full-time gross weekly earnings increased by 1.2% compared with 2017
Figure 2: Per cent growth in median full-time gross weekly earnings, UK, April 2006 to 2018, adjusted for inflation
Source: Annual Survey of Hours and Earnings (ASHE) - Office for National Statistics
Notes:
- Footnotes applicable to all charts in this bulletin can be found in Section 5: Measuring these data.
Download this chart Adjusted for inflation, full-time gross weekly earnings increased by 1.2% compared with 2017
Image .csv .xlsAdjusted for inflation, weekly earnings increased by 1.2% compared with 2017 (Figure 2) (the Consumer Prices Index including owner occupiers’ housing costs (CPIH) rose by 2.2% in the year to April 2018).
Overall, earnings adjusted for inflation in 2018 were at a similar level to 2011, meaning that wages have increased at approximately the same rate as inflation over that period. However, the level in 2018 was 3.7% lower than in 2008, prior to the financial crisis.
2018 was the first time since 2012 that full-time wages rose by a larger percentage than part-time wages
Figure 3: Growth in median gross weekly earnings, UK, April 2006 to 2018
Source: Annual Survey of Hours and Earnings (ASHE) - Office for National Statistics
Notes:
- Footnotes applicable to all charts in this bulletin can be found in Section 5: Measuring these data.
Download this chart 2018 was the first time since 2012 that full-time wages rose by a larger percentage than part-time wages
Image .csv .xlsWhereas median gross weekly earnings for full-time employees grew 3.5% in 2018, the median for part-time employees grew by 2.9% (Figure 3). This is the first time since 2012 that full-time growth in the median has been larger than part-time.
This may be impacted by average full-time total paid hours increasing 0.3% in 2018 compared with 2017, while part-time total paid hours decreased by 1.2%. Mean total paid hours for part-time jobs in 2018 (18 hours) was the lowest since the time series began in 1997 (Figure 4).
Warning
Caution should be taken when drawing any conclusion from comparisons across the time series because ASHE was the subject of a discontinuity in 2011 when new occupation codes were introduced. An article published in 2017 gives an estimate of the impact of this change on wage estimates. Similar discontinuities in the time series were present in 2004 and 2006.
Figure 4: Mean full-time and part-time paid hours, UK, April 1997 to April 2018
Source: Annual Survey of Hours and Earnings (ASHE) - Office for National Statistics
Notes:
- Footnotes applicable to all charts in this bulletin can be found in Section 5: Measuring these data.
Download this chart Figure 4: Mean full-time and part-time paid hours, UK, April 1997 to April 2018
Image .csv .xls
Median earnings among people not moving jobs grew by 5.2%
Figure 5: Annual percentage change in median full-time gross weekly earnings for all employees and those in continuous employment, UK, April 2005 to 2018
Source: Annual Survey of Hours and Earnings (ASHE) - Office for National Statistics
Notes:
- Footnotes applicable to all charts in this bulletin can be found in Section 5: Measuring these data.
Download this chart Median earnings among people not moving jobs grew by 5.2%
Image .csv .xlsThe median gross weekly earnings for continuously employed full-time jobs in 2018 were 5.2% higher than the median in 2017 (Figure 5). This is higher than the growth for all full-time employees, a pattern that is consistent with previous years. Of all full-time employees, 81% are classed as continuously employed.
The continuously employed can experience pay increases due to factors such as progression through a pay scale, entitlement to a higher minimum wage, and pay settlements. An article titled Understanding average earnings for the continuously employed, published in 2015, gives further guidance on how to interpret these statistics.
Private sector earnings increased faster than public sector earnings for the third year running
Figure 6: Gross weekly private sector earnings as a proportion of public sector earnings for full-time employees for the mean and median, UK, April 1997 to 2018
Source: Annual Survey of Hours and Earnings (ASHE) - Office for National Statistics
Notes:
- Footnotes applicable to all charts in this bulletin can be found in Section 5: Measuring these data.
Download this chart Private sector earnings increased faster than public sector earnings for the third year running
Image .csv .xlsPrivate sector median earnings were approximately 85% of public sector earnings between 2010 and 2015, but have now risen to nearly 90% (Figure 6). Private sector earnings increased by 3.5% from 2017 compared with a 2.3% increase for public sector earnings.
Private sector mean earnings were 101% of public sector earnings in 2018, the first time the mean has been higher for the private sector since 2003. The difference between mean and median comparisons reflects different pay distributions, with more very high earners in the private sector.
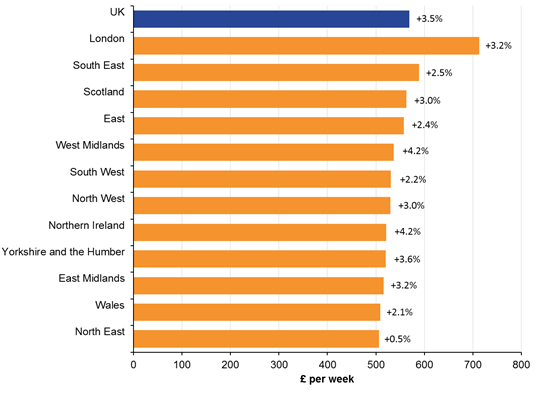
Increased polarisation of pay between the highest earning regions and the lowest
Figure 7: Median full-time gross weekly earnings and percentage change from previous year, by workplace regions and countries, UK, April 2018
Source: Annual Survey of Hours and Earnings (ASHE) - Office for National Statistics
Notes:
- Footnotes applicable to all charts in this bulletin can be found in Section 5: Measuring these data.
Download this image Increased polarisation of pay between the highest earning regions and the lowest
.png (31.9 kB) .xlsx (48.8 kB)
In April 2018, London topped the regional list for median earnings for full-time employees by place of work, at £713 per week. The median here is £124 more per week more than the next highest, the South East (£589), and £144 more than the median for the whole of the UK (£569) (Figure 7). The high pay in London reflects a high proportion of its labour force being employed in high-paying industries and occupations, and will also be impacted by allowances for some employees working in the capital.
Among the countries of the UK , long-term pay growth has been highest in Scotland and lowest in Wales. Median pay for full-time workers was 87% higher in Scotland than it was in 1997, whereas in Wales it was 69% higher. This is illustrated in Figure 8 where the data is indexed to 1997.
Figure 8: Index of median gross weekly earnings for full-time employees by place of work, UK, April 1997 to 2018 (1997=100)
Source: Annual Survey of Hours and Earnings (ASHE) - Office for National Statistics
Notes:
- Footnotes applicable to all charts in this bulletin can be found in Section 5: Measuring these data.
Download this chart Figure 8: Index of median gross weekly earnings for full-time employees by place of work, UK, April 1997 to 2018 (1997=100)
Image .csv .xlsFigure 9: Median gross weekly earnings for full-time employees for all local authorities by place of work, in Great Britain
Embed code
In April 2018, the City of London had the highest gross weekly earnings for full-time employees (£1,054) and Rother had the lowest (£427). The interactive chart in Figure 9 allows you to view median pay levels in all local authorities. It shows general consistency in pay levels within regions, but with some notable exceptions, for example, Copeland, which had high median pay despite being in a region with low pay and Redbridge, which had the opposite profile.
Median weekly earnings for full-time employees peaked at age range 40 to 49 years for men and 30 to 39 years for women
Figure 10: Median full-time gross weekly earnings by sex and age group, UK, April 2018
Source: Annual Survey of Hours and Earnings (ASHE) - Office for National Statistics
Notes:
- Footnotes applicable to all charts in this bulletin can be found in Section 5: Measuring these data.
Download this chart Median weekly earnings for full-time employees peaked at age range 40 to 49 years for men and 30 to 39 years for women
Image .csv .xlsFull-time gross weekly earnings peaked at ages 40 to 49 years for men (£708) and ages 30 to 39 years for women (£575) in April 2018 (Figure 10). The subsequent decrease in median earnings for both sexes in the older age groups is not explained by a decrease in hours; Figure 11 shows total paid hours remained fairly constant in the older age groups.
Figure 11: Median full-time total paid hours by age group and sex, UK, April 2018
Source: Annual Survey of Hours and Earnings (ASHE) - Office for National Statistics
Notes:
- Footnotes applicable to all charts in this bulletin can be found in Section 5: Measuring these data.
Download this chart Figure 11: Median full-time total paid hours by age group and sex, UK, April 2018
Image .csv .xls
Earnings growth was highest in 2018 in the lowest-paid occupations
Figure 12: Median full-time gross weekly earnings and percentage growth between April 2017 and 2018, by occupation group, UK

Source: Annual Survey of Hours and Earnings (ASHE) - Office for National Statistics
Notes:
- Footnotes applicable to all charts in this bulletin can be found in Section 5: Measuring these data.
Download this image Earnings growth was highest in 2018 in the lowest-paid occupations
.png (45.3 kB) .xlsx (48.0 kB)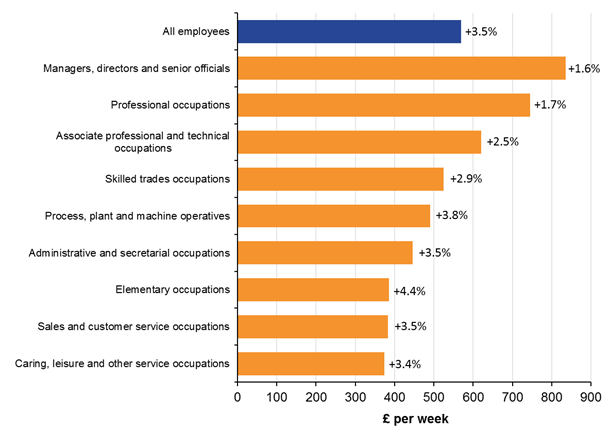
In April 2018, the occupation group with the highest median weekly earnings for full-time employees was managers, directors and senior officials, at £835. This was £266 higher than the UK as a whole. Caring, leisure and other service occupations was the lowest-paid group, at £374 per week. The largest growths in full-time median weekly earnings compared with 2017 were seen in elementary occupations (increased by 4.4%) and the process, plant and machine operatives occupations (3.8%) (Figure 12).
The larger increases at the lower-earning occupations were likely to have been driven by the increase in the National Minimum Wage and National Living Wage rates of hourly pay in April 2018.
The highest-earning occupation was chief executives and senior officials (£97,083 median full-time annual gross pay)
Figure 13: Annual full-time gross pay by occupation, UK, April 2018
Embed code
The interactive chart in Figure 13 allows you to compare earnings across occupations, in terms of annual pay.
Overtime hours have reduced from an average of 2.2 hours per week in 1997 to 1 hour in 2018
Figure 14: Components of mean full-time weekly paid hours of work, UK, April 1997 to April 2018
Source: Annual Survey of Hours and Earnings (ASHE) - Office for National Statistics
Notes:
- Footnotes applicable to all charts in this bulletin can be found in Section 5: Measuring these data.
Download this chart Overtime hours have reduced from an average of 2.2 hours per week in 1997 to 1 hour in 2018
Image .csv .xlsSince 1997, basic paid hours have increased slightly from 37.8 to 38.2 hours per week, whereas overtime hours have decreased, falling from 2.2 to 1.0 hours. The sector with the highest mean number of overtime hours per employee per week in 2018 was process, plant and machine operatives (3.3 hours).
Back to table of contents3. Earnings data
A detailed set of data tabulations containing employee earnings estimates from the Annual Survey of Hours and Earnings (ASHE) broken down by aspects such as age, region, occupation and industry are available.
Annual Survey of Hours and Earnings: 2018 provisional and 2017 revised results
Released: 25 October 2018
The tables show employee earning estimates as outlined in the ASHE guide to tables.
4. Glossary
Full-time and part-time
Full-time is defined as employees working more than 30 paid hours per week (or 25 or more for the teaching professions).
Continuously employed
The “continuously employed” group is made up of employees who appear in consecutive Annual Survey of Hours and Earnings (ASHE) samples, have a weekly earnings observation in both periods and are classified by their employer as being in the same job for at least 12 months in the second period. ASHE indicates that 81% of the full-time workforce remained in the same job between 2017 and 2018. However, the analysis is based on those employees who gave a response in both years, which reduces the proportion to 54%.
CPIH
The Consumer Prices Index including owner occupiers' housing costs (CPIH) is the most comprehensive measure of inflation. It extends the Consumer Prices Index (CPI) to include a measure of the costs associated with owning, maintaining and living in one's own home, known as owner occupiers' housing costs (OOH), along with Council Tax.
Standard Occupational Classification (SOC)
The Standard Occupational Classification (SOC) is a common classification of occupational information for the UK.
National Minimum Wage and National Living Wage
The National Minimum Wage (NMW) is a minimum amount per hour that most workers in the UK are entitled to be paid. There are different rates of minimum wage depending on a worker's age and whether they are an apprentice. The NMW applies to employees aged between 16 and 24 years. The government’s National Living Wage (NLW) was introduced on 1 April 2016 and applies to employees aged 25 years and over.
On the ASHE reference date in April 2018, the NMW and NLW rates were:
- £7.83 for employees aged 25 years and over
- £7.38 for employees aged 21 to 24 years
- £5.90 for employees aged 18 to 20 years
- £4.20 for employees aged 16 to 17 years
- £3.70 for apprentices aged 16 to 18 years and those aged 19 years or over who are in the first year of their apprenticeship
5. Measuring this data
All estimates for 2018 are provisional and relate to the reference date 16 April 2018. Data from the 2017 survey have been subject to small revisions since the provisional estimates were published on 26 October 2017. For the charts in this bulletin, the following notes apply:
Employees on adult rates, pay unaffected by absence.
Full-time defined as employees working more than 30 paid hours per week (or 25 or more for the teaching professions).
Consumer Prices Index including owner occupiers' housing costs (CPIH) figures are based on the All Items Consumer Prices Index (including owner occupiers' housing costs) of inflation for April (Figure 2).
Dashed lines represent discontinuities in 2011 Annual Survey of Hours and Earnings (ASHE) estimates (Figure 3).
Dashed lines represent discontinuities in 2004, 2006 and 2011 ASHE estimates (Figure 6).
Includes all employees aged 16 to 17 years and employees aged 18 years and over on adult rates, pay unaffected by absence (Figure 10).
Occupations as defined by the Standard Occupational Classification 2010 (Figure 12).
Estimates of the mean include zero responses, whereas estimates of the median exclude zero responses (Figure 14).
A guide to interpreting ASHE estimates is available and addresses common questions about the data.
Further information about ASHE can be found in quality and methodology on our guidance and methodology page and in the Quality and Methodology Information (QMI) report.
Back to table of contents6. Strengths and limitations
The strengths and limitations of the Annual Survey of Hours and Earnings (ASHE) can be found in the Quality and Methodology Information report and the Guide to sources of data of earnings and income.
Back to table of contents7. More about earnings
Earnings and working hours
ONS employee earnings and hours worked home page.
Is pay higher in the public or private sector?
Released: 16 November 2017
How has public and private sector pay changed over the last 10 years?
An overview of and comparison between Annual Survey of Hours and Earnings (ASHE) and Average Weekly Earnings (AWE): 2017
Released: 14 September 2017
An overview of the Annual Survey of Hours and Earnings and Average Weekly Earnings, comparing the differences between the two headline outputs.
8. You may also be interested in
UK labour market
Estimates of employment, unemployment, economic inactivity and other employment-related statistics for the UK.
Analysis of factors affecting earnings using Annual Survey of Hours and Earnings: 2016
The results of two statistical models that explore the relationship between mean hourly earnings excluding overtime and a range of independent variables, based on Annual Survey of Hours and Earnings 2016 provisional results data. There is a particular focus on earnings differences between the public and the private sector.
Index of labour costs per hour, UK
Changes in the cost of employing labour, analysed by sector and industry.