Table of contents
- Main points
- Statistician’s comment
- Things you need to know about this release
- Average earnings
- Distribution of earnings
- Low and high pay
- Gender pay differences
- Public and private sector pay
- Regional earnings
- Earnings by age group
- Earnings by occupation
- Earnings by business size band
- The make-up of earnings
- Hours paid
- Links to related statistics
- Quality and methodology
1. Main points
In April 2017, median gross weekly earnings for full-time employees in the UK were £550, up 2.2% from £539 in 2016.
The 2.2% growth seen this year is the joint highest since the economic downturn in 2008 (matching that seen in 2013 and 2016). Similarly the median gross weekly earnings for part-time employees also increased, from £177 in 2016 to £182 in 2017 (2.9%).
Adjusted for inflation, full-time workers’ weekly earnings decreased by 0.4% compared with 2016. This is the first time since 2014 that there has been a fall in this measure and reflects a higher level of inflation in April 2017 (2.6%) compared with recent years, for example, in April 2016 inflation was 0.7%.
Earnings (not adjusted for inflation) in 2017 rose by more among the lowest paid workers. Earnings at the tenth percentile for full-time workers rose by 3.5% compared with 2016 and the percentage of full-time workers earning less than two-thirds of median hourly earnings has fallen from 19.4% in 2016 to 18.4%.
In April 2017, the gender pay gap based on median hourly earnings for full-time employees decreased to 9.1%, from 9.4% in 2016. This is the lowest since the survey began in 1997.
Median weekly earnings for full-time employees in the private sector were £532 (up 2.8% on 2016) compared with £599 (up 0.9%) for the public sector. While private sector median earnings were down to around 85% of public sector earnings between 2010 and 2015, the proportion has risen in 2016 and 2017 to 89% this year.
Median weekly earnings for full-time workers are highest in London (£692) and lowest in Wales, North East, Northern Ireland, Yorkshire and The Humber, and East Midlands (all approximately £500). In 2017, the median rate grew most in East Midlands (3.4%) and least in Yorkshire and The Humber (0.8%).
Back to table of contents2. Statistician’s comment
“Median earnings for full-time employees in the UK were £550 in April 2017. This year saw the joint highest rise since the economic downturn in 2008, in cash terms. However, higher inflation meant real earnings were down overall on the year for the first time since 2014. This wasn’t the case for everyone, though – the lowest paid 10% of workers and those in some regions like the East Midlands still saw real increases while other areas saw decreases.
“The gender pay gap fell to 9.1% among full-timers, the lowest since the present survey began in 1997.”
Roger Smith, Office for National Statistics Earnings Branch
Back to table of contents3. Things you need to know about this release
This bulletin presents analyses from the Annual Survey of Hours and Earnings (ASHE), which is the most detailed and comprehensive source of earnings information in the UK. ASHE is based on a 1% sample of employee jobs, drawn from HM Revenue and Customs Pay As You Earn (PAYE) records. Throughout this bulletin, the terms jobs and employees are used interchangeably.
Our headline measure of earnings from ASHE is median weekly earnings for full-time employees. This measure is the main focus of this release, but discussion of hourly earnings and earnings for part-time employees is also included for comparison. Figures are presented in terms of gross pay (that is, before tax, National Insurance and other deductions) in current prices, unless otherwise stated.
This bulletin contains provisional estimates from the 2017 survey. The 2016 estimates have been subject to small revisions since the provisional publication on 26 October 2016. The full suite of datasets from the 2017 ASHE and from all previous years back to 1997 is available on our website.
The figures in ASHE relate to the reference date of 26 April 2017 and thus capture the early effects of the changes to the National Living Wage (£7.50) for employees aged 25 and over on 1 April 2017, as well as the changes to the National Minimum Wage of other age groups (£7.05 for those aged 21 to 24, £5.60 for those aged 18 to 20, £4.05 for those aged under 18 and £3.50 for apprentices aged under 19 or in the first year of their apprenticeship), which also occurred on the same date. For more information about those paid below the National Minimum Wage or National Living Wage see the low pay datasets.
Further information about ASHE can be found in the quality and methodology section of this bulletin, on our guidance and methodology page and in the Quality and Methodology Information (QMI) report.
Common pitfalls in interpreting the series
The headline statistics for ASHE are based on the median rather than the mean. The median is the value below which 50% of employees fall. The median is used because the distribution of earnings is skewed, with more people earning lower salaries than higher salaries. When using the mean to calculate the average of a skewed distribution, it is highly influenced by those values at the upper end of the distribution and thus may not be truly representative of the average earnings of a typical person. By taking the middle value of the data after sorting in ascending order, the median avoids this issue and is consequently considered a better indicator of typical “average” earnings.
A common misconception of the headline ASHE figures is that they are measures of pay rises. However, ASHE is designed to estimate earnings of all employees in the economy at a single point in time and therefore measure the change in median pay, rather than the median of changes in pay. The ASHE figures can therefore be affected by changes in the composition of the workforce, which is the reason why average pay can increase without anyone having had a pay rise.
Methodological changes in 2004, 2006 and 2011 resulted in discontinuities in the ASHE time series; therefore care should be taken when making comparisons with earlier years.
Further information can be found in our guide to interpreting ASHE estimates.
Changes to this bulletin
In previous years, a separate low pay bulletin was published. However, after consultation with users, that bulletin has been ceased and an alternative measure of low pay has been incorporated into this main ASHE publication. The data tables previously linked to the low pay bulletin are now available as part of our suite of datasets.
This year we have also introduced gender pay gap versions of each one of our datasets. These will be available as part of our suite of datasets for each year back to 1997.
We constantly aim to improve our ASHE outputs and associated commentary. Please contact earnings@ons.gov.uk with any feedback or questions.
Back to table of contents4. Average earnings
Weekly earnings up 2.2% compared with 2016
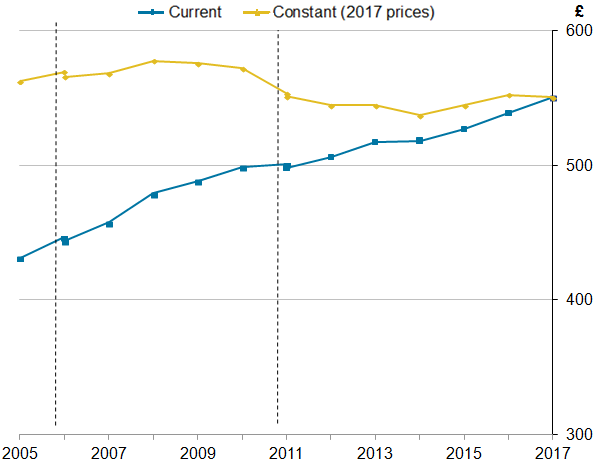
In April 2017, median gross weekly earnings for full-time employees in the UK were £550, up 2.2% from £539 in 2016. Historically, between 1997 (the first year for which Annual Survey of Hours and Earnings (ASHE) data are available) and 2008, growth was fairly steady, averaging approximately 4% each year. However, since the economic downturn of 2008 to 2009, growth has been slower, with the annual increase averaging 1.6% per year between 2009 and 2017. The 2.2% growth seen this year is the joint highest growth in earnings since the economic downturn (matching that seen in 2013 and 2016).
To understand changes in earnings in the context of inflation, historic data are adjusted using the Consumer Prices Index including owner occupiers' housing costs (CPIH). This gives a measure of the “real” value of earnings, with a decrease meaning that earnings growth is below inflation.
Adjusted for inflation, weekly earnings decreased by 0.4% compared with 2016 (the CPIH rose by 2.6% in the year to April 2017). This is the first time since 2014 that there has been a fall in real earnings. Figure 1 represents such falls through a downward direction in the year-to-year change in the “constant (2017) prices” series.
Figure 1 highlights that overall earnings adjusted for inflation in 2017 are at a similar level to 2011, meaning that wages have increased at approximately the same rate as inflation over that period.
However, the level in 2017 is 4.7% lower than in 2008, prior to the financial crisis. Caution should be taken when drawing any conclusion from this comparison because ASHE was the subject of a discontinuity in 2011 when new occupation codes were introduced. An article published in 2017 gives an estimate of the impact of this change on wage estimates.
Figure 1: Median full-time gross weekly earnings in current and constant (2017) prices, UK, April 2005 to 2017
Source: Annual Survey of Hours and Earnings (ASHE) - Office for National Statistics
Notes:
- Employees on adult rates, pay unaffected by absence.
- Full-time defined as employees working more than 30 paid hours per week (or 25 or more for the teaching professions).
- CPIH figures are based on the All Items Consumer Prices Index (including owner occupiers' housing costs) of inflation for April.
- Dashed lines represent discontinuities in 2006 and 2011 ASHE estimates.
- Axis does not start at zero
- 2017 data are provisional.
Download this image Figure 1: Median full-time gross weekly earnings in current and constant (2017) prices, UK, April 2005 to 2017
.png (16.5 kB) .xls (139.3 kB)
Median earnings among people not moving jobs grew at a lower rate than in previous years
The composition of the workforce collected in the ASHE sample changes from year-to-year, reflecting changes in the structure of the workforce. This can affect changes in median earnings. For example, creation of lower-paid jobs, or loss of highly-paid jobs, can both act to reduce the median.
One approach to removing this compositional effect is to look only at jobs in which the employee has been in the same post for at least one year (termed “continuous employment”). The change in median earnings for this continuously employed group shows how much a “typical” continuously employed person (that is, a person at the middle of the continuously employed distribution) in the current year is earning compared with the “typical” employee from the same group in the previous year.
This analysis shows consistently higher growth rates over time for the continuously employed group compared with all employees (as shown in Figure 2) and in April 2017 median earnings for full-time employees in this group were 3.4% higher than median earnings of full-time employees in April 2016.
Care should be taken not to interpret this change as necessarily typical of the change in wages experienced by the majority of the continuously employed group or the same person at the median of the distribution in either year. It should also be noted that the change in median earnings does not mean that half of the continuously employed received an increase in weekly earnings of more than 3.4% and half less than 3.4%. There will be a range of changes in earnings between years for continuously employed individuals.
The higher growth rate is not surprising because this group can experience pay increases due to factors such as progression through a pay scale, entitlement to a higher minimum wage and pay settlements. Therefore, of particular interest when looking at this group is the trend in their wage growth. Figure 2 highlights that the 3.4% growth in median earnings in this group is the joint lowest percentage increase since this analysis started in 2005. The slow-down in growth of the median may be due partly to factors like continued pay restraint for those continuously employed in the public sector and less switching of jobs than in previous years.
Conversely, given growth in median full-time earnings for the whole sample of workers has remained at around 2.2%, the impact of job composition changes (people entering the full-time employee labour market, changing jobs or leaving the employee labour market) has had a more positive/less negative impact on wage growth than in previous years.
An article titled Understanding Average Earnings for the Continuously Employed, published in 2015, gives further guidance on how to interpret these statistics. In addition, more information can be found in our guide to interpreting ASHE estimates. Analysis of earnings when workers are matched on an individual basis between years is available for 2016 ASHE data.
Figure 2: Annual percentage change in median full-time gross weekly earnings for all employees and those in continuous employment, UK, April 2005 to 2017
Source: Annual Survey of Hours and Earnings (ASHE) - Office for National Statistics
Notes:
- The “continuously employed” group is made up of employees who appear in consecutive ASHE samples, have a weekly earnings observation in both periods and are classified by their employer as being in the same job for at least 12 months in the second period. ASHE indicates that 82% of the full-time workforce remained in the same job between 2016 and 2017. However, the analysis is based on those employees who gave a response in both years, which reduces the proportion to 54%.
- Employees on adult rates, pay unaffected by absence.
- Full-time defined as employees working more than 30 paid hours per week (or 25 or more for the teaching professions).
- 2017 data are provisional.
Download this chart Figure 2: Annual percentage change in median full-time gross weekly earnings for all employees and those in continuous employment, UK, April 2005 to 2017
Image .csv .xlsStronger growth in earnings for women than men
In April 2017, men working full-time earned more than women on average (£592 per week compared with £494), with both seeing increases in median earnings compared with 2016 (2.4% and 2.7% respectively). The gap between men’s and women’s gross weekly earnings has remained relatively consistent from 1997 to 2017, at around £100, but this corresponds to a faster rate of increase for women than for men over this period (an 86% increase compared with 66% respectively), meaning that the gap has been closing in percentage terms.
While these results provide a useful measure of earnings trends for men and women, our preferred measure of the “gender pay gap” uses hourly earnings excluding overtime. This is discussed later in the gender pay gap section of this bulletin.
Stronger growth has been seen for part-time jobs than for full-time jobs, with median weekly gross earnings increasing by 2.9% (up £5) and 2.2% (up £12) respectively. Although part-time workers are more likely to be women than men, the higher growth in part-time wages doesn’t explain the higher overall pay growth for women than men. Figure 3 highlights that women’s pay grew similarly for both full-time and part-time employees, and it’s amongst men that part-time wages saw the largest growth (3.3%).
Figure 3: Median gross weekly earnings and percentage change from previous year, by sex and work pattern, UK, April 2017

Source: Annual Survey of Hours and Earnings (ASHE) - Office for National Statistics
Notes:
- Employees on adult rates, pay unaffected by absence.
- Full-time defined as employees working more than 30 paid hours per week (or 25 or more for the teaching professions).
- 2017 data are provisional.
- The axis for the gross weekly earnings is on the left-hand side and the axis for the percentage change from the previous year is on the right-hand side.
Download this image Figure 3: Median gross weekly earnings and percentage change from previous year, by sex and work pattern, UK, April 2017
.png (47.4 kB) .xls (49.7 kB)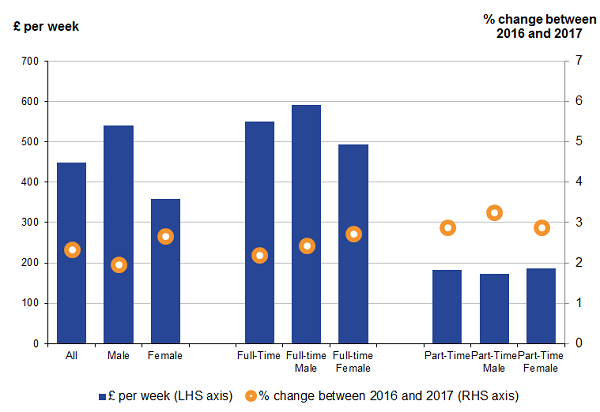
When assessing earnings growth rates, particularly among part-time employees, it’s important to acknowledge that an increase may be driven by hourly pay rates (which can be driven by pay rises or a different profile of jobs), more hours worked per week, or both. In 2017, the median hourly pay for part-time employees was 2.4% higher than in 2016. Comparing part-time employees’ 2.9% growth in median weekly earnings with this 2.4% hourly pay increase suggests that median weekly earnings rose primarily because of higher pay rates within the set of part-time jobs filled by employees in 2017 compared with 2016.
Conversely, for full-time employees the median average hourly rate grew by 2.5% in 2017. This is higher than the 2.2% median weekly earnings growth for these workers, in part due to a slight decrease in hours worked, from 39.2 to 39.1 hours.
Back to table of contents5. Distribution of earnings
Focusing solely on the median hides some interesting trends for the lowest and highest paid jobs. Figure 4 shows the percentage change along the distribution (at five percentile intervals) of full-time and part-time gross weekly earnings between April 2016 and April 2017.
For both full-time and part-time employees, but in particular the latter, the lower percentiles (that is, those earning least) have larger growth than the higher percentiles.
Between 2016 and 2017, the largest increase for full-time employees was at the bottom end of the distribution (fifth percentile: 3.6%) whilst the top end of the distribution (95th percentile: 2.6%) was closer to the growth seen at the median of the distribution (2.2%). For part-time employees, the largest increase was seen in the 10th percentile (an increase of 5.0%); this is compared with the median growth of 2.9%. Note that the 10th percentile means that 10% of the population earn under this amount and 90% of the population earn above this amount. As for full-time employees, the weekly pay distribution for part-time employees showed stronger growth for the lowest earners than for the highest earners.
Generally, though, pay for part-time employees increased more strongly at all points of the pay distribution than that for full-time employees, except for the top 20% of the distribution (Figure 4).
The reason for this increased growth at the bottom of the distribution is likely to be due to the change in the National Living Wage (from £7.20 to £7.50). The National Living Wage falls in the fifth percentile.
Figure 4: Percentage change to the distribution of full-time and part-time gross weekly earnings, UK, 2017
Source: Annual Survey of Hours and Earnings (ASHE) - Office for National Statistics
Notes:
- Employees on adult rates, pay unaffected by absence.
- Full-time defined as employees working more than 30 paid hours per week (or 25 or more for the teaching professions).
- 2017 data are provisional.
Download this chart Figure 4: Percentage change to the distribution of full-time and part-time gross weekly earnings, UK, 2017
Image .csv .xls6. Low and high pay
In April 2017, there were 342,000 employees aged 16 and over who were paid below the National Minimum Wage or National Living Wage. As stated earlier, we previously published a separate bulletin which focused on this measure of low pay. Following consultation, we no longer publish that bulletin; however, the data are still produced and are available in our low pay datasets.
Low pay (and high pay) is often considered in relative terms. In this section of the bulletin we use the Organisation for Economic Co-operation and Development (OECD) definitions of low pay and high pay: low pay is defined as the value that is two-thirds of median hourly earnings and high pay is defined as the value that is 1.5 times median hourly earnings. For example, median hourly earnings for full-time employees in 2017 is £14.00, therefore low pay employees are considered to be anyone earning below two-thirds of £14.00, which is £9.33 and high pay full-time employees are those earning anything above 1.5 times £14.00, which is £21.00.
Figure 5 shows that, based on this definition, the number of low-paid jobs remained relatively stable until 2015, when it began to decrease. Low-paid jobs made up 18.4% of employee jobs in 2017, down from 19.4% in 2016 and 20.5% in 2015. Therefore the proportion of low-paid jobs has dropped by over two percentage points since 2015. The National Living Wage was introduced in April 2016 and is likely to be one of the main drivers behind the reduction in proportion of low-paid jobs in the past two years.
The proportion of high-paid jobs has remained relatively stable since 1997, ranging between 25.2% (1997) and 26.4% (2010, 2012) of total employee jobs.
Figure 5: Percentage of high-, middle- and low-paid full-time jobs, whole economy, UK, 1997 to 2017
Source: Annual Survey of Hours and Earnings (ASHE) - Office for National Statistics
Notes:
- Employees on adult rates, pay unaffected by absence.
- Full-time defined as employees working more than 30 paid hours per week (or 25 or more for the teaching professions).
- Low pay is defined as the value that is two-thirds of median hourly earnings and high pay is defined as the value that is 1.5 times median hourly earnings.
- 2017 data are provisional.
Download this chart Figure 5: Percentage of high-, middle- and low-paid full-time jobs, whole economy, UK, 1997 to 2017
Image .csv .xls7. Gender pay differences
The gender pay gap is calculated as the difference between average hourly earnings (excluding overtime) of men and women as a proportion of average hourly earnings (excluding overtime) of men’s earnings. For example, a 4.0% gender pay gap denotes that women earn 4.0% less, on average, than men. Conversely, a negative 4.0% gender pay gap denotes that women earn 4.0% more, on average, than men. Including overtime can skew the results because men work relatively more overtime than women and using hourly earnings better accounts for the fact that men work on average more hours per week than women.
In April 2017, the gender pay gap (for median earnings) for full-time employees decreased to 9.1%, from 9.4% in 2016 (Figure 6). This is the lowest since the survey began in 1997, where the gender pay gap was 17.4%, although the gender pay gap has changed relatively little in recent years.
For part-time employees separately, we see a different pattern, whereby women are paid more per hour, on average than men. However, as with the full-time gender pay gap, this part-time gender pay gap moved closer to zero, from negative 6.1% in April 2016 to negative 5.1% in April 2017, as earnings for part-time men increased by more than for women.
The net impact of both the full-time and part-time gender pay gaps moving closer to zero, together with an increase in the proportion of employees working full-time versus part-time (source: Labour Market Statistics table A01(3), period March to May 2016 and March to May 2017), is a marginal increase in the gap for all employees, from 18.2% in 2016 to 18.4% in 2017. Similar year-on-year increases have occurred in previous years, for example, in 2013 and 2015, but the longer-term trend is downward, from 27.5% in 1997 and 21.9% in 2007.
Given the strong influence of the balance between full-time and part-time employees, the majority of detailed analyses of the gender pay gap in this bulletin are presented for full-time employees alone. However, there is not one single measure that adequately deals with the complex issue of gender pay differences so figures for full-time and part-time employees combined (as well as part-time employees alone) are included in the gender pay gap datasets.
It should be noted that the gender pay gap figures presented in this bulletin do not show differences in rates of pay for comparable jobs, as they are affected by factors such as the proportion of men and women working part-time or in different occupations. For example, a higher proportion of women work in occupations such as administration and caring, which tend to offer lower salaries.
An explanation for the difference in the gender pay gap estimate between full-time and all employees can be found in the guide to interpreting ASHE estimates.
Figure 6: Gender pay gap for median gross hourly earnings (excluding overtime), UK, April 1997 to 2017

Source: Annual Survey of Hours and Earnings (ASHE) - Office for National Statistics
Notes:
- Employees on adult rates, pay unaffected by absence.
- Figures represent the difference between men's and women's hourly earnings as a percentage of men's earnings.
- Full-time defined as employees working more than 30 paid hours per week (or 25 or more for the teaching professions).
- Dashed lines represent discontinuities in 2004, 2006 and 2011 ASHE estimates.
- 2017 data are provisional.
Download this image Figure 6: Gender pay gap for median gross hourly earnings (excluding overtime), UK, April 1997 to 2017
.png (16.4 kB) .xls (113.2 kB)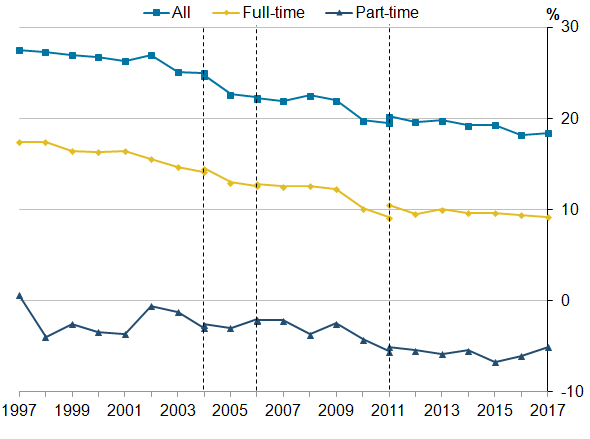
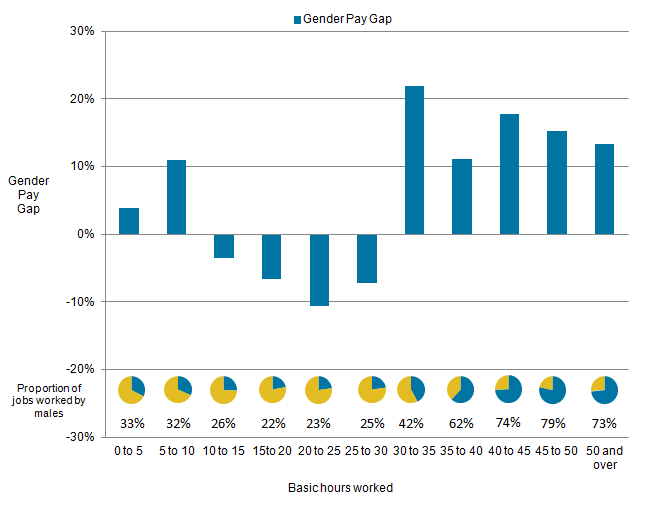
Investigating the difference in the gender pay gap between part-time and full-time employees further by the number of paid hours worked (shown in Figure 7) reveals the transition between the gender pay gap favouring women over men and the other way around. Typically, more men are employed in jobs that involve working a higher number of hours and for these jobs, it can be seen that the gender pay gap is in favour of men. However, for jobs where the number of paid hours worked per week by an employee is between 10 and 30, more women work in these jobs and the gender pay gap is in favour of women.
Figure 7: Gender pay gap for median gross hourly earnings (excluding overtime) and percentage of males, by number of basic paid hours worked, UK, April 2017
Source: Annual Survey of Hours and Earnings (ASHE) - Office for National Statistics
Notes:
- Employees on adult rates, pay unaffected by absence.
- Figures represent the difference between men's and women's hourly earnings as a percentage of men's earnings.
- 2017 data are provisional.
- Each range is inclusive of the end point but not the start point, i.e. 10-15 includes those working exactly 15 hours but not those working exactly 10 hours.
Download this image Figure 7: Gender pay gap for median gross hourly earnings (excluding overtime) and percentage of males, by number of basic paid hours worked, UK, April 2017
.png (17.4 kB) .xls (111.1 kB)
Figure 8 examines the gender pay gap for highest and lowest earners from 1997 to 2017. For those earning in the top decile, the gap for full-time employees has remained largely consistent, fluctuating around approximately 20% (18.2% in 2017). For those earning in the bottom decile the gap has narrowed over the long-term, to 5.0% in April 2017. This is likely to be connected to the introduction of the National Living Wage, as women are more likely to work in lower-paid occupations. For example, the lowest-paid occupation group – caring, leisure and other service occupations – has a higher proportion of full-time employees who are women (78%, source: Labour Force Survey, Quarter 2, EMP04).
Figure 8: Gender pay gap for median gross hourly earnings (excluding overtime) for full-time employees at selected deciles, UK, April 1997 to 2017

Source: Annual Survey of Hours and Earnings (ASHE) - Office for National Statistics
Notes:
- Employees on adult rates, pay unaffected by absence.
- Figures represent the difference between men's and women's hourly earnings as a percentage of men's earnings.
- Full-time defined as employees working more than 30 paid hours per week (or 25 or more for the teaching professions).
- Dashed lines represent discontinuities in 2004, 2006 and 2011 ASHE estimates.
- 2017 data are provisional.
Download this image Figure 8: Gender pay gap for median gross hourly earnings (excluding overtime) for full-time employees at selected deciles, UK, April 1997 to 2017
.png (16.8 kB) .xls (218.6 kB)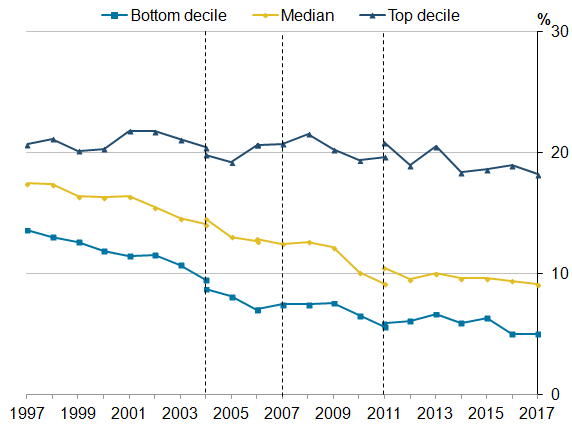
8. Public and private sector pay
Median gross weekly earnings for full-time employees in the public sector have been higher than for the private sector since the start of the series in 1997. Median weekly private sector earnings for full-time employees were £532 in April 2017, compared with £599 for the public sector. The public sector is defined as central government, local authorities and public corporations, and the private sector includes private companies, sole proprietors and partnerships.
While private sector median earnings were approximately 85% of public sector earnings between 2010 and 2015, there has been a larger rise in private sector earnings in the last two years. Private sector earnings increased by 2.8% this year compared with a 0.9% increase for public sector earnings. This has resulted in the proportion rising to 89%, showing that private and public sector earnings have closed further in the past year (Figure 9). At the top decile, earnings in the private sector reached over 110% of public sector earnings, for the first time since before the economic downturn in 2008. There has been a similar increase in private sector earnings at the bottom decile; this is likely to be impacted by the introduction of the National Living Wage, with a larger proportion of private sector workers in the occupations affected.
Figure 9: Gross weekly private sector earnings as a proportion of public sector earnings for full-time employees at selected deciles, UK, April 1997 to 2017

Source: Annual Survey of Hours and Earnings (ASHE) - Office for National Statistics
Notes:
- Employees on adult rates, pay unaffected by absence.
- Full-time defined as employees working more than 30 paid hours per week (or 25 or more for the teaching professions).
- Dashed lines represent discontinuities in 2004, 2006 and 2011 ASHE estimates.
- 2017 data are provisional.
- The proportion (y-axis) does not start at 0%.
Download this image Figure 9: Gross weekly private sector earnings as a proportion of public sector earnings for full-time employees at selected deciles, UK, April 1997 to 2017
.png (20.1 kB) .xls (125.4 kB)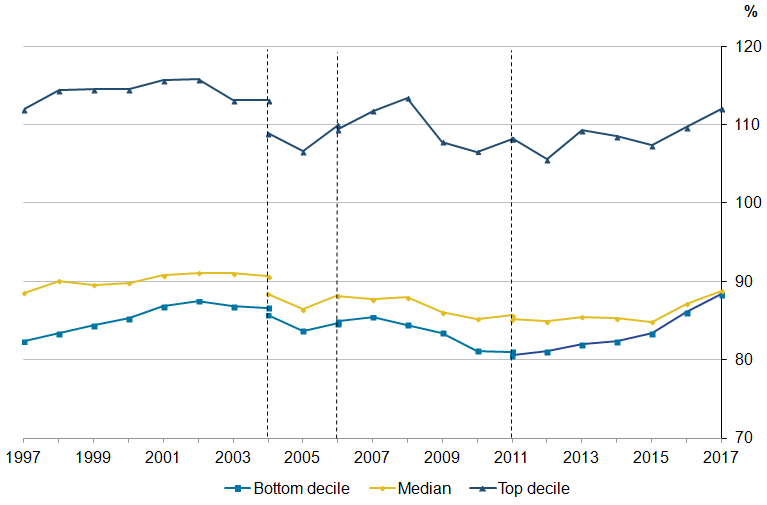
It should be noted that the public and private sectors have workforces that are composed quite differently. Consequently, differences in weekly earnings do not reveal differences in rates of pay for comparable jobs. For example, many of the lowest-paid occupations, such as bar and restaurant staff, hairdressers, elementary sales occupations and cashiers, exist primarily in the private sector, while there are a larger proportion of graduate-level and professional occupations in the public sector. A more detailed exploration of the difference between public and private sector pay is published annually (latest publication based on Annual Survey of Hours and Earnings (ASHE) 2016, to be repeated using ASHE 2017 in early 2018) by Office for National Statistics.
What is the gender pay gap in the public and private sectors?
The gender pay gap for full-time employees in the private sector decreased from 16.7% in 2016 to 15.9% in 2017, the lowest since the series began in 1997, continuing the long-term downward trend (Figure 10). The gender pay gap in the public sector increased from 11.1% to 13.1%; this is the highest gender pay gap seen in the public sector since 1999.
Note that any changing composition of the public and private sectors from year-to-year will influence the gender pay gap figures presented. For example, in a given sector, creation of jobs in higher-paying occupations with a high proportion of female employees would act to reduce the gap.
Figure 10: Gender pay gap for median full-time hourly earnings (excluding overtime) for public and private sectors, UK, April 1997 to 2017

Source: Annual Survey of Hours and Earnings (ASHE) - Office for National Statistics
Notes:
- Employees on adult rates, pay unaffected by absence.
- Gender pay gap is defined as the difference between men’s and women’s hourly earnings as a percentage of men’s earnings.
- Full-time defined as employees working more than 30 paid hours per week (or 25 or more for the teaching professions).
- Dashed lines represent discontinuities in 2004, 2006 and 2011 ASHE estimates.
- 2017 data are provisional.
Download this image Figure 10: Gender pay gap for median full-time hourly earnings (excluding overtime) for public and private sectors, UK, April 1997 to 2017
.png (13.9 kB) .xls (160.3 kB)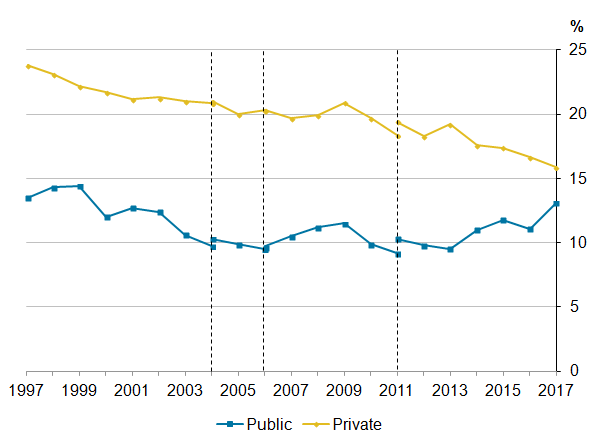
9. Regional earnings
In April 2017, London topped the regional list for median earnings for full-time employees by place of work, at £692 per week. Employees here earned £118 more per week, on average, than the next highest, the South East (£575) and £142 more than the median for the whole of the UK (£550). The high pay in London is due largely to a high proportion of its labour force being employed in high-paying industries and occupations, and also because many employees are entitled to allowances for working in the capital.
The regional variation in full-time gross weekly earnings can be seen in Figure 11, which also includes percentage growth. The East Midlands (increased by 3.4%), London (3.2%) and the East of England (3.2%) have increased the most, while Yorkshire and The Humber (0.8%), Wales (1.0%) and the West Midlands (1.0%) have increased the least over the past year.
Figure 11: Median full-time gross weekly earnings and percentage change from previous year, by region, UK, April 2017

Source: Annual Survey of Hours and Earnings (ASHE) - Office for National Statistics
Notes:
- Employees on adult rates, pay unaffected by absence.
- Full-time defined as employees working more than 30 paid hours per week (or 25 or more for the teaching professions).
- 2017 data are provisional.
Download this image Figure 11: Median full-time gross weekly earnings and percentage change from previous year, by region, UK, April 2017
.png (59.1 kB) .xls (119.3 kB)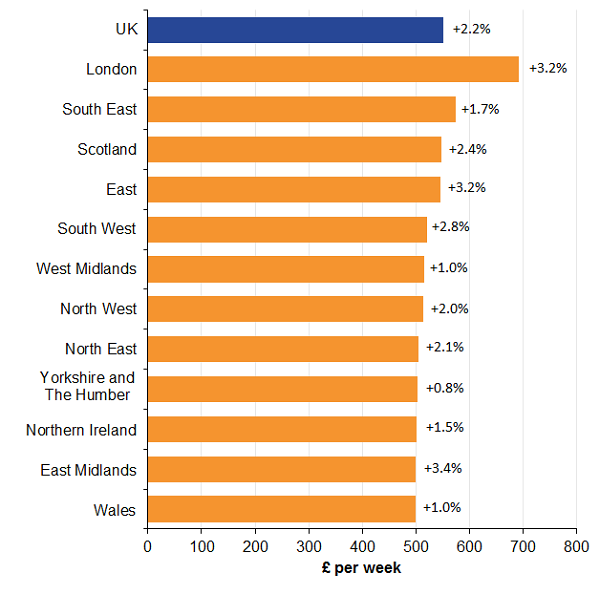
The regional ranking order since the series began in 1997 has remained fairly consistent for the highest-earning regions, with London and the South East consistently topping the list. Below this, it is notable that Scotland, showing strong growth in full-time earnings since 1997, has moved from eighth highest gross weekly earnings to third from 2012 onwards.
The strong rise of earnings in Scotland can be seen in Figure 12, which plots an index of growth from 1997 for the constituent countries of the UK, and London. Conversely, earnings in Wales have risen slower than the other countries of the UK. Growth rates in London are notable for rising strongly up to 2011 and then more weakly until 2016, before the 3.2% increase in 2017.
Figure 12: Index of median gross weekly earnings for full-time employees by country and the London region, UK, April 1997 to 2017
(1997 = 100)

Source: Annual Survey of Hours and Earnings (ASHE) - Office for National Statistics
Notes:
- Employees on adult rates, pay unaffected by absence.
- Figures represent the difference between men's and women's hourly earnings as a percentage of men's earnings.
- Full-time defined as employees working more than 30 paid hours per week (or 25 or more for the teaching professions).
- Dashed lines represent discontinuities in 2004, 2006 and 2011 ASHE estimates.
- 2017 data are provisional.
- Figures rounded to one decimal place.
Download this image Figure 12: Index of median gross weekly earnings for full-time employees by country and the London region, UK, April 1997 to 2017
.png (31.9 kB) .xls (213.0 kB)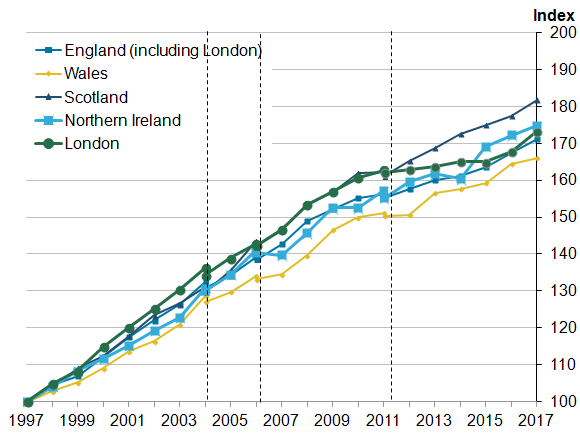
At the local authority level, earnings vary significantly. In April 2017, full-time employees working in the City of London had the highest median gross weekly earnings (£989) and those working in Rossendale (North West) had the lowest (£399). Figure 13 is a map showing the full-time gross weekly earnings for people working in each local authority district.
Figure 13: Median full-time gross weekly earnings by place of work, Great Britain, April 2017
Local authority districts

Download this image Figure 13: Median full-time gross weekly earnings by place of work, Great Britain, April 2017
.png (389.9 kB) .xls (64.0 kB)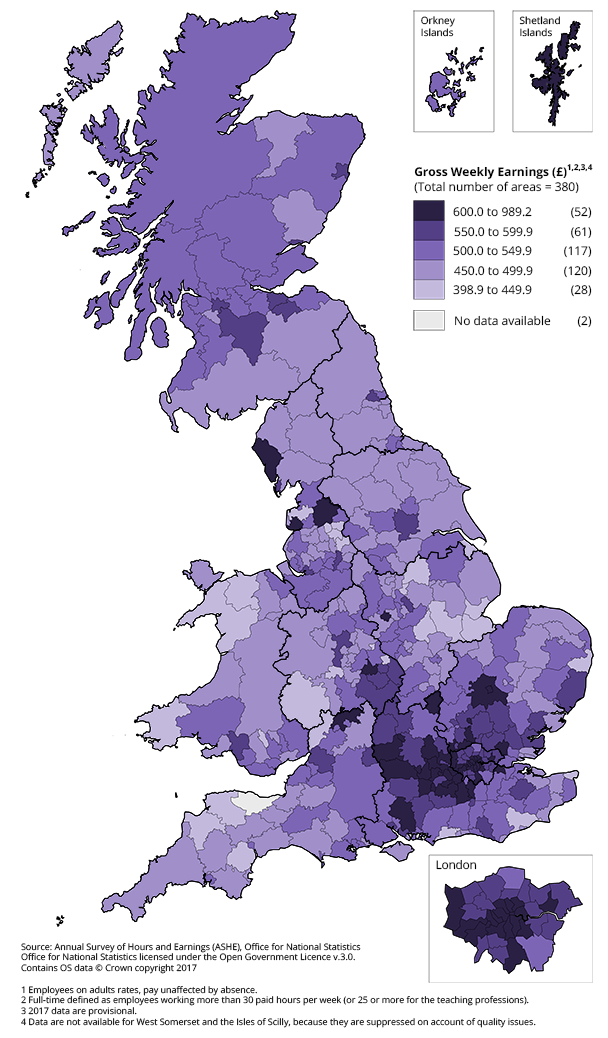
When looking at earnings by place of residence, which is the place where the employee lives, employees living in Kensington and Chelsea had the highest median gross weekly earnings (£862), while those living in West Somerset had the lowest (£407).
It should be noted that earnings comparisons take no account of regional variations in prices for goods and services and therefore do not necessarily indicate differences in the standard of living. Neither do they take account of differences in the regional composition of the workforce, meaning that like-for-like comparisons may not be appropriate. For example, a region might have a lower level of median earnings than another if it has a higher proportion of employees in industries or occupations with relatively low earnings.
How does the gender pay gap change by country?
The gender pay gap has decreased for all UK countries since 1997 (Figure 14). In 2017, England has the highest gender pay gap, of 10.0%. In recent years the gender pay gap for full-time employees in Northern Ireland has been below 0%, that is, women earn more, on average, than men. This is, in part, due to a higher proportion of public sector jobs here than in the rest of the UK. There are more women employed in this sector than men and these jobs tend to be higher-paid, in general, than in the private sector.
Figure 14: Gender pay gap for median full-time hourly earnings (excluding overtime) by country, UK, April 1997 to 2017

Source: Annual Survey of Hours and Earnings (ASHE) - Office for National Statistics
Notes:
- Employees on adult rates, pay unaffected by absence.
- Figures represent the difference between men's and women's hourly earnings as a percentage of men's earnings.
- Full-time defined as employees working more than 30 paid hours per week (or 25 or more for the teaching professions).
- Dashed lines represent discontinuities in 2004, 2006 and 2011 ASHE estimates.
- 2017 data are provisional.
- Figures rounded to one decimal place.
Download this image Figure 14: Gender pay gap for median full-time hourly earnings (excluding overtime) by country, UK, April 1997 to 2017
.png (54.3 kB) .xls (236.0 kB)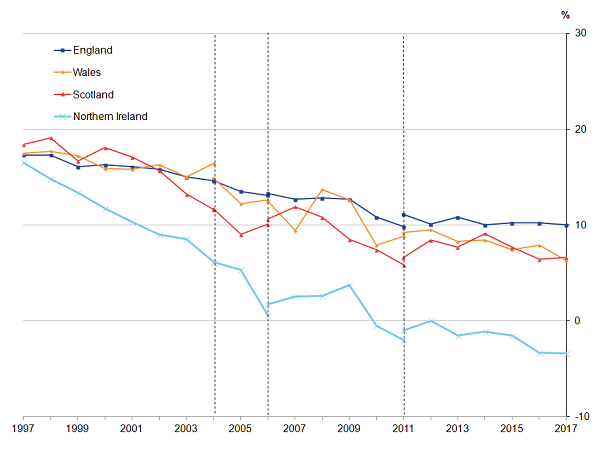
10. Earnings by age group
Median weekly earnings for full-time employees reach a maximum in the 40 to 49 age group for men (£680 in April 2017) and in the 30 to 39 age group for women (£557).
Figure 15: Median full-time gross weekly earnings by sex and age group, UK, April 2017
Source: Annual Survey of Hours and Earnings (ASHE) - Office for National Statistics
Notes:
- All employees aged 16 to 17 and employees aged 18 and over on adult rates, pay unaffected by absence.
- Full-time defined as employees working more than 30 paid hours per week (or 25 or more for the teaching professions).
- 2017 data are provisional.
Download this chart Figure 15: Median full-time gross weekly earnings by sex and age group, UK, April 2017
Image .csv .xlsHow does the gender pay gap change with age?
Figure 16 shows gender pay differences by age group. Among full-time employees, the gap is relatively small up to and including those aged 35 to 39. From the 40 to 44 age group and upwards, the gap is much wider, with men being paid substantially more on average than women. This is likely to be connected with patterns of return to work after having children, in particular any differences between men and women in timing and nature of returning to the labour market. A negative gender pay gap among part-time employees emerges in the age group 30 to 34 (just after the average women’s age for having a first birth) and increases for 35 to 39 year olds before beginning to be reversed.
Taking all employees (full-time and part-time together), men are paid more on average than women for all age groups (except those aged 16 to 17, where the gender pay gap is negative 3.5%). For age groups from 22 to 24 upwards, the gap is wider than for full-time employees alone. This is because, in these age groups, more women are working in part-time jobs that tend to be lower paid. Across all employees, the median hourly full-time pay in full-time jobs is higher than for part-time jobs by a factor of approximately 1.5 (£9.11 compared with £14.00).
Figure 16: Gender pay gap for median gross hourly earnings (excluding overtime) by age group, UK, April 2017
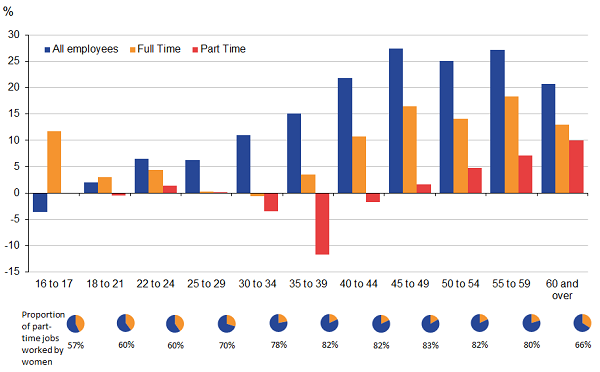
Source: Annual Survey of Hours and Earnings (ASHE) - Office for National Statistics
Notes:
- Employees on adult rates, pay unaffected by absence.
- Figures represent the difference between men's and women's hourly earnings as a percentage of men's earnings.
- Full-time defined as employees working more than 30 paid hours per week (or 25 or more for the teaching professions).
- 2017 data are provisional.
Download this image Figure 16: Gender pay gap for median gross hourly earnings (excluding overtime) by age group, UK, April 2017
.png (35.1 kB) .xls (73.7 kB)
11. Earnings by occupation
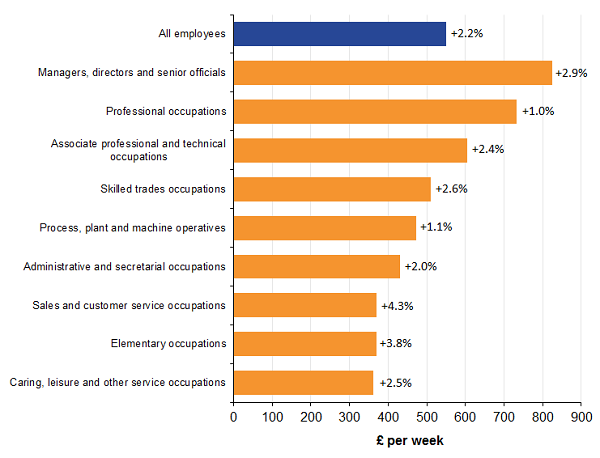
In April 2017, the occupation group with the highest median weekly earnings for full-time employees was managers, directors and senior officials, at £824. This was £274 higher than the UK as a whole. Caring, leisure and other service occupations were the lowest paid group, at £361 per week (Figure 17). The largest growths in full-time median weekly earnings compared with 2016 were seen in sales and customer service occupations (increased by 4.3%) and elementary occupations (3.8%). These occupations, along with process, plant and machine operatives and caring, leisure and other service occupations, were those whose first deciles (the lowest tenth percentile) for hourly earnings (excluding overtime) in 2016 were less than the 2017 National Living Wage rate (£7.50).
Figure 17: Median full-time gross weekly earnings and percentage change from previous year, by major occupation group, UK, April 2017
Source: Annual Survey of Hours and Earnings (ASHE) - Office for National Statistics
Notes:
- Employees on adult rates, pay unaffected by absence.
- Full-time defined as employees working more than 30 paid hours per week (or 25 or more for the teaching professions).
- Occupations as defined by the Standard Occupational Classification 2010.
- 2017 data are provisional.
Download this image Figure 17: Median full-time gross weekly earnings and percentage change from previous year, by major occupation group, UK, April 2017
.png (60.3 kB) .xls (67.1 kB)
Highest proportion of low-paid jobs in elementary occupations
The occupation group with the highest proportion of low-paid jobs (defined as two-thirds of median hourly earnings for all UK employee jobs) was elementary occupations, in which 53.6% of employee jobs were low-paid in April 2017 (Figure 18). Examples of elementary occupations are bar staff, waiters and waitresses and a range of elementary administrative, service and construction occupations. The difference between the percentage of low-paid jobs in this occupation and caring, leisure and other service occupations (33.0%) is notable, especially given that the difference in median gross weekly earnings for full-time employees in these two occupation groups was small. At the other end of the scale, it is notable how skewed the distributions of pay are for managers, directors and senior officials and professional occupations, with over half of the jobs in both these occupation groups being defined as high-paid (that is, greater than one-and-a-half times median hourly earnings).
Figure 18: Proportion of low paid and high paid full-time jobs, by occupation, UK, April 2017
Source: Annual Survey of Hours and Earnings (ASHE) - Office for National Statistics
Notes:
- Employees on adult rates, pay unaffected by absence.
- Full-time defined as employees working more than 30 paid hours per week (or 25 or more for the teaching professions).
- Occupations as defined by the Standard Occupational Classification 2010.
- 2017 data are provisional.
Download this chart Figure 18: Proportion of low paid and high paid full-time jobs, by occupation, UK, April 2017
Image .csv .xlsHow does the gender pay gap vary across occupations?
When looking at the gender pay gap by occupation for full-time employees, it is in favour of men for all the main occupation groups, ranging from 3.6% for sales and customer service occupations to 24.8% for skilled trades occupations in April 2017 (Figure 19).
An interactive tool is available on the Visual.ONS website that shows the gender pay gap and average earnings for a wide range of jobs, as well as the number of men and women working in each occupation.
Figure 19: Gender pay gap for median full-time hourly earnings (excluding overtime) and the year-on-year percentage point change, by major occupation group, UK, April 2017

Source: Annual Survey of Hours and Earnings (ASHE) - Office for National Statistics
Notes:
- Employees on adult rates, pay unaffected by absence.
- Gender pay gap is defined as the difference between men’s and women’s hourly earnings as a percentage of men’s earnings.
- Full-time defined as employees working more than 30 paid hours per week (or 25 or more for the teaching professions).
- Occupations as defined by the Standard Occupational Classification 2010.
- 2017 data are provisional.
Download this image Figure 19: Gender pay gap for median full-time hourly earnings (excluding overtime) and the year-on-year percentage point change, by major occupation group, UK, April 2017
.png (44.6 kB) .xls (54.3 kB)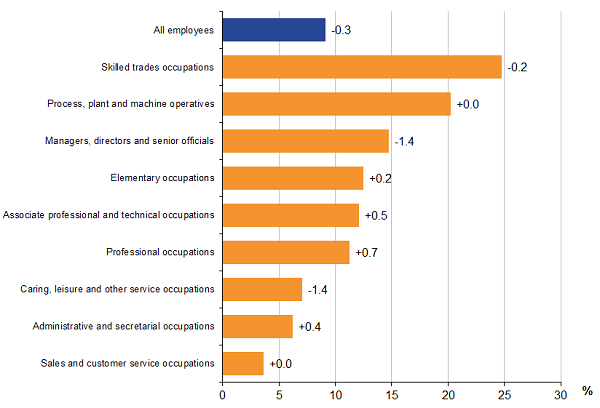
12. Earnings by business size band
The size of the business affects how much an employee earns on average, with the median gross weekly earnings increasing for full-time employees (as well as for all employees and part-time employees separately) as the size band of the business (in terms of headcount) increases (£459 for businesses in the 0 to 9 employee size band compared with £576 for businesses in the 250 and over employee size band – see Figure 20).
Figure 20: Median gross weekly earnings, by business size band, UK, April 2017
Source: Annual Survey of Hours and Earnings (ASHE) - Office for National Statistics
Notes:
- Employees on adult rates, pay unaffected by absence.
- Full-time defined as employees working more than 30 paid hours per week (or 25 or more for the teaching professions).
- 2017 data are provisional.
- Size bands are based on the number of employees in the enterprise from the Inter-Departmental Business Register (IDBR).
Download this chart Figure 20: Median gross weekly earnings, by business size band, UK, April 2017
Image .csv .xls13. The make-up of earnings
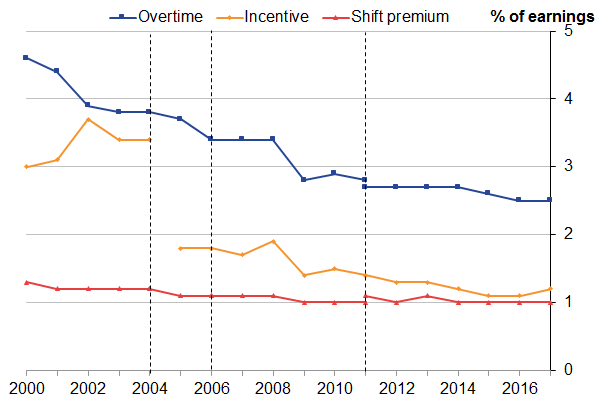
Overtime payments as a proportion of mean gross weekly earnings for full-time employees have remained relatively stable in recent years (at around 2.5%), following a sharp fall coinciding with the economic downturn in 2009 (Figure 21). This is due to a fall in the number of paid overtime hours worked. The proportion accounted for by incentive or bonus payments has decreased since 2000 but that decline has stalled in recent years, at 1.2% in 2017, and shift premium has remained consistently around 1.0%. However, it is important to note that there are known coverage issues with data on bonus and incentive payments, primarily because the information is often not available to respondents at the time when they are required to provide the information to us.
As is the case in previous years, overtime and incentive payments account for a greater proportion of mean gross weekly pay for men than they do for women.
For more information on the definition of the different breakdowns of pay, refer to the guide to interpreting ASHE estimates.
Figure 21: Non-basic components of pay as a proportion of mean full-time gross weekly earnings, April 2000 to 2017
Source: Annual Survey of Hours and Earnings (ASHE) - Office for National Statistics
Notes:
- Employees on adult rates, pay unaffected by absence.
- Full-time defined as employees working more than 30 paid hours per week (or 25 or more for the teaching professions).
- Dashed lines represent discontinuities in 2004, 2006 and 2011 ASHE estimates.
- A methodological change in 2005 means that estimates for incentive payments from this time onwards are not comparable with earlier estimates.
- 2017 data are provisional.
Download this image Figure 21: Non-basic components of pay as a proportion of mean full-time gross weekly earnings, April 2000 to 2017
.png (14.0 kB) .xls (67.6 kB)
14. Hours paid
Total paid hours continue to decrease
Over the long-term, the mean average number of total paid hours per week for full-time employees has decreased from 40.0 in 1997 to 39.1 in 2017 (although the average had dropped to 39.0 by 2009 and has been stable since). This decrease is particularly notable for full-time men (41.5 total paid hours in 1997 compared with 40.1 total paid hours in 2017), with a sharp dip between 2008 and 2009, from 40.7 to 40.1 hours. Over this period, full-time women’s total paid hours have remained stable at around 37.5.
Examining the components of paid hours, there is a long-term decrease in overtime paid hours worked, particularly for men, although this has levelled off in recent years. However, there has been a very slight increase in basic paid hours worked since 1997 (see Figure 22).
Figure 22: Components of mean full-time weekly paid hours of work, UK, April 1997 and April 2017
Source: Annual Survey of Hours and Earnings (ASHE) - Office for National Statistics
Notes:
- Data labels are in hours
- Employees on adult rates, pay unaffected by absence.
- Full-time defined as employees working more than 30 paid hours per week (or 25 or more for the teaching professions).
- 2017 data are provisional.
Download this chart Figure 22: Components of mean full-time weekly paid hours of work, UK, April 1997 and April 2017
Image .csv .xlsThe mean number of paid hours worked per week by full-time employees ranges from 36.9 for professional occupations to 43.9 in process, plant and machine operatives. Of the 7.0 hours difference between these two occupations, 2.9 hours are paid overtime and 4.1 are basic paid hours.
Figure 23: Components of mean full-time weekly paid hours of work by major occupation group, UK, April 2017
Source: Annual Survey of Hours and Earnings (ASHE) - Office for National Statistics
Notes:
- Data labels are in hours
- Employees on adult rates, pay unaffected by absence.
- Full-time defined as employees working more than 30 paid hours per week (or 25 or more for the teaching professions).
- Occupations as defined by the Standard Occupational Classification 2010.
- 2017 data are provisional.
Download this chart Figure 23: Components of mean full-time weekly paid hours of work by major occupation group, UK, April 2017
Image .csv .xls16. Quality and methodology
The Annual Survey of Hours and Earnings, Low Pay and Annual Survey of Hours and Earnings Pension Results Quality and Methodology Information reports contain important information on:
- the strengths and limitations of the data and how it compares with related data
- users and uses of the data
- how the output was created
- the quality of the output including the accuracy of the data
More specific information about our low pay methodology is also available.
Accuracy
Revisions
In line with normal practice this release contains revised estimates from the 2016 survey results, which were published on 26 October 2016. These results take account of some corrections to the original 2016 data that were identified during the validation of the results for 2017, as well as late returns. Both the 2017 ASHE provisional results and the revised estimates for 2016 were made available from 26 October 2017.
Sampling error
ASHE aims to provide high-quality statistics on the structure of earnings for various industrial, geographical, occupational and age-related breakdowns. However, the quality of these statistics varies depending on various sources of error.
Sampling error results from differences between a target population and a sample of that population. Sampling error varies partly according to the sample size for any particular breakdown or “domain”. Indications of the quality of ASHE estimates are provided in the form of coefficients of variation (CV). The coefficient of variation is the ratio of the standard error (SE) of an estimate to the estimate, expressed as a percentage. Generally, if all other factors are constant, the smaller the CV the higher the quality of the estimate. Tables of CVs corresponding to estimates are published alongside the estimates themselves. High-level coefficients of variation for the 2017 ASHE estimates are shown in Table 1.
It should be noted that at low levels of disaggregation, high coefficients of variation imply estimates of low quality. For example, for an estimate of £400 with a CV of 10%, the true value is likely, with 95% confidence, to lie between £321.60 and £478.40. This range is given by the following:
estimate plus or minus 1.96*SE
where 1.96 is a statistical value defined by the level of confidence; in this case a 95% level of confidence. Where these ranges for different estimates overlap, interpretation of differences between the relevant domains becomes more difficult.
Table 1: Coefficients of variation for estimates of median gross weekly earnings and hourly earnings (excluding overtime), UK, April 2017
| % | |||
| Full Time | Part-Time | ||
|---|---|---|---|
| Median gross weekly earnings | Men | 0.3 | 1.1 |
| Women | 0.4 | 0.4 | |
| All | 0.2 | 0.5 | |
| Median gross hourly earnings (excluding overtime) | Men | 0.3 | 0.6 |
| Women | 0.4 | 0.2 | |
| All | 0.2 | 0.3 | |
| Source: Annual Survey of Hours and Earnings (ASHE) - Office for National Statistics | |||
| Notes: | |||
| 1. Employees on adult rates, pay unaffected by absence. | |||
| 2. Full-time defined as employees working more than 30 paid hours per week (or 25 or more for the teaching professions). | |||
| 3. Coefficient of variation is the ratio of the standard error of an estimate to the estimate, expressed as a percentage. | |||
| 4. 2017 data are provisional. | |||
Download this table Table 1: Coefficients of variation for estimates of median gross weekly earnings and hourly earnings (excluding overtime), UK, April 2017
.xls (27.6 kB)Non-sampling error
ASHE statistics are also subject to non-sampling errors. For example, there are known differences between the coverage of the ASHE sample and the target population (that is, all employee jobs). Jobs that are not registered on PAYE schemes are not surveyed. These jobs are known to be different to the PAYE population in the sense that they typically have low levels of pay. Consequently, ASHE estimates of average pay are likely to be biased upwards with respect to the actual average pay of the employee population. Non-response bias may also affect ASHE estimates. This may happen if the jobs for which respondents do not provide information are different to the jobs for which respondents do provide information. For ASHE, this is likely to be a downward bias on earnings estimates since non-response is known to affect high-paying occupations more than low-paying occupations.
Finally, ASHE results tables do not account for differences in the composition of different “slices” of the employee workforce. For example, figures for the public and private sectors include all jobs in those sectors and are not adjusted to account for differences in the age, qualifications or seniority of the employees or the nature of their jobs, all factors that may affect how much employees earn.
Further information about the quality of ASHE, including a more detailed discussion of coverage and non-response errors, is available.
ASHE coverage change in 2014
The rules covering which employments employers were required to report via PAYE changed in April 2013, effectively extending the coverage of the ASHE sample to include employments that were not covered under the previous rules. The new reporting system is known as “Real Time Information” (or RTI).
Analysis on 2014 results showed that the composition of the ASHE sample was not substantially distorted as a consequence of the move to RTI. This is because the majority of the RTI-type jobs were already being reported via PAYE by employers in previous years. Consequently, ONS judges that the impact of the move to RTI on the estimates for ASHE is negligible.
Back to table of contents