Table of contents
1. Main points
In April 2016 median gross weekly earnings for full-time employees were £539, up 2.2% from £527 in 2015. The 2.2% growth seen this year is the joint highest growth in earnings seen since the economic downturn in 2008 (matching that seen in 2013).
Adjusted for inflation, weekly earnings increased by 1.9% compared with 2015. This repeats the trend seen in 2015, which exhibited the first increase since 2008, and is due to a combination of growth in average earnings and a low level of inflation at that time.
Weekly earnings grew by 2.2% for full-time workers compared with 6.6% for part-time workers.
The bottom of the distribution has grown fastest this year, with the fifth percentile growing by 6.2% and the 95th percentile growing by 2.5%.
In April 2016 the gender pay gap (for median hourly earnings) for full-time employees decreased to 9.4%, from 9.6% in 2015. This is the lowest since the survey began in 1997, although the gap has changed relatively little over the last six years.
Median weekly earnings for full-time employees in the private sector were £517 (up 3.4% on 2015) compared with £594 (up 0.7%) for the public sector. While private sector median earnings have been around 85% of public sector earnings between 2010 and 2015, the proportion has risen to 87% this year.
Back to table of contents2. Introduction
This bulletin presents analyses from the Annual Survey of Hours and Earnings (ASHE), which is the most detailed and comprehensive source of earnings information. ASHE is based on a 1% sample of employee jobs, drawn from HM Revenue and Customs Pay As You Earn (PAYE) records. Throughout this bulletin, the terms jobs and employees are used interchangeably.
Our headline measure of earnings from ASHE is median weekly earnings for full-time employees. This measure is the main focus of this release, but discussion of mean earnings, hourly earnings, annual earnings and earnings for part-time employees is also included for comparison. Figures are presented in terms of gross pay (that is, before tax, National Insurance and other deductions) in current prices, unless otherwise stated.
This bulletin contains provisional estimates from the 2016 survey. The 2015 estimates have been subject to small revisions since the provisional publication on 18 November 2015. The full suite of reference tables from the 2016 ASHE and from all previous years back to 1997 is available on our website. An explanation of definitions used in this bulletin and further methodological information can be found in the background notes.
The figures in ASHE relate to the reference date of 13 April 2016 and thus capture the early effects of the introduction of the new National Living Wage (£7.20) for employees aged 25 and over on 1 April 2016, as well as the changes to the National Minimum Wage of other age groups which occurred on 1 October 2015. For more information about those paid below the National Minimum Wage or National Living Wage see the Low Pay Bulletin, also released (26 October 2016).
We constantly aim to improve our ASHE outputs and associated commentary. Please contact earnings@ons.gov.uk with any feedback or questions.
Why is the median used as the main measure of earnings?
There are several methods of calculating an average; in this bulletin we focus on the median, that is the data value at which 50% of data values are above it and 50% of data values are below it.
We use the median because the distribution of earnings is skewed, with more people earning lower salaries than higher salaries. When using the mean to calculate the average of a skewed distribution, it is highly influenced by those values at the upper end of the distribution and thus may not be truly representative of the average earnings of a typical person. By taking the middle value of the data after sorting in ascending order, the median avoids this issue and is consequently considered a better indicator of typical “average” earnings.
3. Average earnings
In April 2016 median gross weekly earnings for full-time employees were £539, up 2.2% from £527 in 2015. Historically, between 1997 (the first year for which Annual Survey of Hours and Earnings (ASHE) data are available) and 2008, growth was fairly steady, averaging approximately 4% each year. However, since the start of the economic downturn, growth has been slower, with the annual increase averaging 1.5% per year between 2009 and 2016. The 2.2% growth seen this year is the joint highest growth in earnings since the economic downturn (matching that seen in 2013).
To understand changes in earnings in the context of inflation, historic data are adjusted using the Consumer Prices Index (CPI). This gives a measure of the “real” value of earnings, with a decrease meaning that earnings growth is below inflation.
Adjusted for inflation, weekly earnings increased by 1.9% compared with 2015. This repeats the trend seen in 2015, which exhibited the first increase in weekly earnings since 2008. This is due to a combination of growth in average earnings and the continued relatively low level of inflation (the CPI rose by 0.3% in the year to April 2016). However, adjusted for inflation, earnings are not yet back to their peak in 2008.
Figure 1: Median full-time gross weekly earnings in current and constant (2016) prices, UK, April 1997 to 2016

Source: Annual Survey of Hours and Earnings (ASHE) - Office for National Statistics
Notes:
- Employees on adult rates, pay unaffected by absence.
- Full-time defined as employees working more than 30 paid hours per week (or 25 or more for the teaching professions).
- CPI figures are based on the All Items Consumer Prices Index of inflation for April.
- Dashed lines represent discontinuities in 2004, 2006 and 2011 ASHE estimates.
- 2016 data are provisional.
Download this image Figure 1: Median full-time gross weekly earnings in current and constant (2016) prices, UK, April 1997 to 2016
.png (17.2 kB) .xls (134.1 kB)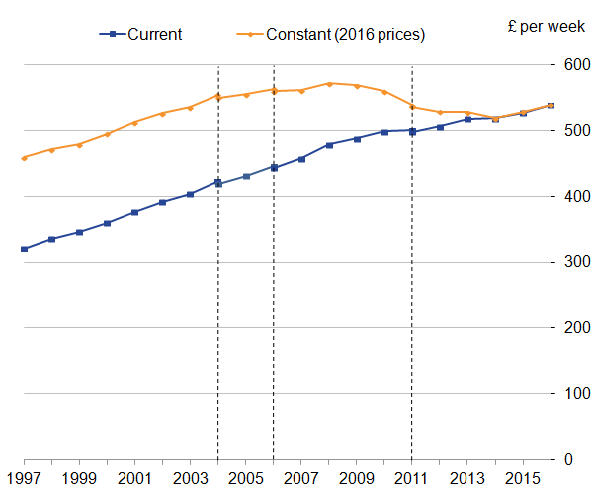
The composition of the workforce used for the ASHE sample changes from year to year, which can affect changes in median earnings. For example, creation of lower paid jobs, or loss of highly-paid jobs, can both act to reduce the median.
One approach to removing this compositional effect is to only look at jobs in which the employee has been in the same post for at least one year (termed “continuous employment”). This shows consistently higher growth rates over time (as shown in Figure 2), and in April 2016 median earnings for full-time employees in this group grew by 4.6% compared with April 2015.
ASHE indicates that around 80% of the full-time workforce remained in the same job between 2015 and 2016. This group can experience pay increases due to factors such as progression through a pay scale, entitlement to a higher minimum wage, and pay settlements.
The change in median earnings for the continuously employed group shows how much a typical continuously employed person (that is, a person at the middle of the continuously employed distribution) in the current year is earning compared with the typical employee from the same group in the previous year. Care should be taken not to interpret this change as necessarily typical of the change in wages experienced by the majority of the continuously employed group. It should also be noted that the change in median earnings does not mean that half of the continuously employed received an increase in weekly earnings of more than 4.6% and half less than 4.6%. There will be a range of changes in earnings between years for continuously employed individuals.
Growth in median earnings compared with median growth in earnings
In this bulletin we use the growth in the median (that is, how much the median grows year-on-year), as opposed to the median growth (that is, the median of the growths in each individual’s earnings between years). This is because of the sampling variability and the changes to survey response each year.
The difference between these two measures is illustrated by the theoretical example of five employee jobs shown in table 1.
The growth in median earnings would be the percentage change between the median values in 2015 and 2016, equalling 5.6%, while the median growth in earnings would be 1.0%. It is the former measure which is used in ASHE.
Table 1: A theoretical example of five employee jobs in 2015 and 2016
| Employee | Median | |||||||
| 1 | 2 | 3 | 4 | 5 | 6 | 7 | ||
| Gross Weekly Pay in 2015 (£) | 400 | 440 | 450† | 475 | 490 | 450 | ||
| Gross Weekly Pay in 2016 (£) | 412 | 455 | 475† | 486 | 498 | 475 | ||
| Change between 2015 and 2016 (%) | 3 | N/A | 1† | 0 | N/A | N/A | N/A | 6 |
| Source: Office for National Statistics | ||||||||
| Notes: | ||||||||
| 1. † indicates the median | ||||||||
| 2. This is a fictitious example designed to illustrate a concept and is not considered real data | ||||||||
Download this table Table 1: A theoretical example of five employee jobs in 2015 and 2016
.xls (28.7 kB)An article titled “Understanding Average Earnings for the Continuously Employed”, published last year on our website, gives further guidance on how to interpret these statistics.
Figure 2: Annual percentage change in median full-time gross weekly earnings for all employees and those in continuous employment, UK, April 2005 to 2016
Source: Annual Survey of Hours and Earnings (ASHE) - Office for National Statistics
Notes:
- The “continuously employed” group is made up of employees who appear in consecutive ASHE samples, have a weekly earnings observation in both periods and are classified by their employer as being in the same job for at least 12 months in the second period.
- Employees on adult rates, pay unaffected by absence.
- Full-time defined as employees working more than 30 paid hours per week (or 25 or more for the teaching professions).
- CPI figures are based on the All Items Consumer Prices Index of inflation for April.
- 2016 data are provisional.
Download this chart Figure 2: Annual percentage change in median full-time gross weekly earnings for all employees and those in continuous employment, UK, April 2005 to 2016
Image .csv .xlsIn April 2016 men working full-time earned more than women on average (£578 per week compared with £480), with both seeing increases in median earnings compared with 2015 (1.9% and 2.2% respectively). The gap between men’s and women’s gross weekly earnings has remained relatively consistent from 1997 to 2016, at around £100, but this corresponds to a faster rate of increase for women than for men over this period (an 81% increase compared with 62% respectively), meaning that the gap has been closing in percentage terms.
While these results provide a useful measure of earnings trends for men and women, our preferred measure of the “gender pay gap” uses hourly earnings excluding overtime. This is discussed later in the gender pay gap section of this bulletin.
For the year ending 5 April 2016, annual earnings (with a median of approximately £28,200) for full-time employees showed an increase of 2.2% compared with the previous tax year, with a growth of 2.1% for men working full-time and 2.7% for women working full-time (Figure 3).
Figure 3: Median full-time gross annual earnings by sex, UK, 1999 to 2016

Source: Annual Survey of Hours and Earnings (ASHE) - Office for National Statistics
Notes:
- Employees on adults rates who have been in the job for more than one year.
- Full-time defined as employees working more than 30 paid hours per week (or 25 or more for the teaching profession).
- Earnings for the tax year ending 5 April.
- Dashed lines represent discontinuities in 2004, 2006 and 2011 ASHE estimates.
- 2016 data are provisional.
Download this image Figure 3: Median full-time gross annual earnings by sex, UK, 1999 to 2016
.png (19.0 kB) .xls (139.3 kB)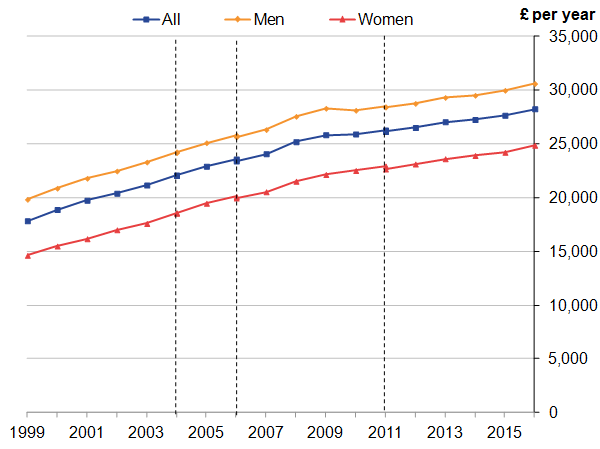
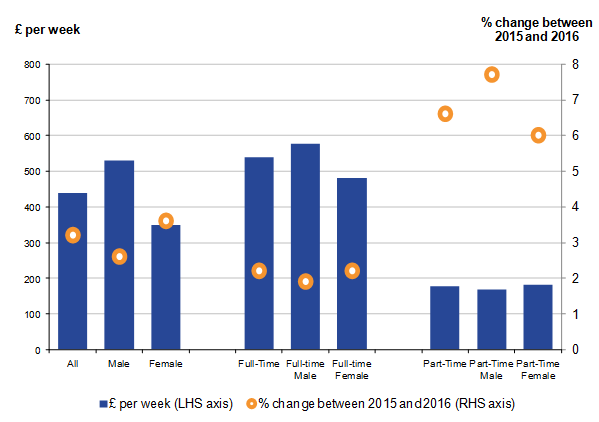
Stronger growth has been seen for part-time jobs than for full-time jobs, with median weekly gross earnings increasing by 6.6% (up £11) and 2.2% (up £12) respectively. A similar trend can be seen for annual gross pay (full-time increased by 2.2% and part-time increased by 4.4%) and for hourly earnings excluding overtime (full-time increased by 2.3% and part-time increased by 5.3%). This trend in part-time earnings is also reflected in alternative sources of earnings information, with the Labour Force Survey (Table EARN08, Quarter 2 (Apr to June) 2015 and Quarter 2 2016) showing part-time hourly earnings (3.1%) rising faster than full-time hourly earnings (1.4%).
As for full-time employees, the weekly pay distribution for part-time employees showed stronger growth for the lowest earners than for the highest earners. Generally, though, pay for part-time employees increased more strongly at all points of the pay distribution than that for full-time employees.
Figure 4: Median gross weekly earnings and percentage change from previous year, by sex and work pattern, UK, April 2016
Source: Annual Survey of Hours and Earnings (ASHE) - Office for National Statistics
Notes:
- Employees on adult rates, pay unaffected by absence.
- Full-time defined as employees working more than 30 paid hours per week (or 25 or more for the teaching professions).
- 2016 data are provisional.
- The axis for the gross weekly earnings is on the left-hand side and the axis for the percentage change from the previous year is on the right-hand side.
Download this image Figure 4: Median gross weekly earnings and percentage change from previous year, by sex and work pattern, UK, April 2016
.png (18.6 kB) .xls (43.0 kB)
4. Distribution of earnings
Focusing solely on the median hides some interesting trends for low- and high-earning employees. Figure 5 shows the percentage point change along the distribution (at 5 percentile intervals) of full-time gross weekly earnings between years (since 1997) relative to the change in the median for that year.
Between 2015 and 2016, the largest increase was at the bottom end of the distribution (fifth percentile: 6.2%) whilst the top end of the distribution (95th percentile: 2.5%) was closer to the growth seen at the median of the distribution (2.2%). In comparison with other years, we find that this growth of the fifth percentile is the highest it has been since the series began in 1997. Note that the fifth percentile means that 5% of the population earn under this amount and 95% of the population earn above this amount.
The reason for this increased growth at the bottom of the distribution is likely to be due to the introduction of the National Living Wage (£7.20), with hourly earnings (excluding overtime) for full-time jobs increasing by 5.9% at the fifth percentile from £6.86 to £7.26 between 2015 and 2016. Indeed, the change between 1998 and 1999, when the National Minimum Wage was introduced, shows a similar pattern with the fifth percentile of full-time gross weekly earnings growing at a higher rate than any other percentiles (Figure 5).
Figure 5: Year-on-year change to the distribution of full-time gross weekly earnings relative to the year-on-year change in the median, UK, 1997 to 2016

Source: Annual Survey of Hours and Earnings (ASHE) - Office for National Statistics
Notes:
- Employees on adult rates, pay unaffected by absence.
- Full-time defined as employees working more than 30 paid hours per week (or 25 or more for the teaching professions).
- 2016 data are provisional.
- Only selected years have been highlighted; data for other years is available in the downloadable spreadsheets accompanying the chart.
Download this image Figure 5: Year-on-year change to the distribution of full-time gross weekly earnings relative to the year-on-year change in the median, UK, 1997 to 2016
.png (46.3 kB) .xls (77.8 kB)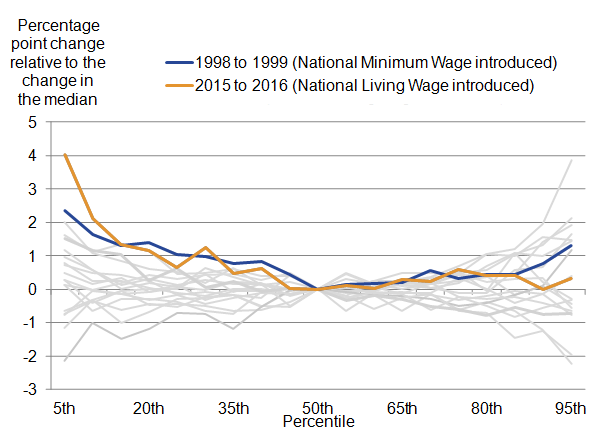
5. Gender pay differences
While there is no single measure that fully deals with the complex issue of the differences between men’s and women’s pay, in this bulletin we use median hourly earnings (excluding overtime). Including overtime can skew the results because men work relatively more overtime than women, and using hourly earnings better accounts for the fact that men work on average more hours per week than women. The median is less affected by a relatively small number of very high earners than the mean, and therefore gives a better indication of typical pay. A paper further explaining our position on this topic is available.
It should be noted that the figures do not show differences in rates of pay for comparable jobs, as they are affected by factors such as the proportion of men and women in different occupations. For example, a higher proportion of women work in occupations such as administration and caring, which tend to offer lower salaries.
How is the gender pay gap calculated?
The gender pay gap is calculated as the difference between average hourly earnings (excluding overtime) of men and women as a proportion of average hourly earnings (excluding overtime) of men’s earnings.
Given the strong influence of the balance between full-time and part-time employees, the majority of detailed analyses of the gender pay gap in this bulletin are presented for full-time employees alone. Figures for full-time and part-time employees combined (as well as part-time employees alone) are included in the downloadable spreadsheets accompanying the charts.
In April 2016 the gender pay gap (for median earnings) for full-time employees decreased to 9.4%, from 9.6% in 2015 (Figure 6). This is the lowest since the survey began in 1997, although the gender pay gap has changed relatively little in recent years. When part-time employees are included, the gap decreased from 19.3% in 2015 to 18.1% in 2016, the largest year-on-year drop since 2010. This is also the lowest gender pay gap since the survey began in 1997, when the gap for all employees was 27.5%.
For part-time employees separately, women are paid more on average, resulting in a “negative” gender pay gap. Although the part-time gender pay gap has decreased from minus 6.8% in April 2015 to minus 6.0% in April 2016, there is evidence that the part-time gender pay gap has widened in the long-term.
Explanation for the difference in the gender pay gap estimate between full-time and all employees
The gender pay gap estimate is calculated as a differential proportion of two median estimates, the middle points of the data, one for female and one for males. The composition of the male and female employee workforces are quite different, with more women working part-time than men (41% compared with 12% respectively – source: Labour Force Survey, Quarter 2 (April to June) 2016, Table EMP04). Because the hourly earnings of part-time employees tend to be less, on average, than the earnings of full-time employees, this means women are more likely to receive lower hourly rates of pay. It's this fact that helps explain why the gender pay gap for all full-time and part-time employees is greater than the gender pay gap for full-time employees only.
Consider the following fictitious example (shown in table 2) representing the male and female samples collected on Annual Survey of Hours and Earnings (ASHE).
The male sample contains more full-time employees, while the female sample contains more part-time employees. When considering the full-time employees only, the majority of the male sample is used, whilst typically only the higher earners of the female sample are considered. Due to this, when taking the medians, that is the middle point of the selected sample, the gender pay gap is relatively small.
When all employees are considered, the typically lower-paid part-time workers are included, of which there are more lower-paid female workers than male. As a consequence, this causes the gap to increase (usually as a result of the female median decreasing).
Table 2: A fictitious example of the ASHE sample representing the hourly earnings (excluding overtime) for men and women by work pattern
| Men | Women | ||
| Work Pattern | Hourly Earnings (£) | Work Pattern | Hourly Earnings (£) |
| Part-time | 7 | Part-time | 7 |
| Full-time | 9 | Part-time | 8 |
| Full-time | 12 | Full-time | 10 |
| Part-time | 12 | Part-time | 13 |
| Full-time | 21 | Part-time | 16 |
| Full-time | 22 | Full-time | 16 |
| Full-time | 25 | Part-time | 20 |
| Part-time | 30 | Full-time | 20 |
| Full-time | 40 | Full-time | 25 |
| Full-time | 45 | Full-time | 30 |
| Source: Office for National Statistics | |||
| Notes: | |||
| 1. † indicates the median | |||
| 2. This is a fictitious example designed to illustrate a concept and is not considered real data | |||
Download this table Table 2: A fictitious example of the ASHE sample representing the hourly earnings (excluding overtime) for men and women by work pattern
.xls (32.8 kB)
Table 3: The calculated gender pay gap for the fictitious ASHE sample shown in Table 2
| Male Median (£) | Female Median (£) | Gender Pay Gap (%) | |
| Full-Time | 22 | 20 | 9 |
| Part-Time | 12 | 13 | 8 |
| All employees | 22 | 16 | 26 |
| Source: Office for National Statistics | |||
| Notes: | |||
| 1. This is a fictitious example designed to illustrate a concept and is not considered real data | |||
Download this table Table 3: The calculated gender pay gap for the fictitious ASHE sample shown in Table 2
.xls (18.4 kB)
Figure 6: Gender pay gap for median gross hourly earnings (excluding overtime), UK, April 1997 to 2016

Source: Annual Survey of Hours and Earnings (ASHE) - Office for National Statistics
Notes:
- Employees on adult rates, pay unaffected by absence.
- Figures represent the difference between men's and women's hourly earnings as a percentage of men's earnings.
- Full-time defined as employees working more than 30 paid hours per week (or 25 or more for the teaching professions).
- Dashed lines represent discontinuities in 2004, 2006 and 2011 ASHE estimates.
- 2016 data are provisional.
Download this image Figure 6: Gender pay gap for median gross hourly earnings (excluding overtime), UK, April 1997 to 2016
.png (22.8 kB) .xls (113.7 kB)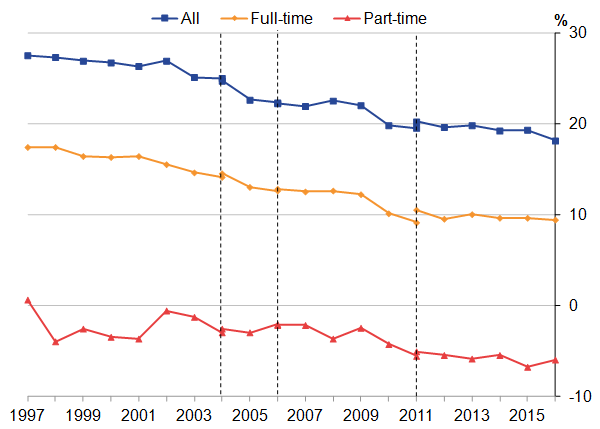
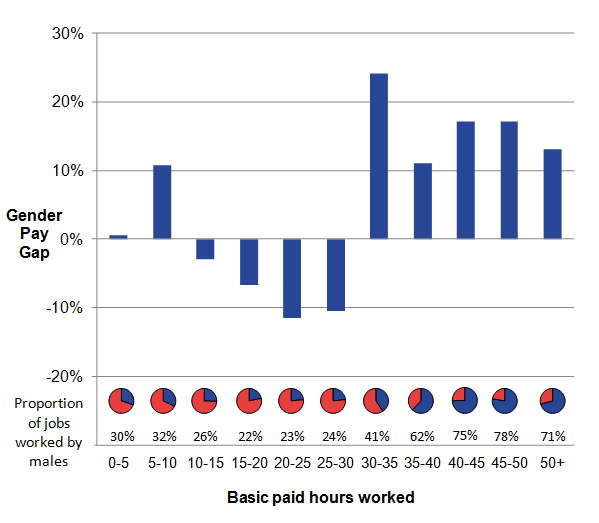
Investigating the difference in the gender pay gap between part-time and full-time employees further by the number of paid hours worked (shown in Figure 7) reveals the transition between the gender pay gap favouring women over men and vice-versa. Typically, more men are employed in jobs that involve working a higher number of hours, and for these jobs, it can be seen that the gender pay gap is in favour of men. However, for jobs where the number of paid hours worked by an employee is between 10 and 30, more women work in these jobs and the gender pay gap is in favour of women.
Figure 7: Gender pay gap for median gross hourly earnings (excluding overtime) and percentage of males, by number of basic paid hours worked, UK, April 2016
Source: Annual Survey of Hours and Earnings (ASHE) - Office for National Statistics
Notes:
- Employees on adult rates, pay unaffected by absence.
- Figures represent the difference between men's and women's hourly earnings as a percentage of men's earnings.
- 2016 data are provisional.
- Each range is inclusive of the end point but not the start point, i.e. 10-15 includes those working exactly 15 hours but not those working exactly 10 hours.
Download this image Figure 7: Gender pay gap for median gross hourly earnings (excluding overtime) and percentage of males, by number of basic paid hours worked, UK, April 2016
.png (17.7 kB) .xls (85.5 kB)
Figure 8 examines the gender pay gap for high and low earners from 1997 to 2016. For high earners (top decile), the gap for full-time employees has remained largely consistent, fluctuating around approximately 20% (18.8% in 2016). For low earners (bottom decile) the gap has narrowed over the long term, to 4.9% in April 2016, the largest year-on-year decrease in the full-time gender pay gap for the bottom decile since records began in 1997. This is likely to be connected to the introduction of the National Living Wage, as women tend to work in lower paid occupations. For example, the lowest paid occupation group - caring, leisure and other service occupations - has a higher proportion of women working full-time. (78%, source: Labour Force Survey, Quarter 2, EMP04).
Further analysis on the gender pay gap can be found in the later sections of this bulletin under the corresponding sections.
Figure 8: Gender pay gap for median gross hourly earnings (excluding overtime) for full-time employees at selected deciles, UK, April 1997 to 2016

Source: Annual Survey of Hours and Earnings (ASHE) - Office for National Statistics
Notes:
- Employees on adult rates, pay unaffected by absence.
- Figures represent the difference between men's and women's hourly earnings as a percentage of men's earnings.
- Full-time defined as employees working more than 30 paid hours per week (or 25 or more for the teaching professions).
- Dashed lines represent discontinuities in 2004, 2006 and 2011 ASHE estimates.
- 2016 data are provisional.
Download this image Figure 8: Gender pay gap for median gross hourly earnings (excluding overtime) for full-time employees at selected deciles, UK, April 1997 to 2016
.png (22.5 kB) .xls (203.8 kB)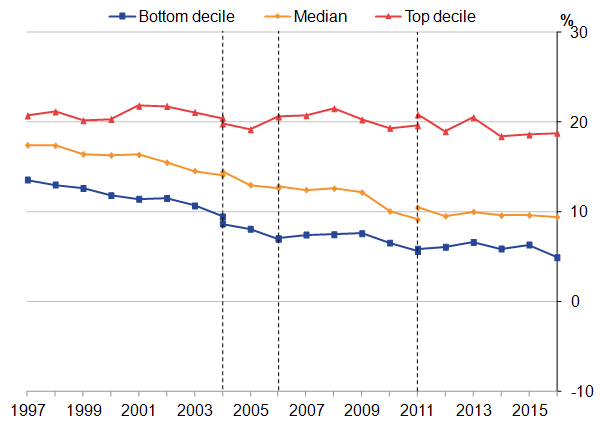
6. Public and private sector pay
Median gross weekly earnings for full-time employees in the public sector have been higher than for the private sector since the start of the series in 1997. Median weekly private sector earnings for full-time employees were £517 in April 2016, compared with £594 for the public sector.
Why is median public sector pay above median private sector pay?
The public and private sectors have workforces which are composed quite differently, with private sector earnings typically more variable than public sector earnings. This can be seen in the graph below, with public sector earnings more concentrated (a higher density peak) around a certain point along the distribution of earnings than the private sector, which contains more very low and very high-paid employees. Consequently, differences in average weekly earnings do not reveal differences in rates of pay for comparable jobs.
Figure 9: An illustrative distribution of public and private sector earnings, UK, April 2016

Source: Annual Survey of Hours and Earnings (ASHE) – Office for National Statistics
Notes:
- Gaussian curves have been fitted to 2016 public and private sector data for indicative purposes only
- 2016 data are provisional.
Download this image Figure 9: An illustrative distribution of public and private sector earnings, UK, April 2016
.png (8.1 kB)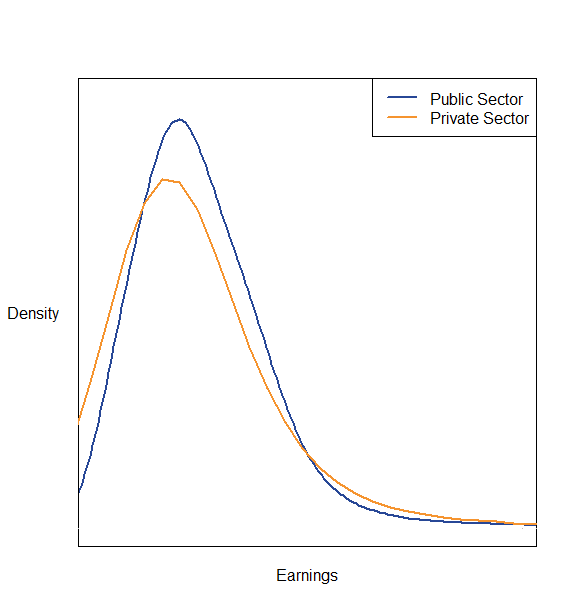
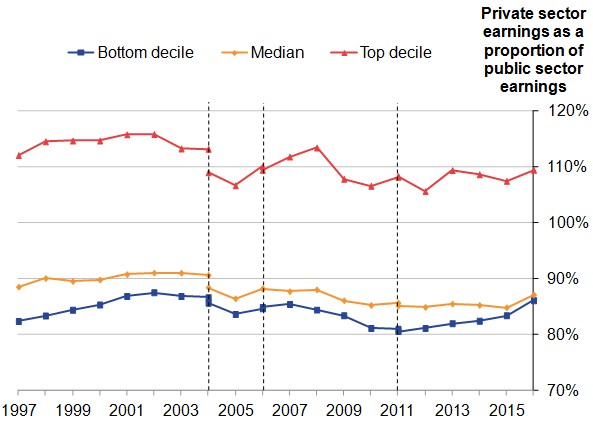
While private sector median earnings have been approximately 85% of public sector earnings between 2010 to 2015, there has been a large rise in private sector earnings (increased by £17, 3.4%) this year compared with public sector earnings (increased by £4, 0.7%). This has resulted in the proportion rising to 87%, showing that private and public sector earnings have closed in the past year (Figure 10). A similar effect occurs at the bottom decile; this is likely to be due to the introduction of the National Living Wage, with a larger proportion of private sector workers in the occupations affected. At the top decile, earnings in the private sector have remained just under 110% of public sector earnings, a trend that has continued since the economic downturn in 2009.
Figure 10: Gross weekly private sector earnings as a proportion of public sector earnings for full-time employees at selected deciles, UK, April 1997 to 2016
Source: Annual Survey of Hours and Earnings (ASHE) - Office for National Statistics
Notes:
- Employees on adult rates, pay unaffected by absence.
- Full-time defined as employees working more than 30 paid hours per week (or 25 or more for the teaching professions).
- Dashed lines represent discontinuities in 2004, 2006 and 2011 ASHE estimates.
- 2016 data are provisional.
- The proportion (y-axis) does not start at 0%.
Download this image Figure 10: Gross weekly private sector earnings as a proportion of public sector earnings for full-time employees at selected deciles, UK, April 1997 to 2016
.png (26.0 kB) .xls (126.5 kB)
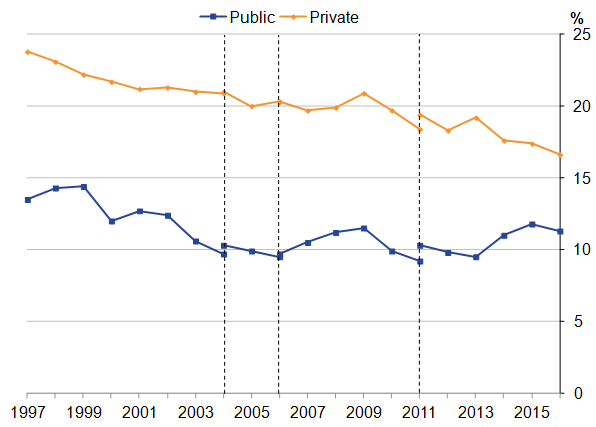
The gender pay gap for full-time employees in the private sector decreased from 17.4% in 2015 to 16.6% in 2016, the lowest since the series began in 1997, continuing the long-term downward trend (Figure 11). The gender pay gap in the public sector has also decreased from 11.8% to 11.3%, continuing its longer-term trend of fluctuating around 10 to 12% since 2003.
Note that the changing composition of the public and private sectors from year to year will influence the gender pay gap figures presented. For example, in a given sector, creation of jobs in higher paying occupations with a high proportion of female employees would act to reduce the gap.
Figure 11: Gender pay gap for median full-time hourly earnings (excluding overtime) for public and private sectors, UK, April 1997 to 2016
Source: Annual Survey of Hours and Earnings (ASHE) - Office for National Statistics
Notes:
- Employees on adult rates, pay unaffected by absence.
- Gender pay gap is defined as the difference between men’s and women’s hourly earnings as a percentage of men’s earnings.
- Full-time defined as employees working more than 30 paid hours per week (or 25 or more for the teaching professions).
- Dashed lines represent discontinuities in 2004, 2006 and 2011 ASHE estimates.
- 2016 data are provisional.
Download this image Figure 11: Gender pay gap for median full-time hourly earnings (excluding overtime) for public and private sectors, UK, April 1997 to 2016
.png (14.7 kB) .xls (173.6 kB)
7. Regional Earnings
In April 2016, London topped the regional list for median earnings for full-time employees by place of work, at £671 per week. Employees here earned £105 more per week than the next highest, the South East (£566) and £132 more than the median for the whole of the UK (£539). The high pay in London is largely due to a high proportion of its labour force being employed in high-paying industries and occupations, and also because many employees are entitled to allowances for working in the capital.
In terms of percentage growth, the West Midlands (increased by 3.7%), the North West (increased by 3.0%) and Wales (increased by 2.9%) have increased the most, while the North East (increased by 0.7%), the East Midlands (increased by 0.9%) and Scotland (increased by 1.5%) have increased the least over the past year.
The regional pattern since the series began in 1997 has remained fairly consistent for the highest earning regions, with London and the South East consistently topping the list. Below this, regions have changed ranking relative to each other with Scotland in particular, showing strong growth in full-time earnings since 1997, rising from eighth to third from 2012 onwards.
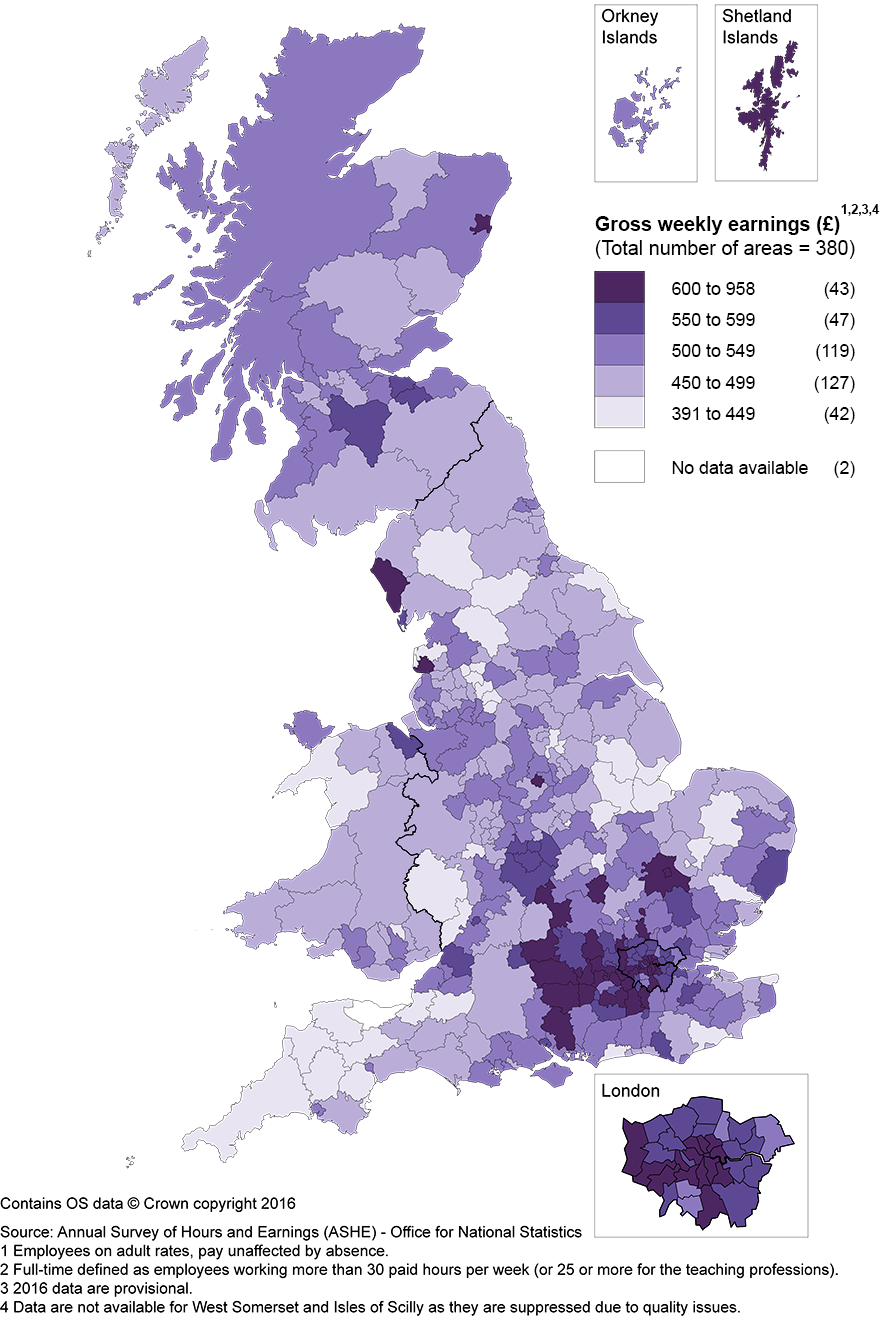
At the local authority level, earnings vary significantly. In April 2016 full-time employees working in the City of London had the highest median gross weekly earnings (£958) and those working in Rossendale (North West) had the lowest (£391). When looking at earnings by place of residence, that is the place where the employee lives, employees living in the City of London also had highest median gross weekly earnings (£1,034), while those living in Craven (Yorkshire and The Humber) had the lowest (£413). A map showing the full-time gross weekly earnings for people working in each local authority district can be seen in Figure 13.
It should be noted that earnings comparisons take no account of regional variations in prices for goods and services and therefore do not necessarily indicate differences in the standard of living. Neither do they take account of differences in the regional composition of the workforce, meaning that like-for-like comparisons may not be appropriate. For example, a region might have a lower level of median earnings than another if it has a higher proportion of employees in industries or occupations with relatively low earnings.
Figure 12: Median full-time gross weekly earnings and percentage change from previous year, by region, UK, April 2016

Source: Annual Survey of Hours and Earnings (ASHE) - Office for National Statistics
Notes:
- Employees on adult rates, pay unaffected by absence.
- Full-time defined as employees working more than 30 paid hours per week (or 25 or more for the teaching professions).
- 2016 data are provisional.
Download this image Figure 12: Median full-time gross weekly earnings and percentage change from previous year, by region, UK, April 2016
.png (18.6 kB) .xls (94.7 kB)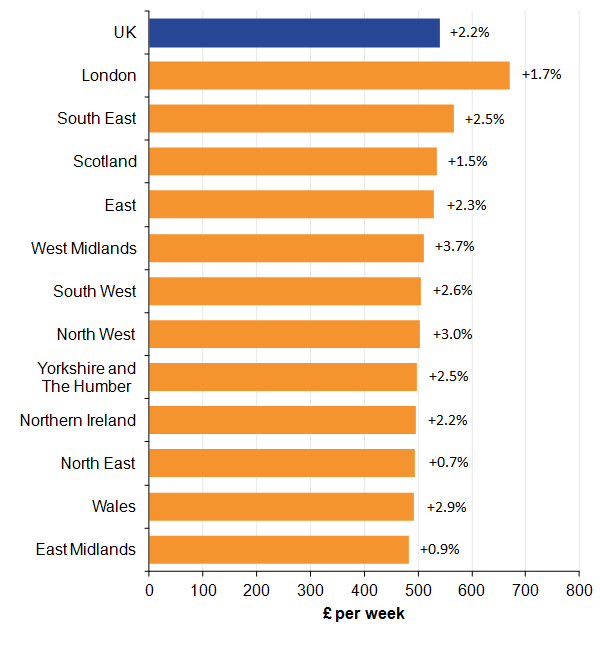
Figure 13: Median full-time gross weekly earnings by place of work, Great Britain, April 2016
Local authority districts
Download this image Figure 13: Median full-time gross weekly earnings by place of work, Great Britain, April 2016
.png (553.4 kB)
8. Earnings by age group
Median weekly earnings for full-time employees reach a maximum in the 40 to 49 age group for men (£668 in April 2016) and in the 30 to 39 age group for women (£547).
Figure 14: Median full-time gross weekly earnings by sex and age group, UK, April 2016
Source: Annual Survey of Hours and Earnings (ASHE) - Office for National Statistics
Notes:
- All employees aged 16 to 17 and employees aged 18 and over on adult rates, pay unaffected by absence.
- Full-time defined as employees working more than 30 paid hours per week (or 25 or more for the teaching professions).
- 2016 data are provisional.
Download this chart Figure 14: Median full-time gross weekly earnings by sex and age group, UK, April 2016
Image .csv .xlsFigure 15 shows gender pay differences by age group. When looking at the differences for full-time employees, the gap is relatively small up to and including those aged 30 to 39 (with the exception of the 16 to 17 age group). From 40 to 49 and upwards, the gap is much wider, with men being paid substantially more on average than women. This is likely to be connected with the fact that women who have children often take time out of the labour market.
Taking full-time and part-time employees together, again men are paid more on average than women for all age groups (except those aged 16 to 17, where the gender pay gap is 0%). Also, for age groups from 22 to 29 upwards, the gap is wider than for full-time employees alone. This indicates that, in these age groups, more women are working part-time in jobs that tend to be lower paid.
Figure 15: Gender pay gap for median gross hourly earnings (excluding overtime) by age group, UK, April 2016
Source: Annual Survey of Hours and Earnings (ASHE) - Office for National Statistics
Notes:
- Employees on adult rates, pay unaffected by absence.
- Figures represent the difference between men's and women's hourly earnings as a percentage of men's earnings.
- Full-time defined as employees working more than 30 paid hours per week (or 25 or more for the teaching professions).
- 2016 data are provisional.
Download this chart Figure 15: Gender pay gap for median gross hourly earnings (excluding overtime) by age group, UK, April 2016
Image .csv .xls9. Earnings by occupation
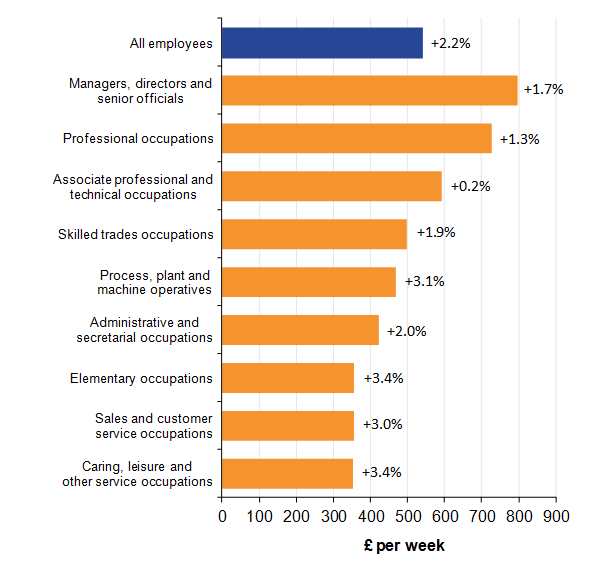
The occupation group with the highest median weekly earnings for full-time employees was managers, directors and senior officials, at £798. Caring, leisure and other service occupations were the lowest paid group, at £353 per week (Figure 16). At this broad level, the lowest paid occupations have seen the largest percentage increases, with caring, leisure and other service occupations and elementary occupations both growing by 3.4% compared with 2015. These occupations, along with sales and customer service occupations, and process, plant and machine operative occupations were those whose first deciles (tenth percentile) for hourly earnings (excluding overtime) were below the new National Living Wage rate (£7.20) in 2015.
Figure 16: Median full-time gross weekly earnings and percentage change from previous year, by major occupation group, UK, April 2016
Source: Annual Survey of Hours and Earnings (ASHE) - Office for National Statistics
Notes:
- Employees on adult rates, pay unaffected by absence.
- Full-time defined as employees working more than 30 paid hours per week (or 25 or more for the teaching professions).
- Occupations as defined by the Standard Occupational Classification 2010.
- 2016 data are provisional.
Download this image Figure 16: Median full-time gross weekly earnings and percentage change from previous year, by major occupation group, UK, April 2016
.png (19.5 kB) .xls (39.4 kB)
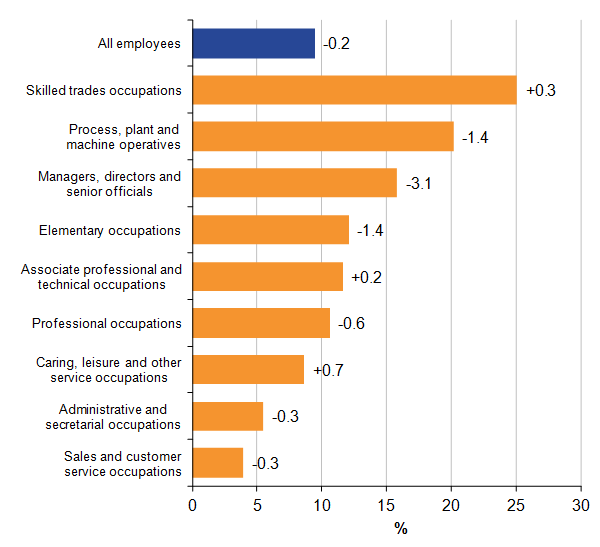
When looking at the gender pay gap by occupation for full-time employees, it is in favour of men for all the main occupation groups, ranging from 3.9% for sales and customer service occupations to 25.1% for skilled trades occupations in April 2016 (Figure 17).
The largest decreases in the gender pay gap in 2016 were seen in managers, directors and senior officials’ occupations (decreased by 3.1 percentage points), elementary occupations (decreased by 1. percentage points) and process, plant and machine operative occupations (decreased by 1. percentage points), whilst there were slight increases in caring, leisure and other service occupations (increased by 0.7 percentage points), skilled trades occupations (increased by 0.3 percentage points) and associate professional and technical occupations (increased by 0.2 percentage points).
Figure 17: Gender pay gap for median full-time hourly earnings (excluding overtime) and the year-on-year percentage point change, by major occupation group, UK, April 2016
Source: Annual Survey of Hours and Earnings (ASHE) - Office for National Statistics
Notes:
- Employees on adult rates, pay unaffected by absence.
- Gender pay gap is defined as the difference between men’s and women’s hourly earnings as a percentage of men’s earnings.
- Full-time defined as employees working more than 30 paid hours per week (or 25 or more for the teaching professions).
- Occupations as defined by the Standard Occupational Classification 2010.
- 2016 data are provisional.
Download this image Figure 17: Gender pay gap for median full-time hourly earnings (excluding overtime) and the year-on-year percentage point change, by major occupation group, UK, April 2016
.png (17.9 kB) .xls (43.5 kB)
10. Earnings by business size band
The size of the business affects how much an employee earns on average, with the median gross weekly earnings increasing for all employees (as well as for full-time and part-time employees separately) as the size band of the business increases (£279 for businesses in the 0 to 9 employee size band compared with £465 for businesses in the 250+ employee size band – see Figure 18).
Figure 18: Median full-time gross weekly earnings, by business size band, UK, April 2016
Source: Annual Survey of Hours and Earnings (ASHE) - Office for National Statistics
Notes:
- Employees on adult rates, pay unaffected by absence.
- Full-time defined as employees working more than 30 paid hours per week (or 25 or more for the teaching professions).
- 2016 data are provisional.
- Size bands are based on employee numbers from the Inter-Departmental Business Register (IDBR).
Download this chart Figure 18: Median full-time gross weekly earnings, by business size band, UK, April 2016
Image .csv .xls11. The make-up of earnings
Overtime payments as a proportion of mean gross weekly earnings for full-time employees have remained relatively stable in recent years (2.5%), following a sharp fall coinciding with the economic downturn (Figure 19). This is due to a fall in the number of overtime hours worked. The proportion accounted for by incentive payments has decreased steadily since 2010, to 1.1% in 2016 and shift premium has remained consistently around 1.0%.
As is the case in previous years, overtime and incentive payments account for a greater proportion of mean gross weekly pay for men than they do for women.
What do the different components of pay mean?
Annual Survey of Hours and Earnings (ASHE) collects detailed information about the earnings of employee jobs; this includes the various components comprising an employee’s earnings before tax and national insurance deductions.
Basic pay
is the amount paid to an employee before any extras are added or taken off, such as reductions because of salary sacrifice schemes or an increase due to overtime or a bonus.Overtime pay
is the amount paid to an employee as a result of working overtime hours.Incentive pay
is the amount paid to an employee as a result of meeting a performance/productivity objective, including profit sharing, bonus, piecework and commission payments.Shift premium pay
is the extra amount paid to an employee as a result of working a non-regular shift, such as a weekend or night shift.Other pay
is the amount received by the employee for the work they carry out which is not included in any of the other components, such as car or on-call allowances.
Figure 19: Non-basic components of pay as a proportion of mean full-time gross weekly earnings, April 2000 to 2016

Source: Annual Survey of Hours and Earnings (ASHE) - Office for National Statistics
Notes:
- Employees on adult rates, pay unaffected by absence.
- Full-time defined as employees working more than 30 paid hours per week (or 25 or more for the teaching professions).
- Dashed lines represent discontinuities in 2004, 2006 and 2011 ASHE estimates.
- A methodological change in 2005 means that estimates for incentive payments from this time onwards are not comparable with earlier estimates.
- 2016 data are provisional.
Download this image Figure 19: Non-basic components of pay as a proportion of mean full-time gross weekly earnings, April 2000 to 2016
.png (23.3 kB) .xls (46.6 kB)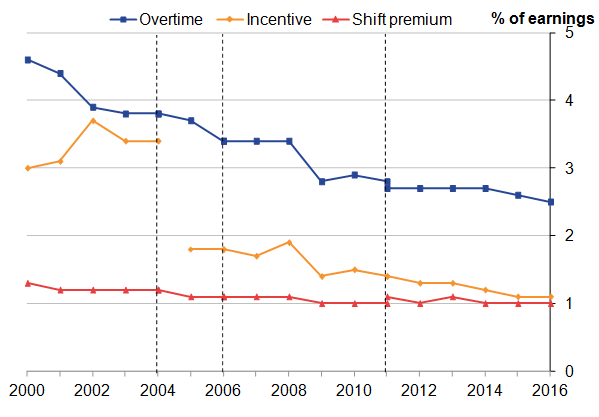
12. Hours paid
Over the long term, the mean average number of total paid hours per week for full-time employees has decreased from 40.0 in 1997 to 39.2 in 2016. This decrease is particularly notable for full-time men (41.5 total paid hours in 1997 compared to 40.2 total paid hours in 2016), with a sharp dip between 2008 and 2009, from 40.7 to 40.1 hours. Over this period, full-time women’s total paid hours have remained stable at around 37.5, although they have slightly increased to 37.6 between 2015 and 2016.
Examining the components of paid hours, there is a long-term decrease in overtime paid hours worked, particularly for men, although this has levelled off in recent years. However, there has been a very slight increase in basic paid hours worked since 1997 (see Figure 20).
Figure 20: Components of mean full-time weekly paid hours of work, UK, April 1997 and April 2016

Source: Annual Survey of Hours and Earnings (ASHE) - Office for National Statistics
Notes:
- Data labels are in hours
- Employees on adult rates, pay unaffected by absence.
- Full-time defined as employees working more than 30 paid hours per week (or 25 or more for the teaching professions).
- 2016 data are provisional.
Download this image Figure 20: Components of mean full-time weekly paid hours of work, UK, April 1997 and April 2016
.png (19.4 kB) .xls (32.3 kB)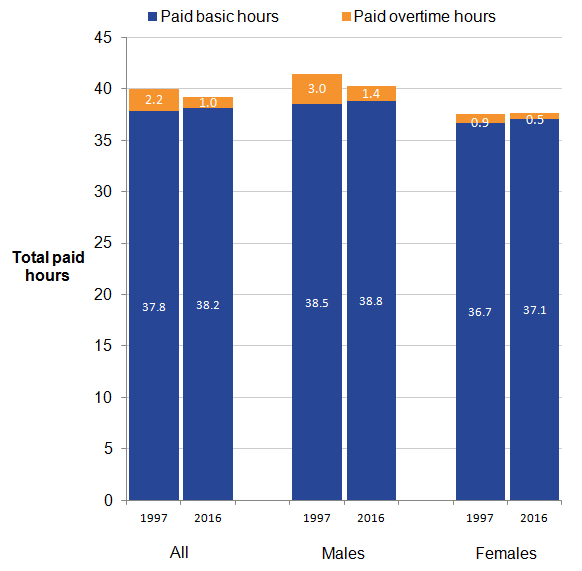
13. Quality and methodology
The Annual Survey of Hours and Earnings, Low Pay and Annual Survey of Hours and Earnings Pension Results Quality and Methodology Information documents contain important information on:
the strengths and limitations of the data and how it compares with related data
users and uses of the data
how the output was created
the quality of the output including the accuracy of the data