Table of contents
- Main points
- Things you need to know about this release
- The total trade deficit widened in the three months to June 2018
- Removing the effects of inflation, the total trade deficit widened in the three months to June 2018
- The trade in goods deficit widened with both EU and non-EU countries in the three months to June 2018
- Falling car and aircraft exports to non-EU countries was the leading factor for the widening of the total trade deficit in the three months to June 2018
- Rising exports for both goods and services led to a narrowing of the total trade deficit in the 12 months to June 2018
- Exports and imports of goods to and from the EU increased by more compared with non-EU countries in the 12 months to June 2018
- Explore UK trade in goods country-by-commodity data via our interactive tools
- Links to related statistics
- Quality and methodology
1. Main points
The total UK trade deficit widened £4.7 billion to £8.6 billion in the three months to June 2018, due mainly to falling goods exports and rising goods imports.
Removing the effect of inflation, the total trade deficit widened £4.1 billion in the three months to June 2018; falling goods export volumes were the main factor as prices generally increased.
The trade in goods deficit widened £2.9 billion with countries outside the EU and £2.6 billion with the EU in the three months to June 2018.
Falling car and aircraft exports and rising imports of unspecified goods (including non-monetary gold) to and from non-EU countries were the leading factors in the widening of the total trade deficit in the three months to June 2018.
Excluding erratic commodities (mainly aircraft and non-monetary gold), the deficit widened £2.2 billion to £9.0 billion in the three months to June 2018.
Rising exports for both goods and services led to a £6.2 billion narrowing of the total trade deficit in the 12 months to June 2018.
Exports and imports of goods to and from the EU both increased by more compared with non-EU countries in the 12 months to June 2018.
Revisions to the total trade balance (goods and services) for April and May 2018 were downward revisions of £0.5 billion and £0.4 billion respectively.
2. Things you need to know about this release
International Passenger Survey
Estimates derived from the International Passenger Survey (IPS) are used to help measure imports and exports of travel services. The IPS is in the process of transferring data collection from paper forms to tablet computers. While initial analysis of the new data is ongoing, there will be a rolling time lag until the new estimates for each observed quarter are used in the compilation of national accounts estimates. This is to allow for thorough checking and to ensure that no discontinuity exists as a result of the change in mode of collection. Therefore, headline trade or other national accounts estimates will include some forecast data for imports and exports of travel services in the most recent periods. More information is available in the Overseas travel and tourism release.
Data revision policy
All of the data in this release have been revised back to April 2018 when compared with trade figures published in our previous trade bulletin on 10 July 2018. Data in this release are consistent with estimates published in Quarterly national accounts releases published on 29 June 2018 for Quarter 1 (Jan to Mar) 1998 to Quarter 1 2018.
National Statistics designation status
The UK Statistics Authority suspended the National Statistics designation of UK trade (PDF 72.8KB) on 14 November 2014. We have now responded to all of the specific requirements of the reassessment of UK trade and are in the final stages of providing evidence to the Authority. We are undertaking a programme of improvements to UK trade statistics in line with the UK trade development plan, including more detail and improvements now published to address anticipated future demands. While delivering against this plan, we will continue to work with the Office for Statistics Regulation team to regain National Statistics status for UK trade statistics. We welcome feedback on this development plan.
New GDP publication model
From July 2018, we introduced a new publishing model for gross domestic product (GDP). The move to a new publication model was supported by two reviews of economic statistics – The Barker-Ridgeway National Statistics Quality Review and Sir Charles Bean’s Independent Review of Economic Statistics (PDF, 5.1MB) – which concluded that we should aim for timely GDP estimates while maintaining a balance with the quality of data available. The new model reconsiders the balance between the timeliness and accuracy of GDP estimates. To enable delivery to GDP balancing for the quarterly estimates, the surveys that feed into this release need to close closer to their collection date, resulting in some loss of data content within the initial short-term estimates. Users should note that month-on-month observations often get revised in later periods due to new data being submitted. Users should therefore be cautious about placing a strong emphasis on individual monthly movements.
Back to table of contents3. The total trade deficit widened in the three months to June 2018
Figure 1 shows changes to goods, services and total trade balances, exports and imports in the three months to June 2018 compared with the three months to March 2018.
The total UK trade deficit (goods and services) widened £4.7 billion to £8.6 billion in the three months to June 2018 (Figure 1). This was due to a £5.5 billion widening of the trade in goods deficit, resulting from a combination of falling goods exports (£3.1 billion) and rising goods imports (£2.3 billion).
The services surplus widened by £0.7 billion due mainly to falling imports of services (£0.7 billion) and a small increase in services exports (£0.1 billion).
Figure 1: Change to total UK trade balances, exports and imports, three months to June 2018 compared with three months to March 2018

Source: Office for National Statistics
Notes:
We have made a change to the presentation of this figure since the previous release; as per our previous release the arrow direction indicates whether a component has increased or decreased, while the colour now denotes the impact the direction of a movement has on the trade balance.
For example, an increase in imports is denoted by an upward red arrow, as a rise in imports has a negative impact on the trade balance, while an increase in exports is denoted by an upward green arrow, as a rise in exports has a positive impact on the trade balance.
Download this image Figure 1: Change to total UK trade balances, exports and imports, three months to June 2018 compared with three months to March 2018
.PNG (20.3 kB)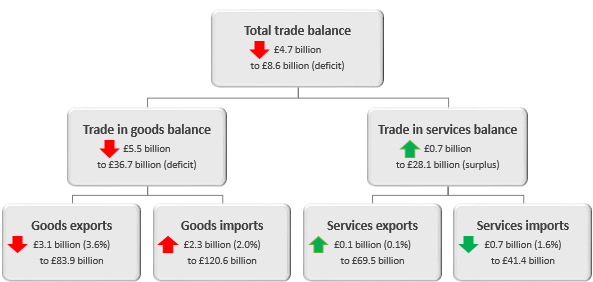
Figure 2 shows UK trade balances on a three-month on three-month basis between June 2016 and June 2018. The total trade balance ranged from a deficit of £13.7 billion in the three months to September 2016, to a deficit of £3.8 billion in the three months to March 2018.
Excluding erratics (mainly aircraft and non-monetary gold) the total trade balance widened by £2.2 billion in the three months to June 2018. This follows a relatively large upward impact on the total from erratic commodities in the three months to March 2018.
Figure 2: UK trade balances, three-month on three-month, June 2016 to June 2018
Source: Office for National Statistics
Notes:
- The total trade balance is the sum of the goods and services trade balances.
Download this chart Figure 2: UK trade balances, three-month on three-month, June 2016 to June 2018
Image .csv .xlsFigure 3 shows the change in exports, imports and the balance for trade in goods on a three-month-on-three-month basis between June 2016 and June 2018.
The widening of the trade in goods deficit in the three months to June 2018 (Figure 3) was due mostly to falling exports of cars and aircraft and increasing imports of unspecified goods (including non-monetary gold).
The widening seen in the three months to September 2016 was due mainly to an increase in imports of machinery and transport equipment, while the increase in exports in the three months to December 2016 was due mainly to increased exports of unspecified goods.
Figure 3: Change in UK goods exports, imports and trade balance, three months compared with previous three months, June 2016 to June 2018
Source: Office for National Statistics
Notes:
- The goods balance is the difference between goods exports and imports.
Download this chart Figure 3: Change in UK goods exports, imports and trade balance, three months compared with previous three months, June 2016 to June 2018
Image .csv .xls4. Removing the effects of inflation, the total trade deficit widened in the three months to June 2018
This section presents volume and price estimates of both the total UK trade balances and total exports using chained volume measures (CVMs) and implied deflators (IDEFs). A CVM is a measure that has had the effect of inflation removed. An IDEF shows the implied change in average prices for the respective components of the trade balance.
Figure 4 shows CVMs for the UK trade balances, three-month-on-three-month, between June 2016 and June 2018. In the three months to June 2018, the total UK trade deficit widened £4.1 billion to £7.2 billion.
Figure 4: UK chained volume measure trade balances, three-month on three-month, June 2016 to June 2018
Source: Office for National Statistics
Download this chart Figure 4: UK chained volume measure trade balances, three-month on three-month, June 2016 to June 2018
Image .csv .xlsFigure 5 shows the CVM and IDEF for total exports (goods and services) on a three-month-on-three-month basis between June 2016 and June 2018. The widening of the total trade deficit on a CVM basis was due mainly to a £5.3 billion (3.6%) decrease in export volumes in the three months to June 2018.
Figure 5: UK total exports chained volume measure and implied deflator, three-month on three-month, June 2016 to June 2018
Source: Office for National Statistics
Notes:
Implied deflator (IDEF): An implied deflator is a series that shows the implied change in average prices for a variable by dividing the current price series by the real or volume series.
Chained volume measure (CVM): A time series with the effect of inflation removed; they are weighted and chained volume series that hold prices from previous periods constant. In line with National Accounts practice, the last base year and reference year for the chained volume estimates have moved forward one year from 2015 to 2016.
Download this chart Figure 5: UK total exports chained volume measure and implied deflator, three-month on three-month, June 2016 to June 2018
Image .csv .xls5. The trade in goods deficit widened with both EU and non-EU countries in the three months to June 2018
Figure 6 shows the change in goods exports, imports and trade balances with EU and non-EU countries between the three months to June 2018 and the three months to March 2018.
The trade in goods deficit widened £2.6 billion to £25.4 billion with EU countries and by £2.9 billion to £11.3 billion with non-EU countries in the three months to June 2018 (Figure 6).
A fall in exports was the main reason for the widening of the trade in goods deficit with non-EU countries, while a rise in imports was the main reason for the widening of the trade in goods deficit with EU countries in the three months to June 2018; goods exports to non-EU countries fell by £1.9 billion, while goods imports from the EU rose by £1.3 billion.
Figure 6: Change in UK goods exports, imports and trade balance with EU and non-EU countries, three months to June 2018 compared with three months to March 2018
Source: Office for National Statistics
Notes:
- The goods trade balance is the difference between goods exports and imports: when a change in the value of exports exceeds the change in respective imports, the change to the trade balance is positive; when imports exceed exports, the trade balance is negative.
Download this chart Figure 6: Change in UK goods exports, imports and trade balance with EU and non-EU countries, three months to June 2018 compared with three months to March 2018
Image .csv .xls6. Falling car and aircraft exports to non-EU countries was the leading factor for the widening of the total trade deficit in the three months to June 2018
The leading factors in the £4.7 billion widening of the total trade deficit (goods and services) in the three months to June 2018 was falling exports of machinery and transport equipment (mainly cars and aircraft) to non-EU countries.
Using our newly-published trade in goods by country and commodity data, on a balance of payments basis, non-seasonally adjusted, we are able to analyse commodity movements at a lower level, that is, by country.
Figure 7 shows the change in UK exports of machinery and transport equipment to non-EU countries in the three months to June 2018 compared with the three months to March 2018. The country that contributed most to the decrease in exports of machinery and transport was the United States including Puerto Rico, followed by India and the United Arab Emirates.
Rising imports of unspecified goods from non-EU countries also had a large impact on the widening of the total trade deficit in the three months to June 2018.
Figure 7: Change in UK export of machinery and transport equipment to non-EU countries, three months to June 2018 compared with three months to March 2018

Source: Office for National Statistics
Notes:
Users should note that detailed country by commodity data is not seasonally adjusted, whereas data presented elsewhere in this release are seasonally adjusted.
This means data displayed in this chart will not match seasonally adjusted data presented elsewhere in this release.
Download this image Figure 7: Change in UK export of machinery and transport equipment to non-EU countries, three months to June 2018 compared with three months to March 2018
.png (18.8 kB) .xlsx (20.2 kB)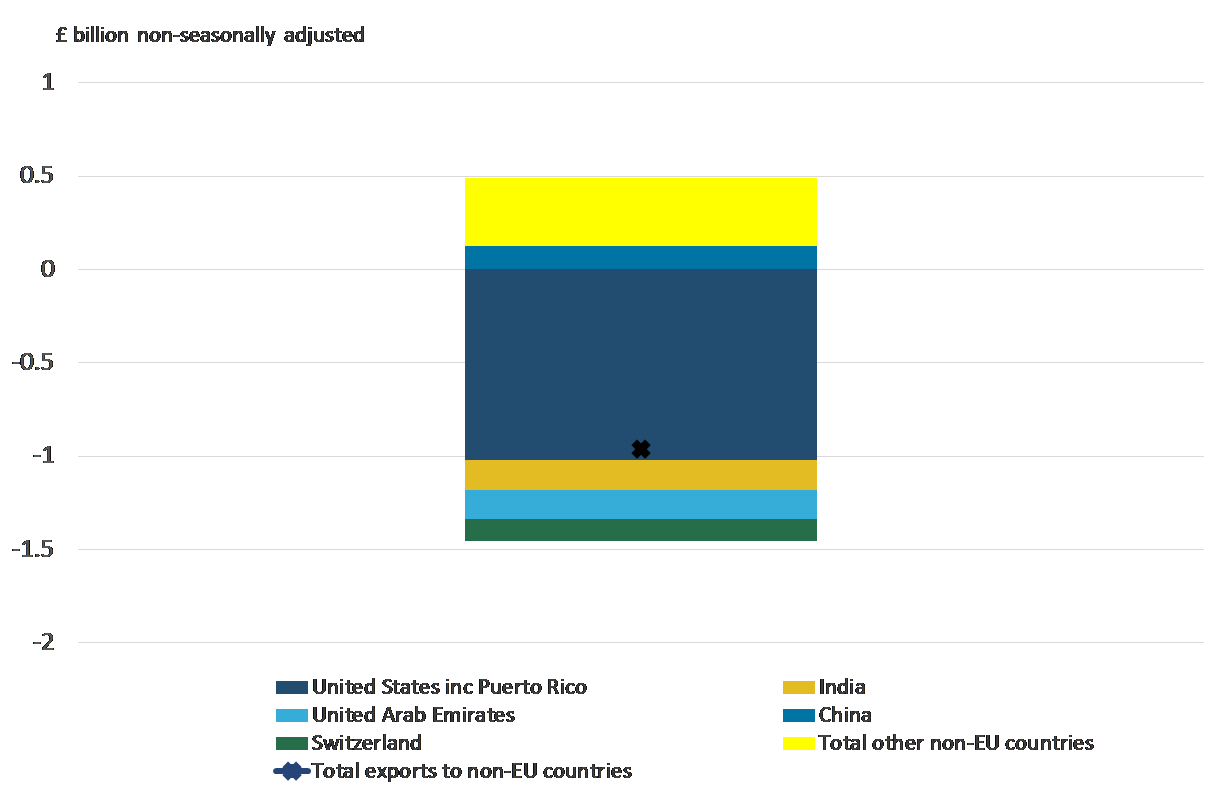
7. Rising exports for both goods and services led to a narrowing of the total trade deficit in the 12 months to June 2018
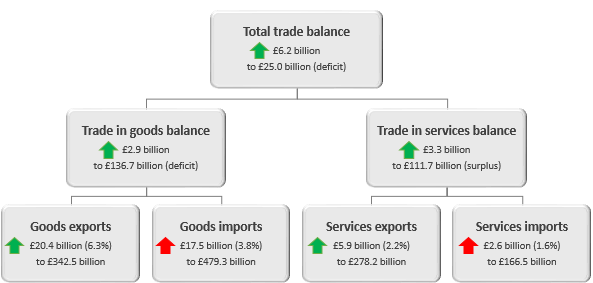
Figure 8 shows the change to the total trade balance, the goods and services trade balances, and exports and imports of goods and services in the 12 months to June 2018 compared with the 12 months to June 2017.
The total UK trade deficit (goods and services) narrowed £6.2 billion to £25.0 billion in the 12 months to June 2018. The improvement was driven by both exports of goods and services increasing by more than their respective imports.
The goods deficit narrowed £2.9 billion to £136.7 billion in the 12 months to June 2018; exports of goods increased £20.4 billion (6.3%) while imports of goods increased by a lesser £17.5 billion (3.8%).
The trade in services surplus widened £3.3 billion to £111.7 billion due to exports rising £5.9 billion (2.2%) compared with imports, which increased £2.6 billion (1.6%).
Figure 8: Change to total UK trade balances, exports and imports, 12 months to June 2018 compared with 12 months to June 2017
Source: Office for National Statistics
Notes:
We have made a change to the presentation of this figure since the previous release; as per our previous release the arrow direction indicates whether a component has increased or decreased, while the colour now denotes the impact the direction of a movement has on the trade balance.
For example, an increase in imports is denoted by an upward red arrow, as a rise in imports has a negative impact on the trade balance, while an increase in exports is denoted by an upward green arrow, as a rise in exports has a positive impact on the trade balance.
Download this image Figure 8: Change to total UK trade balances, exports and imports, 12 months to June 2018 compared with 12 months to June 2017
.PNG (20.2 kB)
8. Exports and imports of goods to and from the EU increased by more compared with non-EU countries in the 12 months to June 2018
Figure 9 shows the change in UK goods exports, imports and the trade balance with EU and non-EU countries in the 12 months to June 2018 compared with the 12 months to June 2017.
The goods deficit with the EU narrowed £1.5 billion to £95.2 billion compared with a narrowing of £1.4 billion to £41.6 billion for non-EU countries in the 12 months to June 2018.
However, while the improvement to the goods deficit was similar between EU and non-EU countries in the 12 months to June 2018, exports and imports to and from EU countries rose by a much larger amount compared with exports and imports to and from non-EU countries. Goods exports to the EU rose by £13.4 billion compared with £7.0 billion for non-EU countries, while imports from EU countries increased £11.9 billion compared with £5.5 billion for non-EU countries.
Figure 9: Change in UK goods imports, exports and trade balance with EU and non-EU countries, 12 months to June 2018 compared with 12-months to June 2017
Source: Office for National Statistics
Download this chart Figure 9: Change in UK goods imports, exports and trade balance with EU and non-EU countries, 12 months to June 2018 compared with 12-months to June 2017
Image .csv .xlsFigure 10 shows the percentage split of goods exports and imports by countries inside and outside of the EU in the 12 months to June 2018.
Figure 10: UK goods exports and imports, percentage split by EU and non-EU countries, 12 months to June 2018
Source: Office for National Statistics
Notes:
- The goods trade balance is the difference between goods exports and imports: when a change in the value of exports exceeds the change in respective imports, the change to the trade balance will be positive; when imports exceed exports, the trade balance will be negative.
Download this chart Figure 10: UK goods exports and imports, percentage split by EU and non-EU countries, 12 months to June 2018
Image .csv .xls9. Explore UK trade in goods country-by-commodity data via our interactive tools
For more information about our methods and how we compile these statistics, please see Trade in goods, country-by-commodity experimental data: 2011 to 2016. Users should note that the data published alongside this release are no longer experimental.
What goods are traded between the UK and the rest of the world? Our data break down UK trade in goods with 234 countries by 125 commodities.
Use our map to get a better understanding of UK trade in goods with a particular country. Select a country by hovering over it or using the drop-down menu.
Embed code
What about trade in a particular commodity? What percentage of UK car exports goes to the EU? Where does the UK's imported tea and coffee come from?
Use our interactive tools to understand UK trade of a particular commodity.
Select a commodity from the drop-down menu, or click through the levels to explore the data.
UK trade in goods by commodity with the rest of the world, imports and exports, 2012 to 2017
UK exports, 2017
Embed code
UK imports, 2017
Embed code
11. Quality and methodology
Trade is measured through both imports and exports of goods and/or services. Data are supplied by over 30 sources including several administrative sources, HM Revenue and Customs (HMRC) being the largest.
This monthly release contains tables showing the total value of trade in goods together with index numbers of volume and price. Figures are analysed by broad commodity group (values and indices) and according to geographical area (values only). In addition, the UK trade statistical bulletin also includes early monthly estimates of the value of trade in services.
Further qualitative data and information can be found in the attached datasets. This includes data on:
Detailed methodological notes are published in the UK Balance of Payments, The Pink Book 2017.
The UK trade methodology web pages have been developed to provide detailed information about the methods used to produce UK trade statistics.
The UK trade Quality and Methodology Information report contains important information on:
the strengths and limitations of the data and how it compares with related data
uses and users of the data
how the output was created
the quality of the output including the accuracy of the data