Table of contents
- UK GDP grew by 0.4% in Quarter 2 (April to June) 2018
- GDP growth was driven by services, offset by a fall in production
- Three-month growth continued to recover from flat growth seen in the three months to April 2018
- GDP increased by 0.1% in June 2018
- Growth over the first half of the year remained modest by historical standards
- Strong growth in services was driven by retail, which saw a boost from the good weather
- Production continued its downward trend, with notable falls in manufacturing and energy production
- Construction returns to growth after weakening throughout 2018
- Households, government and gross capital formation all contributed positively to growth
- Growth in compensation of employees slowed in Quarter 2 (April to June) 2018, but still contributed positively to growth
- Things you need to know about this release
- Quality and methodology
- Related links
1. UK GDP grew by 0.4% in Quarter 2 (April to June) 2018
Figure 1: The rate of quarterly GDP growth picked up from growth of 0.2% in Quarter 1 (Jan to Mar) 2018
UK GDP growth, Quarter 3 (July to Sept) 2016 to Quarter 2 (Apr to June) 2018
Source: Office for National Statistics
Notes:
- Q1 refers to Quarter 1 (Jan to Mar), Q2 refers to Quarter 2 (Apr to June), Q3 refers to Quarter 3 (July to Sept), Q4 refers to Quarter 4 (Oct to Dec).
Download this chart Figure 1: The rate of quarterly GDP growth picked up from growth of 0.2% in Quarter 1 (Jan to Mar) 2018
Image .csv .xlsCommenting on today’s gross domestic product (GDP) figures, Head of National Accounts Rob-Kent Smith said:
“The economy picked up a little in the second quarter with both retail sales and construction helped by the good weather and rebounding from the effects of the snow earlier in the year. However, manufacturing continued to fall back from its high point at the end of last year and underlying growth remained modest by historical standards.
“The UK’s trade deficit noticeably worsened as exports of cars and planes declined sharply while imports rose.”
2. GDP growth was driven by services, offset by a fall in production
Figure 2: Services were the largest contributor to quarterly GDP growth, at 0.42 percentage points
Contribution to UK GDP growth in Quarter 2 (Apr to June) 2018
Source: Office for National Statistics
Download this chart Figure 2: Services were the largest contributor to quarterly GDP growth, at 0.42 percentage points
Image .csv .xlsServices industries had robust growth of 0.5% in Quarter 2 (Apr to June) 2018, which contributed 0.42 percentage points to overall gross domestic product (GDP) growth. Growth of 0.9% in construction also contributed positively to GDP growth.
However, contraction of 0.8% in the production industries contributed negatively to headline GDP growth.
Back to table of contents3. Three-month growth continued to recover from flat growth seen in the three months to April 2018
Figure 3: Rolling three-month growth increased by 0.4%, up from 0.1% in the three months to May
UK GDP growth, three-months on previous three-months, May to July 2016 until April to June 2018
Source: Office for National Statistics
Notes:
- Rolling three-month data is calculated by comparing growth in a three-month period with growth in the previous three-month period, for example, growth in March to May compared with the previous December to February.
Download this chart Figure 3: Rolling three-month growth increased by 0.4%, up from 0.1% in the three months to May
Image .csv .xlsRolling three-month growth dipped in early 2018, with flat growth in the three months to April. This was in some part related to the bad weather seen in the first quarter of 2018. However, the latest figures show a continuation of the positive growth seen in the three months to May, making the most recent three-month growth rate comparable to growth rates through 2017.
Rolling three-month growth is based on output gross value added (GVA) and therefore there will be discrepancies in the time series with our quarterly estimates of gross domestic product (GDP), which include information on the expenditure and income approaches to measuring GDP.
Back to table of contents4. GDP increased by 0.1% in June 2018
Table 1: Breakdown of GDP growth rates by month
| Apr-18 | May-18 | Jun-18 | Quarter 2 2018 | |
|---|---|---|---|---|
| GDP | 0.2% | 0.3% | 0.1% | 0.4% |
| Index of Services | 0.4% | 0.2% | 0.0% | 0.5% |
| Index of Production | -0.7% | -0.2% | 0.4% | -0.8% |
| Manufacturing | -1.2% | 0.6% | 0.4% | -0.9% |
| Construction | -0.1% | 2.9% | 1.4% | 0.9% |
| Agriculture | 0.2% | 0.2% | -0.2% | 0.0% |
| Source: Office for National Statistics | ||||
Download this table Table 1: Breakdown of GDP growth rates by month
.xls (37.4 kB)The monthly gross domestic product (GDP) growth rate was 0.2% in April 2018, 0.3% in May and 0.1% in June.
The monthly growth rate for GDP is volatile and therefore it should be used with caution and alongside other measures such as the three-month growth rate when looking for an indicator of the longer-term trend of the economy. However, it is useful in highlighting one-off changes that can be masked by three-month growth rates.
Back to table of contents5. Growth over the first half of the year remained modest by historical standards
Figure 4: Growth in the first half of 2018 was the same as growth in the second half of 2017
UK GDP growth, six-months on previous six-months, January to June 2010 until January to June 2018
Source: Office for National Statistics
Download this chart Figure 4: Growth in the first half of 2018 was the same as growth in the second half of 2017
Image .csv .xlsWeather has been a factor in the performance of the economy in the first two quarters of 2018. Poor weather contributed to the low level of growth in Quarter 1 (Jan to Mar) 2018, although it wasn’t the only factor (see preliminary estimate for Quarter 1). In Quarter 2 (Apr to June) 2018, affected areas such as retail and construction saw some recovery from Quarter 1’s slowdown. Furthermore, good weather in the three months to June boosted growth to an extent in some sectors.
In this context, it is useful to consider the economy’s performance over the first half of the year. When comparing growth of six-month periods, growth in the first half of 2018 was similar to the last half of 2017. However, this continues a trend of slowing growth since 2014.
Back to table of contents6. Strong growth in services was driven by retail, which saw a boost from the good weather
Figure 5: Services industries grew by 0.5% in Quarter 2 (Apr to June) 2018
Growth, Quarter 3 (July to Sept) 2016 to Quarter 2 (Apr to June) 2018

Source: Office for National Statistics
Notes:
- Q1 refers to Quarter 1 (Jan to Mar), Q2 refers to Quarter 2 (Apr to June), Q3 refers to Quarter 3 (July to Sept), Q4 refers to Quarter 4 (Oct to Dec).
Download this image Figure 5: Services industries grew by 0.5% in Quarter 2 (Apr to June) 2018
.png (20.2 kB) .xlsx (24.2 kB)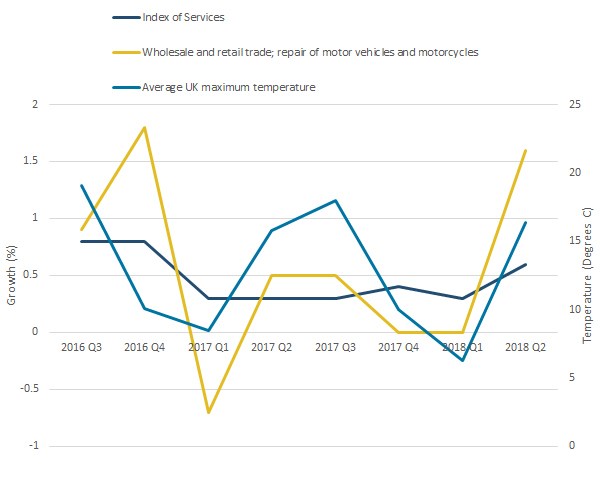
Services industries experienced robust growth of 0.5% in Quarter 2 (Apr to June) 2018. This was driven by strong growth in wholesale and retail trade of 1.6% (contributing 0.16 percentage points). Within this, retail trade growth was particularly strong (2.1%), as a result of the warm weather seen in this quarter (see Retail sales bulletin). This growth was also due partially to a bounce back from weaker growth in Quarter 1 (Jan to Mar) 2018. Figure 5 shows the strong relationship between retail sales growth and average UK maximum temperature.
There was growth in most services industries. Retail and wholesale trade were the largest contributors to growth, at 0.11 percentage points and 0.05 percentage points respectively. Computer programming had a growth of 1.9%, contributing 0.05 percentage points to headline gross domestic product (GDP).
Back to table of contents7. Production continued its downward trend, with notable falls in manufacturing and energy production
Figure 6: Production had a second month of negative rolling three-month growth, falling by 0.8%
Growth, three-months on previous three-months, May to July 2017 until April to June 2018
Source: Office for National Statistics
Notes:
- Rolling three-month data is calculated by comparing growth in a three-month period with growth in the previous three-month period, for example growth in March to May compared with the previous December to February.
Download this chart Figure 6: Production had a second month of negative rolling three-month growth, falling by 0.8%
Image .csv .xlsGrowth in the production industries fell by 0.8% in Quarter 2 (Apr to June) 2018. This was due primarily to manufacturing growth of negative 0.9%, which was itself driven by a notable fall in April. This was the second consecutive quarter of negative growth in manufacturing. Exports picked up in the last month of the quarter, however, the domestic market continued to show signs of weakness (see Index of Production bulletin). Quarterly growth in the energy sector fell due to a fall in demand as a result of the warm weather. However, there was an increase in growth in the last month of the quarter.
Mining and quarrying growth (0.7%) continued to be dampened, due partially to the maintenance on the Sullom Voe oil terminal in May. Other ongoing maintenance also affected the monthly growth for June.
Back to table of contents8. Construction returns to growth after weakening throughout 2018
Figure 7: Construction grew by 0.9% in Quarter 2 (Apr to June) 2018
UK construction growth, three-months on previous three-months, May to July 2017 until April to June 2018
Source: Office for National Statistics
Notes:
- Rolling three-month data is calculated by comparing growth in a three-month period with growth in the previous three-month period, for example, growth in March to May compared with the previous December to February.
Download this chart Figure 7: Construction grew by 0.9% in Quarter 2 (Apr to June) 2018
Image .csv .xlsConstruction recovered in the most recent period, following three consecutive months of negative rolling three-month growth. Growth in Quarter 2 (Apr to June) 2018 was similar to growth rates seen immediately before the period of contraction. Growth this quarter was due partially to a bounce back from the negative growth seen in the previous periods, although there is some evidence that warm weather also contributed to an increase in construction output.
Back to table of contents9. Households, government and gross capital formation all contributed positively to growth
Figure 8: The expenditure approach to measuring GDP increased by 0.4% in Quarter 2 (Apr to June) 2018
Growth and contribution to growth, Quarter 3 (July to Sept) 2016 to Quarter 2 (Apr to June) 2018
Source: Office for National Statistics
Notes:
- Q1 refers to Quarter 1 (Jan to Mar), Q2 refers to Quarter 2 (Apr to June), Q3 refers to Quarter 3 (July to Sept), Q4 refers to Quarter 4 (Oct to Dec).
Download this chart Figure 8: The expenditure approach to measuring GDP increased by 0.4% in Quarter 2 (Apr to June) 2018
Image .csv .xlsGrowth in the expenditure approach to measuring GDP was 0.4% in Quarter 2. Household expenditure growth remained subdued at 0.3%, contributing 0.2 percentage points to GDP growth. Business investment growth was modest at 0.5%. The rise in gross capital formation and drop in net trade contributions were in part related to levels of non-monetary gold (see GDP first quarterly estimate: April to June 2018). Gross capital formation was also subject to balancing adjustments, which are discussed in the quality and methodology section of the quarterly bulletin.
Back to table of contents10. Growth in compensation of employees slowed in Quarter 2 (April to June) 2018, but still contributed positively to growth
Figure 9: The income approach to GDP in current prices increased by 0.7% in Quarter 2 (Apr to June) 2018
Growth and contribution to growth, Quarter 3 (July to Sept) 2016 to Quarter 2 (Apr to June) 2018
Source: Office for National Statistics
Notes:
- Q1 refers to Quarter 1 (Jan to Mar), Q2 refers to Quarter 2 (Apr to June), Q3 refers to Quarter 3 (July to Sept), Q4 refers to Quarter 4 (Oct to Dec).
Download this chart Figure 9: The income approach to GDP in current prices increased by 0.7% in Quarter 2 (Apr to June) 2018
Image .csv .xlsGross domestic product (GDP) growth in current prices was 0.7% in Quarter 2 2018. This is also known as nominal GDP, or GDP not adjusted to take account of inflation. Compensation of employees growth slowed to 0.6%, contributing 0.3 percentage points. Taxes and subsidies was the largest contributor to growth at 0.5 percentage points.
Back to table of contents11. Things you need to know about this release
In this release, the three-monthly estimate coincides with the quarterly estimate. This allows us to provide additional information on the income and expenditure approaches to measuring gross domestic product (GDP) in Sections 9 and 10. The data content released alongside this monthly release and the quarterly release are fully consistent.
Back to table of contents12. Quality and methodology
The Gross Domestic Product (GDP) Quality and Methodology Information report contains important information on:
the strengths and limitations of the data and how it compares with related data
uses and users of the data
how the output was created
the quality of the output including the accuracy of the data