Table of contents
- Main points
- Things you need to know about this release
- UK R&D expenditure continues long-term upward trend
- Business spending on R&D performed as a proportion of the UK total continues to increase
- All sectors’ funding of UK R&D increases, except overseas
- UK defence expenditure on R&D levels off
- South East, East of England and London continue to perform most R&D
- The UK ranks 11th of all EU countries’ R&D expenditure as a percentage of GDP
- Links to related statistics
- Quality and methodology
1. Main points
Research and development (R&D) expenditure rose by £1.6 billion to £34.8 billion in 2017, an increase of 4.8%, which was above the long-term annual average increase of 4.1% since 1990.
Total R&D expenditure in the UK in 2017 represented 1.69% of gross domestic product (GDP), up from 1.67% in 2016, but remaining below the European Union (EU-28) provisional estimate of 2.07%.
The UK ranked 11th of all EU countries’ R&D expenditure as a percentage of GDP in 2017.
Funding of UK R&D from overseas continued to fall for the third consecutive year to £5.0 billion in 2017, which was 10.2% lower than the peak in 2014 of £5.6 billion.
The UK spent £527 on R&D per head of population in 2017, with England spending £554, Scotland £466, Northern Ireland £371 and Wales £238.
2. Things you need to know about this release
This release provides estimates of research and development (R&D) performed in and funded by the following four sectors of the UK economy, as defined in the Frascati Manual (2015):
business enterprise (BERD)
higher education (HERD)
government, which includes research councils (GovERD)
private non-profit organisations (PNP)
These sectors’ R&D data are known collectively as gross domestic expenditure on R&D (GERD).
GERD is the preferred measure of R&D activity for use in international comparisons.
The UK government’s Industrial Strategy includes a target to “raise investment on R&D to 2.4% of GDP [gross domestic product] by 2027”. UK R&D statistics are needed to assess how sectors of the economy are contributing towards reaching this policy goal. Progress to this target can be seen in this statistical bulletin, which shows that GERD represented 1.69% of GDP in 2017, up from 1.67% in 2016.
The business sector is the largest component of GERD; its estimates in this release are derived from the Business enterprise research and development 2017 statistical bulletin, published on 21 November 2018. The business sector accounted for 1.1% of GDP in 2017.
In this statistical bulletin, R&D and related concepts follow internationally agreed standards defined by the Organisation for Economic Cooperation and Development (OECD), as published in the Frascati Manual (2015).
This release reports on R&D expenditure in the UK irrespective of the country of residence of the ultimate owner or users of the R&D produced.
R&D is measured by the expenditure on R&D performed by an organisation, or the funding received by an organisation for R&D work. These are often but not always the same. Performance is regarded as a more accurate measure than funding received by an organisation, as not all funds received may be used on R&D as intended.
All figures quoted are in current prices unless otherwise stated. The majority of the data series are available from 1989, however, constant price comparisons have been made using the start of the next decade in 1990.
Back to table of contents3. UK R&D expenditure continues long-term upward trend
At £34.8 billion in 2017, expenditure on research and development (R&D) performed in the UK reached its highest level on record. This was up from £33.2 billion in 2016, an increase of 4.8% and above the long-term annual average growth since 1990 of 4.1%.
In constant prices (adjusted to remove the effects of inflation), the 2017 estimate surpassed 2016’s previous high by £961 million, with growth of 2.8%. With an average annual growth rate of 2.0% since the 1990 level of £20.5 billion, the long-term upward trend, in constant prices, is still evident (Figure 1).
In 2017, the UK spent £527 per head of population, an increase of 157.5% from £205 in 1990. Removing the effects of inflation this represents an increase of 47.0% from the 1990 total of £358.
Figure 1: UK gross domestic expenditure on research and development, 1990 to 2017
Source: Office for National Statistics
Download this chart Figure 1: UK gross domestic expenditure on research and development, 1990 to 2017
Image .csv .xlsFigure 2 shows UK gross domestic expenditure on R&D performed in the UK, as a percentage of GDP. This percentage declined steadily between 1990 and 1997, from 1.73% to 1.52%. Since then, the percentage has fluctuated between 1.51% and 1.69% showing a gradual upward growth. The 2017 estimate of 1.69% of GDP was up from 1.67% in 2016 and above the average of 1.60% for the period 1998 to 2017.
Figure 2: UK gross expenditure on research and development as a percentage of gross domestic product, 1990 to 2017
Source: Office for National Statistics
Download this chart Figure 2: UK gross expenditure on research and development as a percentage of gross domestic product, 1990 to 2017
Image .csv .xls4. Business spending on R&D performed as a proportion of the UK total continues to increase
UK estimates of research and development (R&D) cover the four sectors of the economy: business, higher education, government (including research councils) and private non-profit organisations. The sector grew 4.9% from £22.6 billion in 2016, however, this was lower than the 7.5% growth between 2015 and 2016.
Figure 3: Composition of UK gross domestic expenditure on research and development by performing sector, 2017
Source: Office for National Statistics
Notes:
- Percentages sum to 99 due to rounding.
Download this chart Figure 3: Composition of UK gross domestic expenditure on research and development by performing sector, 2017
Image .csv .xlsBusiness
In 2017, the business sector spent £23.7 billion on performing R&D, accounting for 68% of total UK expenditure. This grew 4.9% from £22.6 billion in 2016.
Annually, the 400 largest business R&D performers are asked to select the industry product groups that best describe the type of R&D they undertake. For smaller R&D performers, no product group data are collected; however, these businesses’ dominant Standard Industrial Classification (SIC) is used as a proxy to determine product group. The concept of "product groups" is described in more detail in the UK business enterprise research and development Quality and Methodology Information (QMI).
The product groups with the largest R&D expenditure in 2017 were:
pharmaceuticals (£4.3 billion)
vehicles and parts (£3.6 billion)
computer programming and information service activities (excluding software development) (£1.9 billion)
aerospace (£1.5 billion)
miscellaneous business activities; technical testing and analysis (£1.5 billion)
software development (£1.4 billion)
More detailed information on business R&D expenditure can be found in the Business enterprise research and development 2017 statistical bulletin published on 21 November 2018.
Higher education
The higher education sector, which includes universities and higher education institutes, was the second-largest sector, spending £8.2 billion on performing R&D. This accounted for 23% of total UK R&D expenditure in 2017. The sector had the largest overall increase in percentage terms with a growth of 5.6% from 2016.
New higher education financial reporting standards starting on or after 1 January 2015 have resulted in significant changes in how financial performance is reported. This presents difficulties in comparing results from 2015 onwards with historical trends. The funding for this sector was mainly provided by the higher education funding councils (HEFCs) for England, Scotland, Wales, the Department for Employment and Learning in Northern Ireland and the seven UK research councils.
In 2018 United Kingdom Research and Innovation (UKRI) was created to bring together the seven research councils, Innovate UK and some functions of the former higher education funding council for England (HEFCE) into one unified body. Its functions in relation to allocation of research funds in the higher education sector will be continued by Research England, the new council within UKRI.
The HEFCs are responsible for the distribution of funding for higher education to universities and further education colleges throughout the UK. HEFCs are funded by government, however, being non-departmental public bodies, they are deemed not part of any government department. For the purposes of reporting R&D funding the HEFCs (while ultimately government-funded) are classified as part of the higher education sector. They do not feature in the performance figures as they only provide funding.
In 2017, London was the dominant region for R&D in the higher education sector, spending £2.0 billion. This accounted for 35.7% of the region’s total expenditure on performing R&D. However, of total R&D in Wales and Scotland, their proportions of higher education R&D were higher than that of London at 36.2% and 42.4% respectively.
Government and research councils
The UK government owns many research institutes and laboratories that carry out R&D. These are managed by various government departments, including the Department for Business, Energy and Industrial Strategy, the Department for Environment, Food and Rural Affairs and the Department of Health and Social Care.
In 2017, there was a 1.1% growth in R&D expenditure performed in the UK by the government and research councils sector to £2.2 billion. This sector accounted for 6% of total expenditure on R&D carried out in the UK in 2017.
Research Councils UK (RCUK) was the strategic partnership of the UK's seven research councils until 2018. Each year the councils perform research covering the full spectrum of academic disciplines from the medical and biological sciences to the arts and humanities. RCUK also offered access to the UK’s research facilities and infrastructure to individuals and businesses overseas.
In 2017, research councils’ R&D expenditure grew by 3.5% from £837 million in 2016 to £866 million.
Private non-profit organisations
The private non-profit (PNP) sector is the smallest R&D performing sector in the UK. It includes registered charities and trusts mainly specialising in health and medical R&D. This sector includes, for example, a number of cancer charities that carry out extensive research, from cancer prevention to drug development and clinical trials.
In 2017, expenditure on R&D performed by these organisations was £0.8 billion, up 4.4% from 2016. This contributed 2% to total UK-performed R&D expenditure. It should be noted that from 2011 the PNP survey has been biennial and therefore non-survey years are estimated using data from survey years. The increase in the 2016 estimate has taken into account the large increase in 2015 due to the addition of several organisations, set up specifically to carry out large R&D projects.
Back to table of contents5. All sectors’ funding of UK R&D increases, except overseas
In 2017, the largest funder of research and development (R&D) performed in the UK was the business sector, which funded £18.7 billion (54%), of total UK-performed R&D. This was an increase of 6.7% from £17.5 billion in 2016.
At £6.8 billion (20%), the government sector was the second-largest source of UK R&D funding in 2017, increasing by 5.8% since 2016. In comparison, the sector itself only spent £2.2 billion performing R&D in the UK in 2017.
Figure 4 is a representation of the flows of R&D funding from the four UK sectors and overseas. The values in the boxes are the amounts of funding that each sector provided to the other sectors in the UK during 2017. The arrows indicate the values provided to the recipient performing sector.
It is important to note that sectors can fund themselves. For example, in 2017, the business sector performed £23.7 billion of R&D expenditure, of which £18.3 billion was funded by the business sector itself. The remaining £5.4 billion performed by businesses was funded by other sectors or from overseas.
Figure 4: Flows of research and development funding in the UK, 2017

Source: Office for National Statistics
Notes:
Values in the boxes are the totals of funding that each sector provided to all sectors. For full information see Table 1 from the data section of this publication.
Government departments and research councils carry out their R&D in public research institutes. Their flow of funds into these institutes (£1,220 million and £681 million respectively) need to be combined to provide total government funding of the government sector.
HEFCs – Higher Education Funding Councils.
Download this image Figure 4: Flows of research and development funding in the UK, 2017
.svg (256.2 kB) .xls (36.9 kB)
Funding of UK R&D expenditure has changed over time. In 1990, R&D funding from overseas in constant prices was £2.4 billion, 12% of total UK-performed R&D. There was a steady increase in the value of funding from overseas, peaking at £5.9 billion in 2014, representing 18% of total UK funding. However, since then funding has subsequently declined, falling 14.5% to £5.0 billion in 2017. The average annual growth rate since 1990 was 2.7%.
Figure 5 shows the breakdown of UK GERD by funding sector since 2013.
Figure 5: Composition of UK gross domestic expenditure on research and development by funding sector in constant prices, 2013 to 2017
Source: Office for National Statistics
Notes:
- HEFCs – Higher Education Funding Councils.
Download this chart Figure 5: Composition of UK gross domestic expenditure on research and development by funding sector in constant prices, 2013 to 2017
Image .csv .xls6. UK defence expenditure on R&D levels off
In 2017, expenditure for defence purposes accounted for 5% of total research and development (R&D) expenditure (£1.8 billion). This was an increase of 2.1% from 2016. In constant prices, defence R&D expenditure has fallen 60.7% from £4.6 billion in 1990.
Business expenditure on performing R&D in the defence sector has fallen by 47.6% since 1990 in constant prices, reaching £1.6 billion in 2017, accounting for 89% of the UK defence total. In contrast, over the same period the business sectors’ expenditure on civil R&D grew by 99.9% to £22.1 billion (67% of the UK civil total). The business sector remains by far the largest performer of both civil and defence R&D.
The UK government’s funding of defence R&D rose by £34 million in 2017 to £1,168 million, an increase of 3%. As a proportion of total UK defence funding, government sector funding was broadly unchanged at 65% in 2017. The business sector provided £0.5 billion (27%) of funding, unchanged since 2016. In 2017, funding from overseas remained unchanged at £0.1 billion (8%).
Back to table of contents7. South East, East of England and London continue to perform most R&D
Research and development (R&D) expenditure can be analysed by UK country and region (Figure 6). In this context, the country and region refers to the location where the R&D is performed.
The majority of UK R&D expenditure was carried out in England, at £30.8 billion (89%) in 2017. Scotland accounted for £2.5 billion (7%), with Wales and Northern Ireland spending £744 million (2%) and £695 million (2%) respectively on performing R&D.
While the UK spent £527 on R&D per head of population in 2017, there were large differences between the nations. England spent £554 per head and Scotland £466. Northern Ireland spent £371 and expenditure in Wales at £238 was approximately half that of Scotland.
In 2017, the South East, East of England and London regions dominated R&D activity in the UK. These regions together accounted for 52% of total UK R&D expenditure (£18.2 billion). Of these regions, the South East and East of England were more dominant than London in the business sector, yet in contrast London was the region with most R&D in the higher education sector.
Since 2016, the business sector has been dominant throughout each region of the UK. Prior to this, the higher education sector had the highest expenditure on performing R&D in both London and Scotland. The business sectors’ expenditure on performing R&D in London has increased by over £0.4 billion for two consecutive years.
Since 2001, the largest annual average increase in the business sector was in London at 9.0%, while the North West had the lowest growth at 2.0%.
Figure 6: UK gross domestic expenditure on research and development by sector, country and region, 2017
Source: Office for National Statistics
Notes:
- North East and North West regions data have been combined due to confidentiality.
Download this chart Figure 6: UK gross domestic expenditure on research and development by sector, country and region, 2017
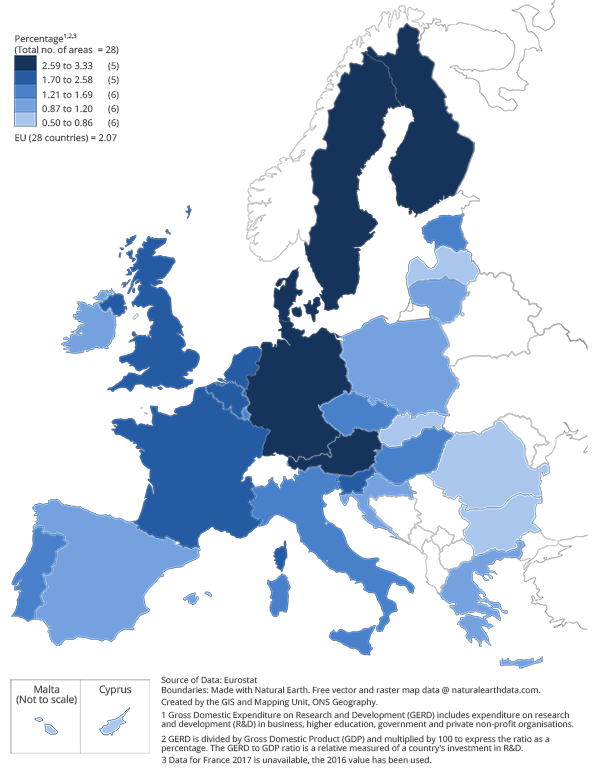
Image .csv .xls8. The UK ranks 11th of all EU countries’ R&D expenditure as a percentage of GDP
Europe 2020 targets specify five targets for the European Union (EU) to achieve by 2020, including a target of 3% of the EU’s gross domestic product (GDP) to be invested in research and development (R&D).
The latest Preliminary estimates produced by Eurostat indicate that for the EU as a whole the percentage of GDP spent on R&D fluctuated between 1.74% in 2005 and 2.07% in 2017 (Figure 7). Please note that the 2017 results for the EU-28 and Organisation for Economic Co-operation and Development (OECD) countries are early estimates and are provisional at the time of this release.
Figure 7: Gross domestic expenditure on research and development to gross domestic product ratio as a percentage (R&D intensity) by country, European Union (EU-28), 2017
Source: Eurostat
Download this image Figure 7: Gross domestic expenditure on research and development to gross domestic product ratio as a percentage (R&D intensity) by country, European Union (EU-28), 2017
.png (172.9 kB)
Figure 8 shows the UK’s R&D as a proportion of GDP compared with other EU countries.
It includes the average for the EU-28, compared with the Europe 2020 target of 3%. The UK’s gross domestic expenditure on R&D (GERD) represented 1.69% of GDP in 2017, up from 1.67% in 2016. The UK had the 11th-highest GERD as a percentage of GDP of all EU-28 countries, where the average was 2.07% of GDP.
Figure 8: EU countries' gross domestic expenditure on research and development as a percentage of gross domestic product (R&D intensity), 2017
Source: Eurostat
Notes:
Some EU countries' 2017 estimates taken from the Eurostat website are provisional.
* = data for 2016
Download this chart Figure 8: EU countries' gross domestic expenditure on research and development as a percentage of gross domestic product (R&D intensity), 2017
Image .csv .xlsWhen comparing total R&D intensity across countries, it is important to take into account differences in individual countries’ economic structures. The OECD has produced a Science, Technology and Industry Scoreboard to facilitate these comparisons.
Back to table of contents10. Quality and methodology
The UK gross domestic expenditure on research and development Quality and Methodology Information report contains important information on:
the strengths and limitations of the data and how they compare with related data
uses and users of the data
how the output was created
quality of the output including the accuracy of the data
About the data
These points should be noted when examining this bulletin or the data tables:
there may be differences between totals and the sum of their independently rounded components
in some tables, entries have either been aggregated or suppressed to avoid disclosure of figures in which the returns of individual organisations could be identified – where this happens, footnotes have been added to the tables
note that £1.0 billion equals £1,000 million in this release
estimates from 2013 to 2016 have been revised where necessary to take account of improved methodology, organisations’ misreporting and late returns
following further quality assurance of the flow of funding within the higher education sector it was decided to remove the element relating to funding between higher education establishments; the earliest point of revision is 1992
GDP deflators at market prices, and money GDP used is non-seasonally adjusted; the GDP deflators at market prices, and money GDP: September 2018 (Quarterly national accounts) can be viewed as a measure of general inflation in the domestic economy