1. Introduction
This article provides a high-level overview of the methodology used to produce the 2016-based household projections for England. A detailed methodology document was published on 20 September 2018, which can be referred to for full details of the process and data used.
Household projections show the potential number of households1 there would be in England in the future if a set of assumptions about the size and structure of the population, and that population’s patterns of household formation, were realised in practice. These assumptions are based on past demographic trends in the population and rates of household formation.
Household projections are not forecasts and do not take into account policy or development aims that have not yet had an impact on observed trends. It should also be noted that future demographic behaviour is inherently uncertain, meaning that any set of projections will almost inevitably be proved wrong, to some extent, when treated as a forecast or prediction of future numbers of households2. Household projections should be thought of as a trend-based starting point for analysis, providing data produced on a consistent basis for England and its regions and local authorities.
As with previous household projections, the methodology is split into two stages. Stage 1, published on 20 September 2018, provides a summary of the projected number of households based on trends in population change and household formation. Stage 2, published on 3 December 2018, gives a more detailed breakdown of household type. This article summarises both stages of the methodology.
In the future, we intend to publish both stages of the household projections on the same day. This was not possible for the 2016-based household projections, owing to the methodological changes applied following the transfer of the household projections from the Ministry of Housing, Communities and Local Government (MHCLG) to the Office for National Statistics (ONS). Previous sets of household projections can be found on the MHCLG website.
Transfer to the ONS
The Office for National Statistics (ONS) took responsibility for the household projections in January 2017. The aim of the transfer was to improve the consistency between the household projections and the subnational population projections (SNPPs) and allow us to make some efficiencies in their production. At the same time, we launched a consultation on proposed changes to the household projections methodology. We published a response to the consultation in June 2017, setting up a programme of research to look at how the methodology could be improved in light of the feedback we received. This was followed by an article in June 2018, providing an update on our research and the proposed methodology for the 2016-based household projections for England.
Variant subnational household projections
Variant subnational household projections were published on 16 May 2019. This was in response to the Office for Statistics Regulation’s (OSR’s) recommendation, in their Compliance Check of Household Projections for England, that the Office for National Statistics (ONS) prioritise the publication of additional variant projections in a way that is most helpful to users. There are four variants; three variants show alternative assumptions of migration and one is a continuous projection of the household representative rates (HRRs) through to 2041, which were held constant from 2022 onwards in the principal projection.
Future releases
Household projections are normally published every two years, following the publication of the subnational population projections (SNPPs). In the future, we aim to publish the household projections at a similar time to the SNPPs, to provide a more consistent and timely release. The 2018-based SNPPs are provisionally expected to be released March to April 2020.
Notes about the introduction
The household projections are based on the 2011 Census definition of a household: “one person living alone, or a group of people (not necessarily related) living at the same address who share cooking facilities and share a living room or sitting room or dining area.” This includes sheltered accommodation units in an establishment where 50% or more have their own kitchens (irrespective of whether there are other communal facilities) and all people living in caravans on any type of site that is their usual residence. This will include anyone who has no other usual residence elsewhere in the UK. A household must contain at least one person whose place of usual residence is at the address. A group of short-term residents living together is not classified as a household, and neither is a group of people at an address where only visitors are staying.
This inherent uncertainty also applies to population projections that feed into the household projections, as discussed in Fifty years of United Kingdom national population projections: how accurate have they been?. A more recent discussion of the accuracy of national population projections is available in the National Population Projections Accuracy Report. For a discussion of the accuracy of subnational population projections, please refer to the Subnational Population Projections Accuracy Report.
2. Overview of 2016-based methodology
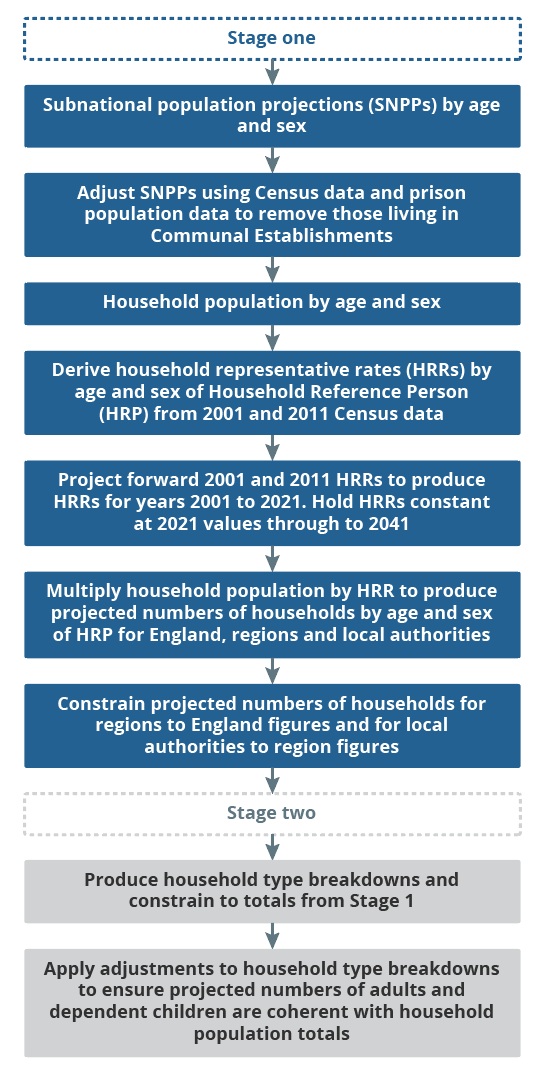
The 2016-based household projections are compiled using a two-stage process. Stage 1 produces projected total numbers of households by quinary age group and sex of the household reference person (HRP)1 over the projection period (2016 to 2041) for England and its regions and local authorities. The total number of households in each geographical area forms the basis of the control totals for Stage 2 of the projection methodology, which gives the detailed household-type breakdown. Figure 1 illustrates the 2016-based household projections process.
Figure 1: 2016-based household projection methodology
Source: Office for National Statistics
Download this image Figure 1: 2016-based household projection methodology
.png (103.0 kB)
Stage 1
Stage 1 begins by taking the latest sets of mid-year population estimates (MYEs) and subnational population projections (SNPPs), by quinary age group and sex, and applying an adjustment to remove those living in communal establishments (CEs) using census data. These are also supplemented by administrative data about the prison population using published data from the Offender management statistics quarterly. This part of the method produces a projected household population by quinary age group and sex for the years 2001 to 2041.
The household representative rates (HRRs) are multiplied by the projected household population, to produce projected numbers of households. The HRR is the proportion of people in a particular demographic group (based on geography, age group and sex) who were the household reference person (HRP). The value of the HRR will be between zero and one. HRRs for 2001 and 2011 are calculated using census data. These HRRs are then projected forward to produce HRRs for the other years of the projection period. The HRRs are then applied to the projected household population to produce a projected number of households for 2001 to 2021.
From 2022 to 2041, HRRs are held constant at 2021 rates. This limits the use of the 10-year projected trend to a maximum of 10 years into the future, to mitigate the risks of projecting forward a potentially more uncertain trend for the entire projection period. Household projections are produced separately for England and its regions and local authorities. Projected numbers of households for the regions are then constrained to the England total, with figures for local authorities constrained to the relevant regional totals.
Stage 2
Stage 2 begins by calculating household headship rates. Headship rates show the proportion of people in a particular demographic group (based on geography, age group, sex and household type) who were the household reference person (HRP). The only difference between household representative rates (HRRs) and headship rates is that HRRs are calculated by age, sex and geography, and headship rates are calculated by age, sex, household type and geography.
Headship rates are calculated for 2001 and 2011 using census data. These headship rates are then projected forward to produce headship rates for the other years of the projection period. They are then applied to the projected household population to produce an initial projected number of households for 2001 to 2021, with headship rates held constant for 2022 to 2041. The initial projected number of households produced using the headship rates are then constrained to the overall totals by age and sex from Stage 1.
Finally, checks are carried out to ensure that the minimum number of adults and children implied by the projected household-type breakdown does not exceed the number of adults and children in the projected household population for each geography and year. Where this is not the case, adjustments are made to the number of households allocated to each household type within that geographical area and year. This ensures the implied numbers of adults and children are coherent with the projected household population. This process does not affect the overall number of households projected for a given geography and age group, only the household-type breakdown within that total.
Notes about the overview of 2016-based methodology
- In the 2016-based household projections, the household reference person (HRP) is the eldest economically active person in the household.
3. Changes to the household projections methodology
The methodology for the 2016-based household projections takes the 2014-based method1 as its starting point. Table 1 provides a summary of the changes that have been made to the household projections methodology for the 2016-based household projections, compared with the 2014-based household projections.
| Element of method | 2014-based household projections | 2016-based household projections | Rationale for methodological changes |
|---|---|---|---|
| Calculating base household representative rates (HRRs)¹ | Used data from the 1971, 1981, 1991, 2001 and 2011 Censuses, supplemented by Labour Force Survey (LFS) data. | Uses data from the 2001 and 2011 Censuses only. HRRs broken down by age and sex are smoothed across age groups. | Census years prior to 2001 define the household reference person (HRP)² used in the calculation of HRRs based on the oldest male, whereas the 2001 and the 2011 definition is based primarily on economic activity, which makes these historical data less comparable. Using only 2001 and 2011 Census data requires fewer complex adjustments to the methodology to account for the different definitions. |
| Projecting HRRs | HRRs were projected forward using a combination of two fitted trends, combined using assumptions based on LFS data. | HRRs are projected forward using a two-point exponential model. | A combination of two trends were needed in the 2014-based projection to smooth out irregularities with historical census points (prior to 2001). As the 2016-based projection used the 2001 and 2011 Censuses, a two-point exponential trend was considered appropriate. The exponential model was already used in Stage 2 of the 2014-based methodology and in the production of household projections for Wales, Scotland and Northern Ireland. |
| Number of years HRRs are projected for | Projected for the entirety of the projection period. | Projected 2001 to 2021, then held constant for the remainder of the projection period. | Given we are using a shorter trend for projecting HRRs due to the changing HRP definition, limiting the use of this projected trend to a maximum of 10 years forward mitigates the risks of projecting forward a potentially more uncertain trend for the entire projection period. Therefore, the 2016-based household projections method assumes that these trends continue for a maximum of another 10 years (that is, from 2011 to 2021). |
| Marital status projections | Included in model and breakdowns of numbers of households. | Excluded from model and breakdowns of numbers of households. | Marital status projections were excluded from the 2016-based household projections because the most recent marital status projections are 2008-based. These are unlikely to reflect more recent trends in marital and relationship status. There are currently no plans to recommence production of official marital status projections. |
| Age groups used in projection | Stage 1 used quinary age bands from ages 15 to 19 years through to 85 years and over. Stage 2 used the following age bands: 15 to 24 years, 25 to 34 years, 35 to 44 years, 45 to 54 years, 55 to 59 years, 60 to 64 years, 65 to 74 years, 75 to 84 years and 85 years and over. | Both Stage 1 and Stage 2 uses a 16 to 19 years age band instead of 15 to 19 years, after which quinary age bands are used for 20 to 24 years through to 90 years and over. | The age groups were changed in response to consultation feedback that the age groups used in 2014-based method were not appropriate for young adults, students and the elderly population. Those consulted felt there was greater variation in how households were formed for these age groups. The change to the older age groups also provides consistency with the age breakdowns used in the mid-year estimates and SNPPs, which include breakdowns for those aged 85 to 89 years and those aged 90 years and over. |
| Data sources used | LFS data used to determine the weights to combine the HRRs using two fitted trends. | The Annual Population Survey (APS) is used in the checks to ensure that the minimum number of adults and children implied by the projected household type breakdown for each geography and year does not exceed the number of adults and children in the projected household population. | The APS was used instead of the LFS in the 2016-based household projections to provide data used in the minimum adults and children checks. This is because it has a larger sample size and therefore is considered more reliable when broken down to smaller population subgroups. The LFS was not needed to combine the two trends of HRRs in the 2016-based method as they were projected using a two-point exponential model. |
| One-off adjustments have been made to the prison population for certain groups using data from the mid-year population estimates components of change, to better reflect the growth of the prison population. For example, for young males in the years 2002 to 2008 for the 2008-based household projections. | Used administrative data about the prison population from the Ministry of Justice (MoJ) to update the number of prisoners in the population for the years 2012 to 2016. | As a high proportion of change in the prison population is due to legislative change concerning custody, sentence lengths, and prison openings and closures, rather than demographic patterns, it was considered impractical to build this into the model for projecting the prison population. Therefore, it was considered better to use administrative data from the MoJ to adjust the prison population. |
Download this table Table 1: Methodological changes – 2014-based compared to 2016-based household projections
.xls .csvWork to further improve the household projections methodology is ongoing, based on user need.
Notes about changes to the household projection methodology
- The methodology for the 2014-based household projections was based on the 2012-based, 2011-based interim and 2008-based household projections.
4. Methods used for household projections for other parts of the UK
The methods described in this article relate to household projections for England only. Household projections are produced separately for England, Wales, Scotland and Northern Ireland. A user guide to the household projections across the UK published on 27 August 2019, which compares the methods and data sources used across the four countries.
Data table 401 brings together household projections published separately for England, Wales, Scotland and Northern Ireland (last updated 10 January 2019). The latest data and information on data sources and methods for household projections for Wales, Scotland and Northern Ireland are available.
Back to table of contents