Table of contents
- Introduction
- What will be published in September 2018?
- Household types and variants
- Feedback
- Research programme
- Household Projections Collaborative Group
- Overview of methodology
- 2016-based subnational population projections
- Household population
- Household representative rates
- Numbers of households
- Annex 1: Household Projections Collaborative Group members
1. Introduction
In January 2017, we announced that responsibility for the production and publication of Household Projections for England was transferring from the Ministry of Housing, Communities and Local Government to the Office for National Statistics (ONS). The aim of the transfer was to further improve the consistency between the household projections and the national and subnational population projections and allow us to make some efficiencies in their production. At the same time, we launched a consultation on proposed changes to the household projections methodology, which received 42 responses. In our response to this consultation, published in June 2017, we said we intended to:
- move to using the standard 2011 Census definition for Household Reference Person as soon as possible
- set up a programme of research to look at how the methodology can be improved in the light of the feedback from this consultation
- establish a Household Projections Collaborative Group, including experts from within and outside ONS, to advise and work with us on this research and the longer-term development of the household projections
- use the current methods as a starting point for the next release of the projections in summer 2018; the programme of research, and the Collaborative Group, will help us to identify improvements to the methods that we could make in time for that release
- retain the current level of detail in published outputs and seek further evidence of requirements for variant projections
The purpose of this paper is to provide an update on our research programme and the proposed methodology for the 2016-based household projections for England, which are provisionally due to be published in September 2018. It should be noted that the proposed methodology is still subject to final methodology quality assurance processes, as is standard practice for methodological changes to ONS outputs.
Back to table of contents2. What will be published in September 2018?
In September 2018, we intend to publish projected numbers of households by age and sex of the Household Reference Person; similar to what was published as Stage 1 of the existing methodology. We still intend to produce and publish breakdowns of overall projected numbers of households by household type; however, these breakdowns will be published later, in autumn 2018. This allows us more time to quality assure our processes and outputs for Stage 2 of the methodology. It also provides us with more time to explore what household type breakdowns would be most useful for users.
Back to table of contents3. Household types and variants
Responses to the 2017 consultation suggested that the current eight-type breakdown, used in the 2014-based household projections for England, did not meet some important user needs, such as providing information about lone parent households. Therefore, we would like to review these household types before deciding what types to publish. We appreciate that household projections are used to address a variety of policy and research questions, for which different household types may be more appropriate. Although we are unlikely to be able to produce a breakdown or classification that meets all these needs, we will nevertheless seek to improve on the current breakdowns.
We would also like to invite your views on whether you would find variant household projections useful and, if so, what types of variants you would be interested in. This links with our research on publishing variant subnational population projections, so we would also welcome your views on those. Variant projections will form part of our long-term research plans for household projections.
Back to table of contents4. Feedback
We welcome your feedback on our chosen method to help inform our future research programme. We are especially interested in:
- feedback on any issues with the changes that are being applied
- feedback on what household types would be most useful
- views on potential for variant household projections and what variants would be most useful
- comments on any activities that you would find helpful at the time of the household projections release
Please email pop.info@ons.gov.uk by 18 July 2018, indicating in the title of your email that you are responding to the household projections user engagement and who you are representing. Although the Office for National Statistics does not intend to publish any individual responses, we may if required publish responses to this article under a Freedom of Information request. We will also draw on the responses provided to the 2017 consultation for information about user preferences for household types and variants. Therefore, if you provided comments about these subjects as part of your response to the 2017 consultation, and your views have not changed, please do not feel obliged to send your comments again.
While all feedback will be considered it is only in exceptional cases where special adjustments to the Stage 1 methods may be implemented; these will be judged on a case by case basis. Any resulting changes will be detailed in the methodology article accompanying the release.
Back to table of contents5. Research programme
Following the consultation response in June 2017, we set up a programme of research to look at how the methodology could be developed in the light of the consultation feedback.
This programme of research involved building a new in-house processing system through which alternative methods and assumptions could be tested. Using current methods as a starting point, we carried out research to explore whether certain assumptions still held and analysed the outcomes of several alternative approaches. This analysis included comparing results to past sets of household projections.
Back to table of contents6. Household Projections Collaborative Group
We also established a Household Projections Collaborative Group, including experts from within and outside the Office for National Statistics (ONS), to advise us on this research. A list of Collaborative Group members is provided in Annex 1. ONS would like to thank members of the Collaborative Group for their advice and expertise. It should be noted that while Collaborative Group members advised us on our research, decisions about the methodology are the responsibility of ONS.
Back to table of contents7. Overview of methodology
The rest of this article provides more information about the methodology for the 2016-based Household Projections for England. This section provides an overview of the methodology, with Sections 8 to 11 providing more detail about each part.
The new method takes the existing methodology as its starting point, with changes being made to reflect changes in data availability over time and changing assumptions about household formation and population change. Like the existing methodology, it is a household representative rate (HRR) approach, carried out in two stages. The HRR is the probability of anyone in a particular demographic group being classified as a Household Representative Person. Stage 1 takes the latest set of subnational population projections (SNPPs) and applies an adjustment to remove those living in communal establishments (CEs). This adjustment uses the same assumptions as the existing methodology, supplemented by administrative data about the prison population.
HRRs are then calculated using 2001 and 2011 Census data for each local authority (LA) and demographic group and applied to the adjusted SNPPs to produce a projected number of households in each LA in England for 2001 to 2021. From 2022 to 2041, HRRs are held constant at 2021 rates.
Marital status breakdowns have been removed from the methodology, as marital status projections are no longer published by the Office for National Statistics and the most recent set available are 2008-based.
Stage 2 methods are still being developed, but will also use data from the 2001 and 2011 Censuses, or from the 2011 Census only, depending on the availability of consistent household types from census data. Projected household type breakdowns from Stage 2 will be constrained to overall totals from Stage 1 to provide consistent figures. Adjustments will also be applied to projected household type breakdowns from Stage 2 to ensure that the total number of adults and dependent children implied by the projected household type breakdowns for each LA and year are not greater than the total number of adults and dependent children in the household population of that LA and year.
Figure 1 illustrates the household projections process according to the new methodology.
Figure 1: Household projections process
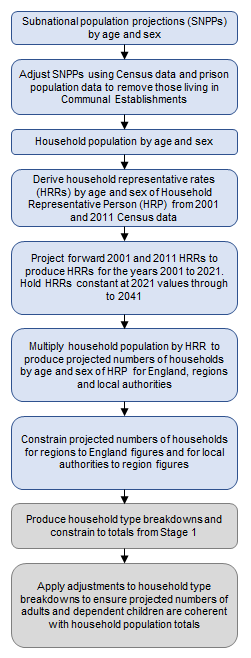
Source: Office for National Statistics
Notes:
- Stage 1 of the process is shown in blue boxes and Stage 2 of the process is shown in grey boxes.
Download this image Figure 1: Household projections process
.png (24.0 kB)
8. 2016-based subnational population projections
Like the existing method, Stage 1 starts by using the latest mid-year population estimates (MYEs) and subnational population projections (SNPPs) to provide data about the past and projected population of England and its local authorities. The 2014-based household projections used MYEs data for years up to and including 2013 and SNPPs for the years 2014 to 2039. MYEs for the years mid-2012 to mid-2016 have been revised since the publication of the 2014-based Household Projections. Therefore, as well as the SNPPs now being based on mid-2016 population estimates (as opposed to mid-2014), the SNPPs have used this revised back series of MYEs in their projections of the population. Changes to the SNPPs methodology have also been implemented since the 2014-based SNPPs were published. Further information is available about the revisions to the MYEs and changes to the 2016-based SNPPs methodology.
Back to table of contents9. Household population
The next step in the methodology is to adjust the subnational population projections (SNPPs) so that they only include usual residents living in private households. This adjustment is made by subtracting the population living in communal establishments (CEs) from the SNPPs. As in the existing method, an assumption is made that the size and distribution of the CE population in future years will be the same as it was in the 2011 Census results; using the same number as in the 2011 Census for 0 to 74-year-olds and the same rate as in the 2011 Census for those aged 75 years and over. As in the existing method, this distinction is made on the assumption that using the same absolute numbers in future years would not sufficiently account for the ageing population of England.
This assumption is the same in the new and existing methods, but is applied differently. In the existing method, the population is grouped by age, sex and marital status for the calculations, but in the new method it is grouped by age and sex only. This is because marital status projections are no longer produced and the most recent are the 2008-based set, so the SNPPs can no longer be adjusted for marital status with acceptable accuracy. The change should have limited impact on those aged 0 to 74 years, because the absolute numbers when grouped would be the same. However, removing the marital status breakdown for those aged 75 years and over would change the numerators and denominators used to apply the rates, which would have a small impact on the figures for these ages.
As part of our research, we also explored whether there were other readily available data sources that could be used to supplement Census information about the CE population. In the past, one-off adjustments have been made to the prison population excluded from the Household Projections for certain groups using mid-year estimates (MYEs) components of change, to better reflect the growth of the prison population (for example, for young males in the years 2002 to 2008 for the 2008-based projections1). As a high proportion of change in the prison population is due to legislative change concerning custody, sentence lengths and prison openings and closures, rather than demographic patterns, it was considered impractical to build this into the model for projecting the prison population. However, we have been able to use data about the prison population from the Ministry of Justice to update the number of prisoners in the population for each year up until 2016. We have used prison population data by sex for individual prisons, grouped by local authority, adjusted for sentence length2 and distributed by age according to the national level age distribution of prisoners by sex, to adjust the CE population of 0 to 74-year-olds for 2011 to 2016 (the base year of the projections). The difference between the 2011 prison population and the prison population of the year in question is added to the CE totals from the 2011 Census and this total amount removed from the SNPPs. The size of the prison population for years after 2016 is assumed to be the same as in mid-2016.
While this adjustment has a very small impact at the England level, it provides a more realistic picture of the CE population for local authorities where prisons have opened or closed between the 2011 Census and the base year of the household projections in 2016.
In the future, we will be seeking to make greater use of administrative data in updating our assumptions about the size of the CE population between the latest Census year and the base year of the projections.
Notes for: Household population
See pages 28 to 32, DCLG (2010) Updating DCLG's household projections to a 2008 base: methodology.
Only prisoners serving sentences of six months or more are enumerated in the Census and MYEs at the prison; those serving sentences of less than six months are enumerated at their household.
10. Household representative rates
The next stage of the method is to apply household representative rates (HRRs) to the household population figures, to produce a projected number of households. Responses to the 2017 consultation presented a variety of views about the best method for projecting HRRs, in terms of:
- the demographic groups for which HRRs should be projected
- whether HRRs should be projected in one or two stages
- how many years of Census data should be used in the projection
- whether any other data sources should be incorporated
Section 10 outlines each of these issues in turn and the rationale underpinning the approach we have taken for each.
Demographic groups for projecting household representative rates
Stage 1 of the existing methodology calculates HRRs by age1, sex and marital status2 for each geography, while in Stage 2 household headship rates are calculated by age and household type for each geography, with projected households being constrained back to Stage 1 totals. In the 2017 consultation, we proposed projecting HRRs by age and household type for each geography.
Regarding age, nine respondents to the consultation said that the quinary age groups used in the existing method were not appropriate for young adults, students and the elderly population, where they felt there was greater variation in how households were formed. Suggestions included changing the 15 to 19 years group to 16 to 19 years and expanding the 85 years and over group to include 85 to 89 years and 90 years and over. We have taken on board these views and will calculate HRRs for 16 to 19-year-olds, quinary age groups from 20 to 24 years through to 85 to 89 years and for those aged 90 years and over. The change to the older age groups also provides consistency with the age breakdowns used in the mid-year estimates and subnational population projections, which include breakdowns for 85 to 89-year-olds and those aged 90 years and over.
With regards to the inclusion of marital status, 9 of 42 respondents to the 2017 consultation supported the proposal to remove marital status from the projected HRRs, either because they felt it to be a poor indicator of household formation or because of the unreliability of the marital status projections which have not been updated since the 2008-based set was published in 2010. Two respondents felt that marital status was a good indicator of household formation and wanted to see it retained in the model. There was not a consensus among the Household Projections Collaborative Group about the extent to which marital (or relationship) status was still a useful indicator of household formation, or as to whether the 2008-based marital status projections should still be used.
As we have no current plans to publish updated marital status projections, we are not recommending their inclusion in the demographic breakdown for projecting HRRs in the 2016-based household projections.
With regards to the inclusion of sex, 12 of 42 respondents to the consultation were unhappy with the proposal to remove sex from the projected HRRs. Most Household Projections Collaborative Group members were also supportive of retaining a sex breakdown of HRRs as well as an age breakdown, for consistency with the previous method and to capture differences in household formation between males and females. We tested approaches to projecting HRRs for the household population broken down by age and geography and by age, sex and geography. Our results showed that the inclusion of sex in the demographic breakdowns did have an impact on the overall number of households projected, compared with just using age. These results, in combination with user feedback, have led us to include sex in the demographic breakdown of HRRs.
One- or two-stage approach to projecting HRRs
The existing household projections methodology produces overall numbers of households by characteristics of the Household Representative Person (HRP) in Stage 1 and household type breakdowns in Stage 2. Our 2017 consultation proposed using a one-stage approach in which household type breakdowns were produced as part of the projection of the overall numbers of households.
Our initial research into using a one-stage approach projecting HRRs using 2001 and 2011 Census data produced overall projected numbers of households higher than those produced by the Ministry of Housing, Communities and Local Government (MHCLG). This was in some ways unexpected, because average household sizes remained largely unchanged between the 2001 and 2011 Censuses, having steadily decreased since the 1971 Census. Therefore, it was expected by some users that using only 2001 and 2011 Census data would reduce the projected number of households as opposed to increasing it. This increase in projected households reduced our confidence in the one-stage approach and led us to test a two-stage approach that did not include household type. The results from this testing were more consistent with what users were expecting to occur if only using 2001 and 2011 Census data to project forward through to 2039 and confirm that the inclusion of household type in the projection of the total number of households was changing the overall totals.
More widely, several members of the Household Projections Collaborative Group argued that a one-stage approach makes it more difficult for users to incorporate their own bespoke household type breakdowns into the projections, because the overall projected numbers of households will have been influenced by another set of household types. There is not a consensus about the household types that should be used for household projections (with different types suiting different purposes and user needs), so using a two-stage approach allows flexibility to amend household types in future.
Therefore, we will maintain the two-stage approach used by MHCLG in the existing methodology, projecting households by age and sex of HRP in Stage 1, with a household type breakdown produced in Stage 2.
Number of Census points to include in the projection period
Stage 1 of the existing methodology calculates HRRs using data from five Censuses (1971 to 2011) and projects these HRRs forward using a combination of two fitted trends, combined using assumptions based on Labour Force Survey (LFS) data. The HRR is the probability of anyone in a particular demographic group being classified as a HRP. The definition of HRP used in the 2011 Census was different to that used in previous Censuses3; therefore, the existing method involves making complex adjustments to 2011 Census data to accommodate the two definitions. In the consultation of January to March 2017, users were asked for their views on using only the 2001 and 2011 censuses to project HRRs4.
A total of 15 respondents considered using data from only two censuses to be insufficient, citing that a longer trend was needed to smooth out events such as the recession, the expansion of the EU and any inaccuracies that may have occurred in the 2001 and 2011 censuses. There was a view that only using the 2001 and 2011 censuses would result in a downward trend in household formation for the younger age groups, which in turn would downplay the need for housing for younger people. This view is based on observations of past trends in HRRs for younger people, which generally increased between 1971 and 19915, then either remained level or decreased between 1991 and 20116.
Other suggestions included using data from 1991, 2001 and 2011 supplemented by survey data (seven respondents) and giving greater weight to LFS data (four respondents). Several other respondents asked for further work to understand the impact of any new methods. Five respondents felt that a simplification of the methodology would make it easier to explain to others.
Similar views were expressed by some Household Projections Collaborative Group members, who supported investigating a projection using 1991, 2001 and 2011 Census data, though others raised concerns that the differences in HRP definitions would affect data quality in this approach.
There are two main reasons why the new methodology does not use data from the 1991 Census. Firstly, MHCLG expressed concerns about the 1991 Census data used in the existing projections, saying “there remain issues that some of the Census points (particularly the 1991 Census) look to be quite strange.”7 Using HRRs previously used by MHCLG as part of the new methodology would not address these issues.
Secondly, in our response to the consultation, we said we would move to using the standard 2011 Census definition for HRP as soon as possible. To include 1991 Census data based on the 2011 Census definition of HRP would require making complex adjustments of a similar nature to the adjustments made to 2011 Census data in the existing methodology. Our investigations have found that existing tables from the 1991 Census are not available in the required age-sex breakdowns to produce HRRs and we have confirmed that it is no longer possible to commission bespoke tables from the 1991 Census. We therefore have limited information on which to base such adjustments. As a result of these considerations, we are not including 1991 Census data in the production of 2016-based Household Projections for England.
The new method uses only 2001 and 2011 Census data, which enables the current Census definition of HRP to be used consistently throughout the methodology. The new methodology proposes projecting HRRs between 2001 and 2011 forward to 2021 using the modified two-point exponential model shown in Box 18.
Box 1: Modified two-point exponential model for projecting household representative rates

Source: Office for National Statistics
Notes:
- This model is also used by National Records of Scotland in their Household Projections for Scotland – see page 42.
Download this image Box 1: Modified two-point exponential model for projecting household representative rates
.png (10.1 kB)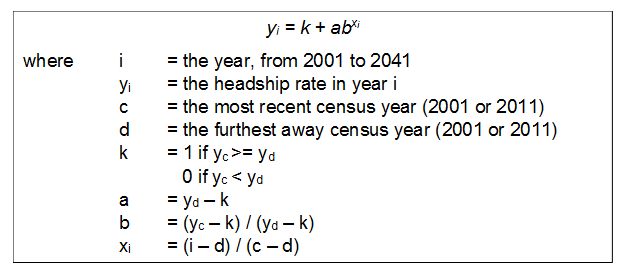
From 2021 onwards, the HRRs by age, sex and geography are held constant at their 2021 values through the projection period to 2041. The following part of this section explains the rationale for this approach.
There is general acknowledgement that between 1971 and 2001, average household size declined and household formation increased8. Between 2001 and 2011, these trends slowed down; average household size remained broadly the same and household formation did not increase as much (or even declined for some age groups). Figure 2 shows that the 2008-based Household Projections (produced prior to the 2011 Census) projected that average household size would continue to decline during the 2000s, whereas the 2014-based Household Projections (produced following the 2011 Census) projected stable average household sizes throughout the 2000s. UK average household sizes as observed in the LFS matched the 2014-based Household Projections until 2011, since which average household sizes have been increasing.
Figure 2: Average household sizes, UK and England
1971 to 2017
Source: Families and Households, 2017 – ONS, 2014-based household projections in England, 2014 to 2039 – MHCLG and 2008-based household projections in England, 2008 to 2033 – MHCLG.
Download this chart Figure 2: Average household sizes, UK and England
Image .csv .xlsIt is unclear whether the trends seen between 2001 and 2011 were a temporary break in the long-term trend (this being an unusual decade due to EU expansion), or the start of a longer-term trend. Figure 3 shows that at the UK level, HRRs have declined slightly since 2011, having been broadly level between 2001 and 2011. This evidence of observed trends to 2017 adds validity to the approach of projecting HRRs forward ten years from 2011 to 2021.
Figure 3: Household representative rates, total household population, UK
2001 to 2017
Source: Families and Households, 2017, Office for National Statistics
Download this chart Figure 3: Household representative rates, total household population, UK
Image .csv .xlsWe also know that the 2001 to 2011 trends represent actual changes occurring over a ten-year period. Given we are using a shorter trend for projecting HRRs due to the changing HRP definition, limiting the use of this projected trend to a maximum of ten years forward mitigates the risks of projecting forward a potentially more uncertain trend for the entire projection period. Therefore, the method assumes that these trends continue for a maximum of another ten years (that is from 2011 to 2021). As trends become less certain after 2021 and beyond the ten-year point, the method then holds the rates constant at the level they are at in 2021 for the rest of the projection period. This is similar to the approach used in National Population Projections (NPPs) for net migration assumptions; they vary based on past data for the initial part of the projection period, but are then held constant at 165,000 to the UK every year from 2022 to 2023 onwards in the principal UK NPPs9. This approach avoids projecting forward changes seen in a short trend (which may not be reflective of longer term trends in household formation) for the entire projection period, while also avoiding using HRRs based on older Censuses, which are unlikely to reflect more recent trends in household formation.
Other data sources
The existing method for producing household projections incorporates LFS data in the projection of HRRs in terms of adjusting the 2011 Census data point to reflect the “oldest male” HRP definition, combining the two fitted trends used to project forward the five Census points of data and to make further adjustments at the England level for 2002 to 2011 data. There were suggestions, both from consultation respondents and Collaborative Group members, that ONS should incorporate LFS, English Housing Survey (EHS) or other data sources into the method, as this may help mediate changes between the methods and between 2011 and the base year of the projections.
We have decided not to incorporate any further data sources into the projection of the HRRs, to reduce the complexity of the method, but also because the accuracy of HRRs derived from survey sources for regions and local authorities is lower than that of those derived from Census data, due to smaller sample sizes in social surveys.
As we are no longer using the old definition of HRP, we no longer need to use the LFS to adjust the 2011 Census data. As we are using only two Census points and a different model, we no longer need to use the LFS to combine the two fitted trends used in the previous model. The assumption about projecting HRRs for 2011 to 2021 has been informed by analysis of HRRs from LFS data, although the LFS, EHS and other administrative data have not been incorporated into the model itself.
In the future, we intend to carry out further research about how other data sources (particularly administrative data sources) might be used to project HRRs and in household projections methods more widely.
Notes for: Household representative rates
Stage 1 of the existing MHCLG methodology uses five-year age bands from 15 to 19 years through to 85 years and over to project HRRs, while Stage 2 uses ten-year age bands from 15 to 24 years through to 85 years and over to project household headship rates.
The existing Household Projections use a simplified three-way relationship categorisation to represent marital/cohabitational status. The categories are people in couples (including married couples who are living together and cohabiting couples); separated marrieds, divorced and widowed not in couples; and people not in couples (not cohabiting, never married).
In the 1971 to 1991 Censuses, the HRP was the oldest male then the oldest female if there was no male. In the 2001 and 2011 Censuses, the HRP was the eldest economically active person then the oldest inactive person if there was no economically active person. The full explanation of the current HRP definition can be found on page 23 of the 2011 Census Glossary.
It was possible to obtain data for both the old and new definition of HRP from the 2001 Census.
See Table A.7, page 17, Holmans, AE (2005) Historical Statistics of Housing in Britain. Cambridge Centre of Housing and Planning Research, University of Cambridge.
See data Household projections stage 1: Household representative rate from 2014-based household projections: detailed data for modelling and analytical purposes
These concerns are cited on page 16 of 2014-based household projections: methodology and page 9 of Updating DCLG's household projections to a 2008 base: methodology.
Berrington, A. and Simpson, L. (2016) ‘Household Composition and Housing Need’ in Champion, T. and Falkingham, J. (eds.) Population Change in the United Kingdom. Rowman & Littlefield, pp. 105-124.
This model is also used by NRS in their Household Projections for Scotland – see page 42.
11. Numbers of households
Once produced, household population figures are multiplied by household representative rates (HRRs) to produce projected numbers of households for England, its regions and local authorities.
As in the existing methodology, we are planning to retain an element of geographical constraining once the HRRs have been projected. In the existing methodology, some of this constraining applies to HRRs, rather than to projected numbers of households. For simplicity and clarity, we are proposing to constrain the numbers of households produced by the HRRs, rather than the HRRs themselves. Projected numbers of households will be calculated for England, regions and local authorities separately, with regional numbers of households being constrained to the England total and local authority numbers of households constrained to the regional totals. This constraining takes place on the assumption that England and regional level projections will be less subject to the variation that can affect the smaller populations in local authorities. This approach also provides consistency across geographies.
Back to table of contents12. Annex 1: Household Projections Collaborative Group members
We would like to thank members of the Collaborative Group for their advice and expertise. It should be noted that while Collaborative Group members advised us on our research, decisions about the methodology are the responsibility of ONS.
- Greg Ball – Independent Demographer
- Richard Cooper – Independent Demographer
- Piers Elias – Independent Demographer
- John Hollis – Independent Demographer
- Neil McDonald – NM Strategic Solutions Ltd
- Phil Rees – University of Leeds
- Ludi Simpson – University of Manchester
- Christine Whitehead – London School of Economics
- Intelligence Unit – Greater London Authority
- Strategic Planning and Implementation – London Borough of Camden
- Housing and Planning Analysis Division – Ministry of Housing, Communities and Local Government
- Demographic Statistics – National Records of Scotland
- Population Statistics Division – ONS
- Housing and Income Analysis – ONS
- Administrative Data Census – ONS