Table of contents
- Main points
- Summary
- Introduction
- Super Output Area population estimates
- Clinical commissioning group population estimates
- Westminster Parliamentary Constituency population estimates
- Electoral Ward population estimates
- National Park population estimates
- Small area population estimates for other UK countries
- Background notes
- Methodology
1. Main points
- This release includes estimates for lower and middle layer Super Output Areas (LSOAs and MSOAs), Westminster parliamentary constituencies, electoral wards and National Parks in England and Wales and clinical commissioning groups (CCGs) in England.
- In mid-2014 there were 34,753 LSOAs in England and Wales with a mean population of 1,650 and 7,201 MSOAs with a mean population of 7,970. The LSOA with the highest median age in mid-2014 was Eastbourne 012B at 71.5 years, with 17.2 years being the lowest in Bury 026E.
- There were 211 CCGs in England with a mean population size of 257,400 in mid-2014. The CCG with the largest proportion of the population aged 75 and over continues to be NHS Eastbourne, Hailsham and Seaford at 13.4% (13.3% in mid-2013).
- The 573 Westminster Parliamentary Constituencies in England and Wales had a mean population of 100,200 in mid-2014. On average English constituencies tend to have larger populations than Welsh constituencies (means of 101,900 and 77,300 respectively).
- In mid-2014 electoral wards in England and Wales had a mean population of 6,750, although population sizes ranged from 150 in St. Martin’s ward in the Isles of Scilly to 40,530 in Central ward in Sheffield.
- The population of National Parks have an older age structure than England and Wales as a whole. More than 32% of the population of Exmoor and The Broads were aged 65 years or over.
- Small area population estimates are of particular use to central and local government for planning and monitoring services and for the calculation of a range of rates and indicators.
2. Summary
This release includes:
population estimates for lower and middle layer Super Output Areas (LSOAs and MSOAs) in England and Wales – these products are classified as National Statistics
population estimates for electoral wards, Westminster parliamentary constituencies and National Parks in England and Wales – these products are classified as experimental statistics
population estimates for health geographies in England (clinical commissioning groups (CCGs), NHS Area Teams and NHS Commissioning Regions) – these products are also classified as experimental statistics
These estimates are consistent with the results of the 2011 Census and are provided for the latest official geographic boundaries in place at the reference date.
Small area population estimates are used by both central government departments and local authorities for a range of purposes including planning and monitoring of services and as denominators for the calculation of various rates and indicators. Population estimates for LSOAs and MSOAs are often used for research and analysis as, unlike other small area geographies, such as electoral wards, they are specifically designed for statistical purposes. Electoral ward population estimates are of particular interest to local government organisations. Parliamentary constituency estimates are of importance to parliamentary organisations, researchers and MPs. Population estimates for health geographies are widely used within the health sector; and information on National Parks is valuable to both local government and the various National Park authorities.
Back to table of contents3. Introduction
Mid-year population estimates for 2014 for England and Wales, regions within England, and local authorities within England and Wales, were published on 25 June 2015. The estimates refer to the usually resident population on 30 June of the reference year and are published annually. In mid-2014 the population of England and Wales was 57,408,654, an increase of 0.8% since mid-2013 and 8.0% over the ten years since mid-2004.
The population increase since mid-2013 is driven by migration and natural change (births and deaths). Migration has had an impact on the working age population and on areas such as London. There is also an ageing population that results in an increase in the number of people in old age groups such as those aged 75 and over. Changes in the population of England and Wales are reflected in the changes at small area levels outlined throughout this bulletin.
Further information to support small area population estimates, covering methodology, quality and data sources are available:
Quality Management Information details a range of information about the background, quality, methods and quality assurance of the small area population estimates; this includes additional information on concepts, strengths and limitations, user needs and links to further advice about the output
a methodology note on production of small area population estimates details the data sources and methodology applied to producing the England and Wales small area population estimates
the ONS Revisions Policy on population statistics, including the small area population estimates, which explains how we implement and categorise revisions to statistics, including following a census
news on our population statistics can be obtained by subscribing to the quarterly newsletter (email your request to population.statistics@ons.gov.uk) or following the Twitter account @paulvickers_ONS
Small area population estimates
There are 2 broad types of small area population estimates, both of which are included in this release.
The main products are the estimates for Super Output Areas (SOAs), which are based on the 2011 Census and rolled forward annually using a ratio change methodology. This approach uses the change in the population recorded in administrative sources as an indicator of the change in the true population. These products hold National Statistics status.
The remainder of small area population estimates products relate to a range of different geographic areas and are derived directly from the SOA figures. Firstly, estimates for lower layer Super Output Areas (LSOAs) are broken down to Output Area (OA) level using an apportionment approach. These OA estimates are then aggregated to produce estimates for electoral wards and Westminster parliamentary constituencies on a best-fit basis. Estimates for health geographies are aggregated directly from LSOAs and estimates for National Parks are also calculated from the OA level data. These products hold experimental statistics status.
More information on the types of area for which small area population estimates are produced is given in, Small area population estimates: an explanation, accompanying this release.
The mid-2014 small area population estimates covered by this bulletin are fully consistent with population estimates for higher levels of geography including local authorities, regions and the national total for England and Wales. A full description of the methods used to calculate all small area population estimates is available in the methodology guide published on our website.
Small area population estimates are used by both central government departments and local authorities for a range of purposes, including planning and monitoring of services and as denominators for the calculation of various rates and indicators. The Quality and Methodology Information has further information on the quality and use of these statistics.
Back to table of contents4. Super Output Area population estimates
Super Output Areas (SOAs) are statistical geographies designed to improve the reporting of small area statistics. They are built from groups of census Output Areas, are of a consistent population size and are not subject to boundary changes between censuses. Where possible they are formed from groups of socially similar households and align with local features such as roads and railway lines. The comparability and stability of the geography, which cannot be provided by other small area administrative geographies such as wards or parishes, is one of the main benefits to users of statistics.
At mid-2014, the mean population of lower layer Super Output Areas (LSOAs) in England and Wales was 1,650, with population sizes ranging from 820 in Bexley 008A to 8,570 in Oxford 008A. Bexley 008A is located in the north west of central Dartford, while Oxford 008A includes many colleges belonging to Oxford University. Oxford 008A has remained the LSOA with the largest population since 2002 and had a population of 8,600 in the 2011 Census. After the 2011 Census a number of LSOAs that exceeded the upper population threshold of 3,000 were split. However, there were a few exceptional circumstances where splitting an LSOA was not possible, so the population remained above this upper population threshold, as explained in Changes to Output Areas and Super Output Areas in England and Wales, 2001 to 2011.
The mean population of middle layer Super Output Areas (MSOAs) was 7,970 in mid-2014. Excluding the Isles of Scilly, the smallest MSOA (Pendle 004) had a population of 4,960 whilst the MSOA with the largest population at mid-2014 was Milton Keynes 017, with approximately 17,710 usual residents. This area includes an Open University campus.
As shown in Figure 1, annual population change was less than 1% in 41.5% of LSOAs and less than 5% in 95.4% of LSOAs. Lower rates of change were seen in the larger MSOA areas. This compares to the annual change of 0.8% for England and Wales.
Figure 1: Distribution of LSOA and MSOAs by population change, mid-2013 to mid-2014
Source: Office for National Statistics
Download this chart Figure 1: Distribution of LSOA and MSOAs by population change, mid-2013 to mid-2014
Image .csv .xlsAge distribution
The median age of the population of England and Wales in mid-2014 was 40 years.
The median age for LSOAs within England and Wales varies widely between different areas. In mid-2014 the highest median age was 71.5 in Eastbourne 012B. As shown in Table 1, 7 of the top 10 LSOAs with the highest median ages are located close to the south coast of England in areas that are known for their large populations of people of retirement age. The exceptions are South Lakeland 013D located next to Morecambe Bay in Cumbria, Wealden 018A, which is a rural area located close to the South Downs National Park and King’s Lynn and West Norfolk 017D, which is located in the town of Downham Market. The top 10 LSOAs with the highest median ages are the same as mid-2013, but the rankings differ slightly.
Table 1: LSOAs with highest median age, mid-2014
| Rank | LSOA | Median age |
| 1 | Eastbourne 012B | 71.5 |
| 2 | King's Lynn and West Norfolk 017D | 69.7 |
| 3 | East Devon 012B | 69.1 |
| 4 | East Devon 020B | 69.1 |
| 5 | Christchurch 003A | 68.9 |
| 6 | Poole 018B | 68.8 |
| 7 | Christchurch 003B | 68.3 |
| 8 | East Dorset 011A | 68.0 |
| 9 | South Lakeland 013D | 67.9 |
| 10 | Wealden 018A | 67.2 |
| Source: Office for National Statistics | ||
Download this table Table 1: LSOAs with highest median age, mid-2014
.xls (52.7 kB)Table 2: LSOAs with lowest median age, mid-2014
| Rank | LSOA | Median age | |
| 1 | Bury 026E | 17.2 | |
| 2 | Salford 016E | 17.4 | |
| 3 | Bracknell Forest 012D | 18.2 | |
| 4 | Horsham 008E | 18.4 | |
| 5 | Rutland 005D | 18.6 | |
| 6 | West Berkshire 011C | 18.6 | |
| 7 | West Dorset 001E | 19.5 | |
| 8 | Harrow 029D | 19.6 | |
| 9 | East Northamptonshire 002E | 19.6 | |
| 10 | Haringey 029C | 19.8 | |
| Source: Office for National Statistics | |||
Download this table Table 2: LSOAs with lowest median age, mid-2014
.xls (55.3 kB)Population density
LSOAs are designed to have similar levels of population. Population density, that is the number of people living per square kilometre, can be used to highlight how different LSOAs are in terms of the geographic size of population settlements they include.
In mid-2014, the population density of England and Wales was 380 persons per square kilometre. Approximately 85% of LSOAs had a population density higher than that of England and Wales as a whole. The remaining 15% of LSOAs tend to be much larger and more sparsely populated. Population density was less than 1,000 persons per square kilometre in approximately 23% of LSOAs, while approximately 8% had a population density of 10,000 or more persons per square kilometre.
Table 3: LSOAs with highest population density, mid-2014
| Rank | LSOA | Population density (persons per sq. km) |
| 1 | Tower Hamlets 032D | 92,700 |
| 2 | Kensington and Chelsea 021C | 67,000 |
| 3 | Islington 011F | 55,900 |
| 4 | Westminster 022D | 48,600 |
| 5 | Westminster 024E | 47,800 |
| 6 | Hammersmith and Fulham 023E | 45,500 |
| 7 | Islington 006F | 45,400 |
| 8 | Tower Hamlets 025C | 42,000 |
| 9 | Tower Hamlets 028H | 42,000 |
| 10 | Westminster 014F | 41,200 |
| Source: Office for National Statistics | ||
Download this table Table 3: LSOAs with highest population density, mid-2014
.xls (54.8 kB)Table 4: LSOAs with lowest population density, mid-2014
| Rank | LSOA | Population density (persons per sq. km) | |
| 1 | Northumberland 019C | 2.5 | |
| 2 | Northumberland 007D | 4.1 | |
| 3 | Northumberland 003B | 4.3 | |
| 4 | Northumberland 037E | 4.7 | |
| 5 | Richmondshire 005E | 4.9 | |
| 6 | Gwynedd 015D | 5.0 | |
| 7 | Powys 014C | 6.2 | |
| 8 | Northumberland 019D | 6.3 | |
| 9 | Powys 020B | 6.8 | |
| 10 | Powys 004B | 6.8 | |
| Source: Office for National Statistics | |||
Download this table Table 4: LSOAs with lowest population density, mid-2014
.xls (54.8 kB)Notes for Super Output Area population estimates
- Population density is calculated as the population estimate of each SOA divided by its land area in square kilometres. Land area is measured to the mean high water mark for coastal areas and excludes areas of inland water. This is the Eurostat recommended method for compiling population density figures. Land area is obtained from the Standard Area Measurements published on the ONS Geography Portal.
5. Clinical commissioning group population estimates
Clinical commissioning groups (CCGs) are responsible for deciding how NHS funds are spent in their local area. They were introduced, for England only, by the Health and Social Care Act 2012 as part of a new structure for NHS organisation, which came into force on 1 April 2013. The 211 CCGs are organised into 25 NHS Area Teams, which in turn are grouped into 4 NHS Commissioning Regions. The data tables included in this release also provide population estimates for these higher health geography areas.
CCGs replaced the former health geography areas, known as Primary Care Organisations (PCOs). Following a formal consultation, we discontinued the production of population estimates for PCOs.
The mid-2014 CCG population estimates, referred to in this bulletin, are direct aggregations of mid-2014 lower layer Super Output Area (LSOA) estimates. They are consistent with population estimates for higher levels of geography, including local authorities and the national total for England. These estimates are classified as experimental statistics.
At mid-2014, the mean population of CCGs was 257,400 with population sizes ranging from 65,400 in NHS Corby to 882,800 in NHS North, East and West Devon.
Annual population change
Table 5 shows the 10 CCGs with the largest percentage increases in population, 8 of which are in London. The CCG with the largest percentage increase in population between mid-2013 and mid-2014 was NHS Tower Hamlets at 4.1%. As CCGs were only established in 2013, further comparisons are not available.
Table 5: CCGs with highest percentage population increase, mid-2013 to mid-2014
| Rank | Clinical commissioning group | Population increase (%) mid-2013 to mid-2014 | |
| 1 | NHS Tower Hamlets | 4.1 | |
| 2 | NHS Central London (Westminster) | 2.9 | |
| 3 | NHS Islington | 2.5 | |
| 4 | NHS City and Hackney | 2.3 | |
| 5 | NHS Camden | 2.2 | |
| 6 | NHS Hillingdon | 2.1 | |
| 7 | NHS Barking and Dagenham | 2.0 | |
| 8 | NHS Coventry and Rugby | 2.0 | |
| 9 | NHS Lewisham | 2.0 | |
| 10 | NHS North Manchester | 2.0 | |
| Source: Office for National Statistics | |||
Download this table Table 5: CCGs with highest percentage population increase, mid-2013 to mid-2014
.xls (53.8 kB)Age distribution
The age distribution of the resident population in a CCG is likely to impact on both the overall level of demand for health services, and the type of health services required. Areas with a large percentage of older people (particularly ages 75 and over) in their population are likely to have different demands on health services than those with a predominantly younger population. In 2015, the Government pledged that pensioners over the age of 75 would be guaranteed same-day access to a family doctor.
In mid-2014, 8.1% of the population of England were aged 75 or over. By comparison, over 13% of the population in NHS Eastbourne, Hailsham and Seaford were aged 75 or over. All of the CCGs shown in table 6 are coastal areas.
Table 6: CCGs with highest percentage of population aged 75 and over, mid-2014
| Rank | Clinical commissioning group | % aged 75+ | |
| 1 | NHS Eastbourne, Hailsham and Seaford | 13.4 | |
| 2 | NHS North Norfolk | 13.1 | |
| 3 | NHS Southport and Formby | 12.9 | |
| 4 | NHS Coastal West Sussex | 12.6 | |
| 5 | NHS Fylde and Wyre | 12.6 | |
| 6 | NHS South Devon and Torbay | 11.9 | |
| 7 | NHS Isle of Wight | 11.8 | |
| 8 | NHS West Norfolk | 11.7 | |
| 9 | NHS Hastings and Rother | 11.7 | |
| 10 | NHS Dorset | 11.7 | |
| Source: Office for National Statistics | |||
Download this table Table 6: CCGs with highest percentage of population aged 75 and over, mid-2014
.xls (53.8 kB)Table 7: CCGs with highest percentage of children (aged 0 to 15), mid-2014
| Rank | Clinical commissioning group | % of children | |
| 1 | NHS Bradford City | 28.1 | |
| 2 | NHS Barking and Dagenham | 27.0 | |
| 3 | NHS Slough | 25.1 | |
| 4 | NHS Bradford Districts | 23.5 | |
| 5 | NHS Luton | 23.4 | |
| 6 | NHS Blackburn with Darwen | 23.2 | |
| 7 | NHS Newham | 23.0 | |
| 8 | NHS Birmingham CrossCity | 22.9 | |
| 9 | NHS Sandwell and West Birmingham | 22.8 | |
| 10 | NHS Redbridge | 22.8 | |
| Source: Office for National Statistics | |||
Download this table Table 7: CCGs with highest percentage of children (aged 0 to 15), mid-2014
.xls (53.8 kB)Figure 2: Distribution of CCGs by population change, mid-2013 to mid-2014, England
Source: Office for National Statistics
Download this chart Figure 2: Distribution of CCGs by population change, mid-2013 to mid-2014, England
Image .csv .xls6. Westminster Parliamentary Constituency population estimates
Westminster Parliamentary Constituencies are the areas used to elect Members of Parliament (MPs) to the House of Commons, the primary legislative chamber of the UK. The current boundaries were introduced for the May 2010 General Election and include 533 constituencies in England and 40 in Wales. Parliamentary Constituency estimates are classified as experimental statistics.
At mid-2014, the mean population of parliamentary constituencies in England and Wales was 100,200 with population sizes ranging from 56,800 in Aberconwy to 166,400 in West Ham. On average, English constituencies have larger populations than Welsh constituencies with mean populations of 101,900 and 77,300 respectively.
Annual population change
Population change at parliamentary constituency level between mid-2013 and mid-2014 varies across the country, as shown in Map 1 below.
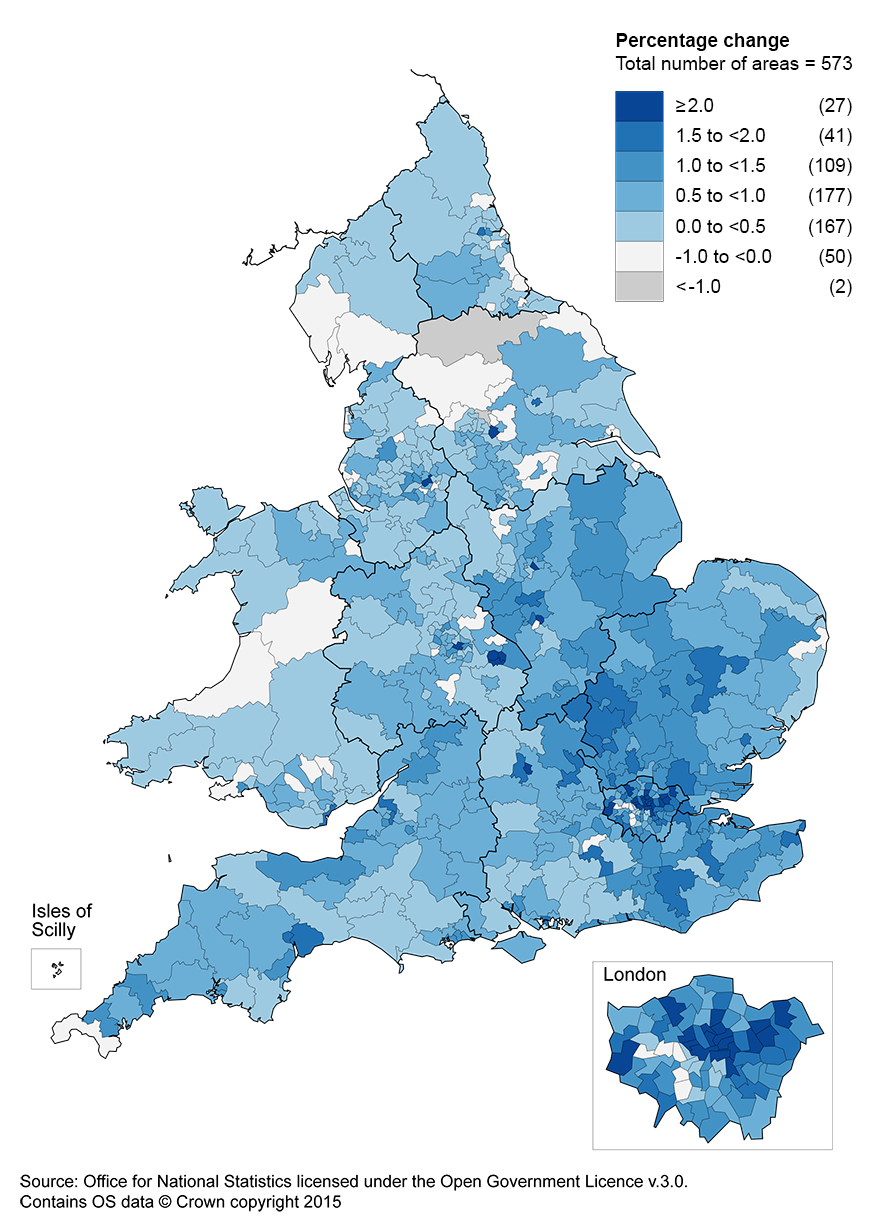
Map 1: Percentage change in parliamentary constituency population estimates, mid-2013 to mid-2014
Download this image Map 1: Percentage change in parliamentary constituency population estimates, mid-2013 to mid-2014
.png (574.9 kB)
Population decreases at parliamentary constituency level occur across the country, but are generally concentrated in the north of England and Wales, with the largest decrease (1.3%) in Leeds North West constituency.
Parliamentary constituencies are classified into 2 broad types of area: borough constituencies, which are defined as predominantly urban areas and county constituencies, which are partly or mostly rural areas. The designation of a constituency as either borough or county is made by the relevant Boundary Commission. Overall, 55% of constituencies are classified as county constituencies and 45% are classified as borough constituencies.
As shown in figure 3, borough constituencies account for the majority of areas where the population has increased by more than 1% in the year to mid-2014. The mean percentage population change for county constituencies is 0.6% compared with 0.9% for borough constituencies.
Figure 3: Distribution of borough and county parliamentary constituencies in England and Wales by percentage change in population, mid-2013 to mid-2014
Source: Office for National Statistics
Download this chart Figure 3: Distribution of borough and county parliamentary constituencies in England and Wales by percentage change in population, mid-2013 to mid-2014
Image .csv .xlsVoting age
In England and Wales in mid-2014 there were 45,187,300 persons aged 18 and over, making up 79% of the total usual resident population. In mid-2014, at parliamentary constituency level, the percentage of the population aged 18 and over varied from 66% in Birmingham, Hodge Hill to 86% in Liverpool, Riverside.
The population of voting age in a parliamentary constituency is not the same as the population who are entitled to vote, as it includes people who are not eligible to vote. For example, European Union citizens (excluding British citizens; and Irish, Cypriot and Maltese citizens who are qualifying Commonwealth citizens) are not entitled to vote in Westminster parliamentary elections, but are included in the population estimates if they are resident in the UK for 12 months or more.
Electoral statistics, providing counts of the number of persons registered to vote in each parliamentary constituency, are available on our website.
Back to table of contents7. Electoral Ward population estimates
Electoral wards are an important building block of UK administrative geography. They are the spatial units used to elect local government councillors in metropolitan and non-metropolitan districts, unitary authorities and London boroughs in England; and unitary authorities in Wales. In some unitary authorities in England they are legally termed as “electoral divisions”, however they are frequently referred to as wards and are referenced as such throughout this article. The 5 parishes of the Isles of Scilly are also treated as electoral wards for statistical purposes.
Electoral wards are subject to annual updates and boundary changes that make comparisons over longer periods more difficult. Mid-2014 population estimates are provided for the 8,503 electoral wards in England and Wales as at 31 December 2014, excluding the 18 wards that do not meet the minimum population requirements for data confidentiality (40 resident households and 100 resident people in the 2011 Census).
At mid-2014, the mean population of wards in England and Wales was 6,750. However, population sizes vary widely across the country ranging from 150 in St. Martin’s ward in the Isles of Scilly to 40,530 in Central ward in Sheffield. On average, wards in England have larger populations than those in Wales with mean populations of 7,100 and 3,630 respectively.
Annual population change
Figure 4 presents the distribution of the percentage change in electoral ward populations, from mid-2013 to mid-2014.
Figure 4: Distribution of wards by percentage change in total population estimate, mid-2013 to mid-2014
Source: Office for National Statistics
Download this chart Figure 4: Distribution of wards by percentage change in total population estimate, mid-2013 to mid-2014
Image .csv .xlsIn particular, the wards with the highest percentage increases in population between mid-2013 and mid-2014 tend to be areas which include new housing developments, or areas with large populations of students or armed forces.
Back to table of contents8. National Park population estimates
National Parks are designated areas of protected countryside aimed at conserving the natural beauty, wildlife and cultural heritage of the area. Each National Park has a National Park Authority (NPA) responsible for conservation, planning, recreation management and fostering the social and economic wellbeing of local communities.
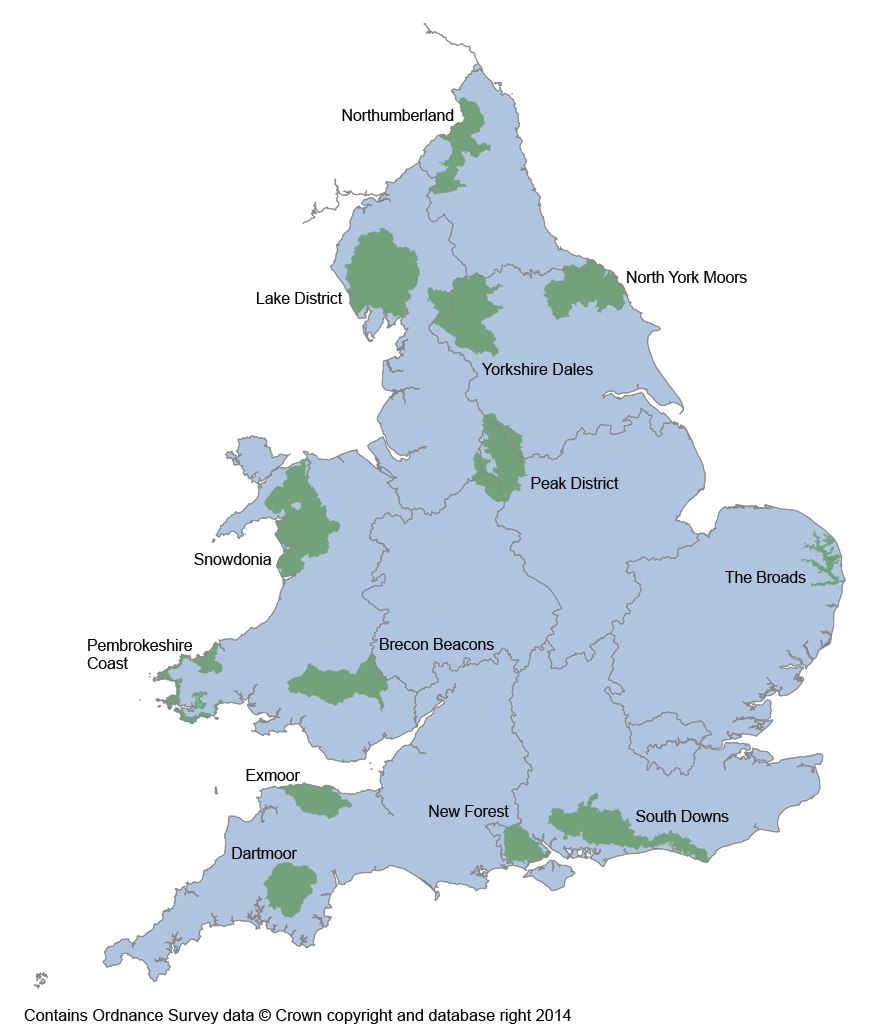
The Broads does not have a National Park designation, but is included in this set of statistics, as it is part of the National Parks family. The Broads has similar responsibilities to NPAs, but with additional powers relating to navigation. In total there are 13 National Parks in England and Wales (including the Broads).
Map 2: National Parks in England and Wales
Download this image Map 2: National Parks in England and Wales
.png (194.0 kB)
Figure 5: National Park population estimates, mid-2014, England and Wales
Source: Office for National Statistics
Download this chart Figure 5: National Park population estimates, mid-2014, England and Wales
Image .csv .xlsAge distribution
National Parks have an older age structure than the wider population of England and Wales. In mid-2014 the median age of National Parks in England and Wales varied from 47.7 in the South Downs to 55.5 in Exmoor. In contrast, the median age for England and Wales as a whole was 39.9.
Figure 6 shows the percentage of the population of each National Park aged 65 and over, a figure which provides a reasonable proxy for the size of the population who are of retirement age. It shows that all 13 National Parks have a larger population aged 65 and over than England and Wales as a whole. In mid-2014, 18% of the population of England and Wales was aged 65 and over, compared to 22% in Northumberland National Park and over 32% in Exmoor and The Broads. Employment may be an important factor affecting the age distribution of national parks.
Figure 6: Percentage of National Park populations aged 65 and over, mid-2014, England and Wales
Source: Office for National Statistics
Download this chart Figure 6: Percentage of National Park populations aged 65 and over, mid-2014, England and Wales
Image .csv .xlsNational Parks population density
Population density, that is the number of people living per square kilometre, can be used to highlight how sparsely populated National Parks are in comparison to more urban population settlements.
In mid-2014, the population density of England and Wales was 380 persons per square kilometre. Northumberland National Park is the most sparsely populated area with a population density of 2 persons per square kilometre and the South Downs is the most densely populated area with 69 persons per square kilometre.
Table 8: National Parks population density, mid-2014
| Rank | National Park | Population Density | |
| 1 | South Downs | 69 | |
| 2 | New Forest | 63 | |
| 3 | Pembrokeshire Coast | 39 | |
| 4 | Dartmoor | 36 | |
| 5 | Peak District | 26 | |
| 6 | Brecon Beacons | 25 | |
| 7 | The Broads Authority | 22 | |
| 8 | Lake District | 18 | |
| 9 | North York Moors | 16 | |
| 10 | Exmoor | 15 | |
| 11 | Snowdonia | 12 | |
| 12 | Yorkshire Dales | 11 | |
| 13 | Northumberland | 2 | |
| England and Wales | 380 | ||
| Source: Office for National Statistics | |||
Download this table Table 8: National Parks population density, mid-2014
.xls (55.3 kB)9. Small area population estimates for other UK countries
Population estimates are produced for similar small areas in both Scotland and Northern Ireland, however they are not produced using the same methodology as for small area population estimates in England and Wales.
National Records of Scotland (NRS) produce population estimates for Scottish data zones, which are slightly smaller areas than LSOAs, designed to contain approximately 500 to 1,000 household residents. NRS use a cohort component based method to produce estimates for data zones, further information on this methodology and the latest estimates (for mid-2014) are available from their website.
The Scottish data zones are used to produce population estimates for a range of other geographies including Westminster parliamentary constituencies in Scotland, Scottish parliamentary constituencies, and Nomenclature of Units for Territorial Statistics (the statistical geography used by the European Union). These figures are available from the Special Area Population Estimates section of the NRS website.
The Northern Ireland Statistics and Research Agency (NISRA) publish population estimates for Super Output Areas in Northern Ireland. These are of similar size to English and Welsh LSOAs, with an average population of 2,100. NISRA uses a mixed methodology based on both cohort component and ratio change approaches. Further information and the latest estimates published for mid-2014 are available from the NISRA website. Population estimates for wards, Neighbourhood Renewal Areas and Census Small Areas in Northern Ireland are also available.
A paper, Small Area Population Estimates across the UK which provides a broad description of the different methodologies used to produce small area population estimates in each constituent country of the UK, is also available on the NISRA website.
Back to table of contents