1. The UK population is growing
The UK population grew to an estimated 65.1 million in 2015, the largest ever, an increase of just over half a million people since 2014.
Following the relatively high population growth in the UK population during the “baby boom” of the 1960s, growth slowed during the 1970s. In the late 1980s, the population began to grow again when the 1960s’ baby boomers were having children, “echoing” earlier growth. Recent uplifts in population growth have generally coincided with an increase in the number of countries holding EU membership.
It is projected that the population will grow steadily, passing 70 million people in 2026 (Figure 1).
Figure 1: UK population estimates and projections, 1960 to 2030
Source: Office for National Statistics
Download this chart Figure 1: UK population estimates and projections, 1960 to 2030
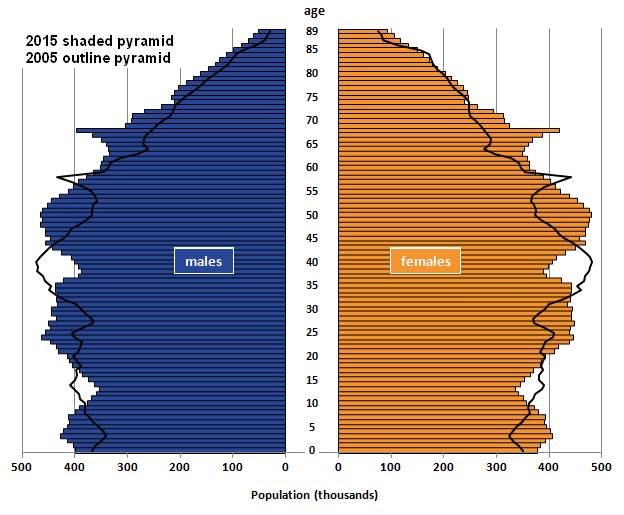
Image .csv .xlsThe population pyramid (Figure 2) shows the age and sex of the population. Several events have affected the structure of the population in 2015:
- there are a larger number of 68 year olds due to the spike in births after the end of World War 2
- the effects of the 1960s' baby boom can be seen in the larger number of people in their mid-40s to mid-50s and the children of the baby boomers can be seen in the higher number of people in their 20s
- low fertility in the 1970s and early 2000s can be seen in lower populations of people in their late 30s and early teens
- the group aged 20 to 35 in 2015 has increased in size when compared with 2005, when they were aged 10 to 25; such a change can only have been generated by adding to the population through immigration
The shape of the population by age was broadly similar for males and females in both 2005 and 2015. At older ages women begin to outnumber men; this is particularly evident in those aged over 80.
Figure 2: Population pyramid for the UK, 2005 & 2015
Source: Office for National Statistics
Download this image Figure 2: Population pyramid for the UK, 2005 & 2015
.png (31.8 kB) .xlsx (13.4 kB)
2. Why is the population growing?
The growth in population size is partly because the population is ageing. The percentage of the population that is 65 years or older is growing. It increased between 1975 and 2015, from 14.1% of the population to 17.8%. It is projected to continue to grow to nearly a quarter of the population by 2045 (Table 1). This is an important consideration for the provision of health and social care services and pensions.
Table 1: Age distribution of the UK population, 1975 to 2045 (projected)
| Year | UK Population | 0 to 15 years (%) | 16 to 64 years (%) | 65 years and over (%) |
| 1975 | 56,226,000 | 24.9 | 61.0 | 14.1 |
| 1985 | 56,554,000 | 20.7 | 64.1 | 15.2 |
| 1995 | 58,025,000 | 20.7 | 63.4 | 15.8 |
| 2005 | 60,413,000 | 19.3 | 64.7 | 15.9 |
| 2015 | 65,110,000 | 18.8 | 63.3 | 17.8 |
| 2025 | 69,444,000 | 18.9 | 60.9 | 20.2 |
| 2035 | 73,044,000 | 18.1 | 58.3 | 23.6 |
| 2045 | 76,055,000 | 17.7 | 57.8 | 24.6 |
| Source: Office for National Statistics | ||||
| Notes: | ||||
| 1. Totals may not sum to 100 due to rounding | ||||
Download this table Table 1: Age distribution of the UK population, 1975 to 2045 (projected)
.xls (27.1 kB)The proportion of children in the UK population has declined from over 24% in 1975 to less than 20% in 2015. This proportion is projected to decline even further in future years.
The proportion of the UK population who could be described as “traditional working age” (16 to 64 years old) has remained relatively stable over the last 40 years, but it is projected to decline in future years as a result of the growth of the ageing population.
Life expectancy over the last few decades has been steadily increasing. Girls born in 2015 can expect to live 82.8 years from birth, 4 years more than girls born in 1991. Males have seen a greater increase in life expectancy of 5.7 years, from 73.4 years for boys born in 1991 to 79.1 years for boys born in 2015.
Improved healthcare and lifestyles, especially for those aged 65 years and over, is the main reason for the increase in life expectancy.
The population also increases if there are more births than deaths. Natural change is the difference between births and deaths.
Since 1955 (except in 1976) the number of births in the UK has been higher than the number of deaths. This natural change has resulted in the growth of the population (Figure 3).
The number of live births each year has varied over the last 60 years. The trends are also evident in the population pyramid in Figure 2 – the first peak in the 1960s is the baby boom and the second is the “echo” of baby boomers having children. Births peaked again in 2012 reaching 813,000.
Figure 3: UK births, deaths and natural change, 1955 to 2015
Source: Office for National Statistics
Download this chart Figure 3: UK births, deaths and natural change, 1955 to 2015
Image .csv .xlsThe long-term trend in the number of deaths is more stable than the number of births. The number of deaths peaked in 1976 at 681,000 before steadily declining until 2011. The decline has been because people are living longer. More recently there has been a slight rise again – to 603,000 deaths in 2015 – mostly because the number of deaths is affected by the increasing size of the population.
Natural change isn’t the only factor contributing to the growing population. The population increase since the 1990s has also been attributed to the growth of net migration. Net migration is the number of immigrants (people moving to the UK) minus the number of emigrants (people leaving the UK).
The direct effect of net migration has increased the population by more than 250,000 people per year on average from 2004 to 2015; this is about 50,000 more people per year than natural change for the same period (Figure 4).
In addition to the direct impact of migration on the size of the population, current and past international migration also has indirect effects on the size of the population as it changes the numbers of births and deaths in the UK.
Figure 4: UK emigration, immigration and net migration, 1991 to 2015
Source: Office for National Statistics
Notes:
- Please note that the net migration estimates between 2001 and 2011 have been revised in light of the 2011 Census. Immigration and emigration estimates have not been revised and are therefore not consistent with the revised net migration estimates.
Download this chart Figure 4: UK emigration, immigration and net migration, 1991 to 2015
Image .csv .xlsImmigration has been higher than emigration since the early 1990s. In 2015, levels of immigration (631,500) were more than double those of emigration (299,200). The highest immigration levels to date were seen in 2014 with 632,000 people coming to the UK. Rises in immigration have tended to coincide with the expansion of the EU, allowing more people to freely migrate to the UK.
As shown by the widening of the population pyramid from 2005 to 2015, migrants tend to be aged 20 to 36, “traditional working age”.
Back to table of contents3. Consequences of these population changes
While living longer is a cause for celebration, an ageing population may result in fewer people of working age to support those of pension age. In 2016, there were an estimated 308 people of a pensionable age for every 1,000 people of a working age. By 2037, this is projected to increase to 365 people. This increase means that there will be fewer people of working age to support a larger population over State Pension age. While a larger population increases the size and productive capacity of the workforce, it also increases pressure and demand for services such as education, healthcare and housing.
Back to table of contents4. The European context
Figure 5 shows the population size for countries in the European Union and European Free Trade Association (EFTA).
Figure 5: Population size for countries in the European Union and European Free Trade Association, 2016
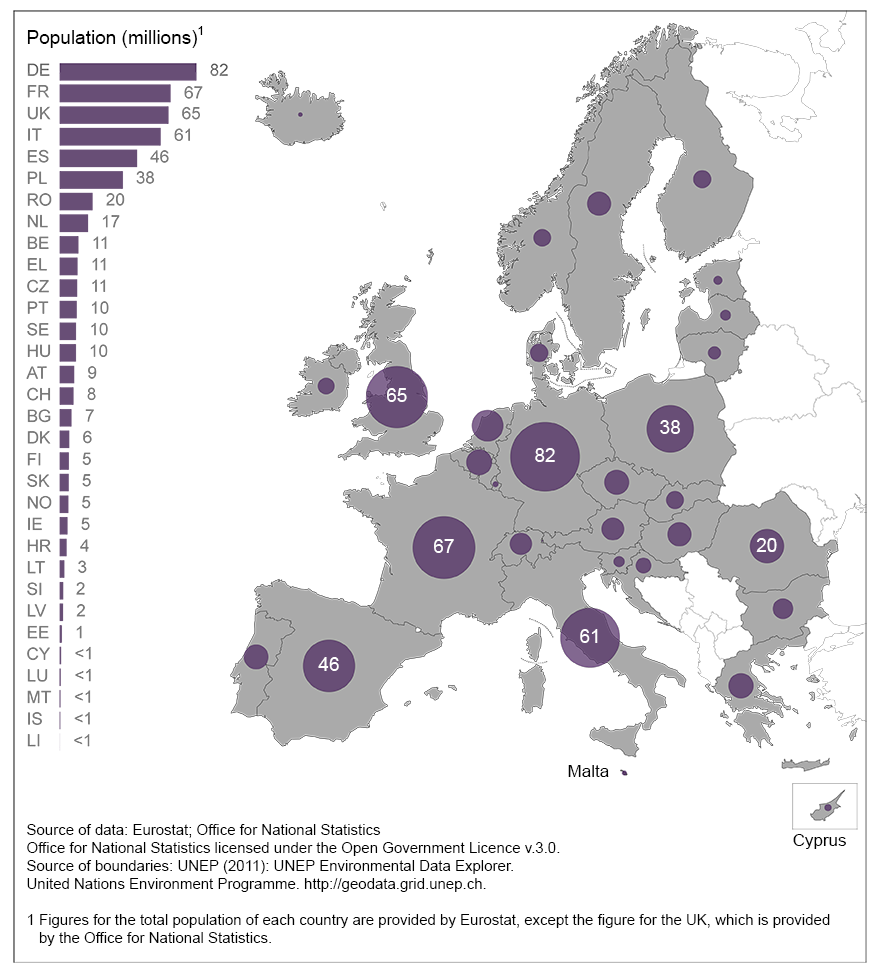
Source: Eurostat; Office for National Statistics
Notes:
- Country codes are defined in the download file.
Download this image Figure 5: Population size for countries in the European Union and European Free Trade Association, 2016
.png (283.7 kB) .xls (34.8 kB)
As of 1 January 2016, the UK is estimated to have the third largest population of these 32 countries. The UK’s population has the fourth highest population density with the equivalent of 263 people per square kilometre. Eurostat (the statistical office of the European Union) projects that the UK will have the largest population of these countries by 2050, at 77 million.
Back to table of contents