1. Main points
In 2016 the population of the UK was 65.6 million, its largest ever.
The UK population is projected to continue growing, reaching over 74 million by 2039.
The population in the UK is getting older with 18% aged 65 and over and 2.4% aged 85 and over.
In 2016 there were 285 people aged 65 and over for every 1,000 people aged 16 to 64 years (“traditional working age”).
Births are continuing to outnumber deaths and immigration continues to outnumber emigration, resulting in a growing population.
Please note:
The UK population figure in the first main point was incorrectly reported as 65.5 million and has now been corrected. We apologise for any inconvenience.
Back to table of contents2. The UK’s population is getting older – but it’s not the same in all areas of the UK
The population in 2016 was at its largest ever, at 65.6 million and projected to reach 74 million by 2039. While it is growing, improvements in healthcare and lifestyles mean the population is getting older; in 2016 in the UK, 18% of people were aged 65 and over, and 2.4% were aged 85 and over.
As a result of the ageing population the old age dependency ratio (OADR) is increasing. The OADR is the number of people over 65 years old for every 1,000 people aged between 16 and 64 years old – in mid-2016 the UK’s OADR was 285. It is a useful measure to understand how the balance in the population will change, particularly when planning for the needs of the different age groups.
Figure 1 shows different aspects of ageing for local authorities in the UK and compares how this changes every 10 years between 1996 and 2036. Numbers for 1996 to 2016 are based on population estimates, while numbers for 2026 and 2036 are based on population projections.
Figure 1: UK population aged 65 and over, aged 85 and over and the old age dependency ratio by local authority, 1996 to 2036
Embed code
Please note:
We are aware there were some technical errors with the interactives (affecting Wales and Northern Ireland), these have been updated and are correct as of midday on 25 July 2017.
Knowing previous and projected proportions of the older age groups is interesting and useful for planning care and health provisions.
Aside from London only a few other local authorities have seen small changes in the proportion of people over 65 between 1996 and 2036. In 1996, only a handful of areas had over 25% of their local population aged 65 and over, most of these being in southern regions of the UK. By 2036, over half of local authorities are projected to have 25% or more of their local population aged 65 and over, again with many of the highest authorities being in southern England. In mid-2016 it was estimated that West Somerset was the highest at 33.3% and Tower Hamlets was the lowest at 6.0%.
When we consider those who reach over 85 years old, the proportion of this population is smaller. In 1996 there were no local authorities with more than 3% of their population aged 85 and over. In 2006, most authorities had 2% to 3% of their local population aged 85 and over. In 2016 over half of local authorities had over 3% of their population aged 85 and over. This is projected to continue increasing, with very few authorities below 3% in 2026 and below 4% in 2036. Southern authorities including Rother, East Devon and Dorset have the highest proportions, while London Boroughs such as Tower Hamlets, Islington and Hackney are consistently among the lowest with a very old population.
Between 1996 and 2016 areas with higher proportions of people aged over 65 and aged over 85 were generally found close to coastal areas throughout the UK. Projections suggest this will change and more inland areas will have higher proportions of older people too, although London and surrounding areas will remain amongst the lowest.
Similar to the proportions of older people, the OADR has been increasing since 1996 and is projected to continue increasing. In 2016 only 11 local authorities had an OADR above 500; this is projected to increase to 62 by 2026 and 157 by 2036. By 2036 some authorities’ population aged 65 and over are expected to nearly match that of those aged 16 to 64, with West Somerset projected to have an OADR of 928.
The ageing population of the UK is influenced by many factors including mortality, fertility, health provisions and lifestyles.
The age distribution of the UK population is changing; Table 1 shows how this is changing for different age groups; children (aged 0 to 15 years), people who are most likely to be working (aged 16 to 64 years) and people most likely to be retired (aged 65 and over).
Table 1: Age distribution of the UK population, 1976 to 2046 (projected)
| 0 to 15 years (%) | 16 to 64 years (%) | Aged 65 and over (%) | UK population | |
| 1976 | 24.5 | 61.2 | 14.2 | 56,216,121 |
| 1986 | 20.5 | 64.1 | 15.4 | 56,683,835 |
| 1996 | 20.7 | 63.5 | 15.9 | 58,164,374 |
| 2006 | 19.2 | 64.9 | 15.9 | 60,827,067 |
| 2016 | 18.9 | 63.1 | 18.0 | 65,648,054 |
| 2026 | 18.8 | 60.7 | 20.5 | 69,843,515 |
| 2036 | 18.0 | 58.2 | 23.9 | 73,360,907 |
| 2046 | 17.7 | 57.7 | 24.7 | 76,342,235 |
| Source: Office for National Statistics | ||||
| Notes: | ||||
| 1. Population estimates data are used for 1996 to 2016, while 2014-based population projections are used for 2026 and 2036. | ||||
Download this table Table 1: Age distribution of the UK population, 1976 to 2046 (projected)
.xls (34.8 kB)The proportion of children in the UK population has declined from over 24.5% in 1976 to 18.9% in 2016. This proportion is projected to decline even further in future years.
The proportion of people aged 16 to 64 years has remained relatively stable over the last 40 years. Over the last 10 years it has started to decline and is projected to decline further in future years. This is a result of the growth in the population aged 65 and over.
Between 1976 and 2016 there was a 3.8 percentage point increase in the proportion of people aged 65 and over. It is projected to continue to grow to nearly a quarter of the population by 2046.
Life expectancy over the last few decades has been steadily increasing. Females born in 2015 can expect to live 82.8 years from birth, 4 years more than females born in 1991. Males have seen a greater increase in life expectancy of 5.7 years, from 73.4 years for males born in 1991 to 79.1 years for males born in 2015. Life expectancy in the UK is also projected to continue increasing; with life expectancy at birth for females projected to be 85.1 years by 2026 and 86.6 years by 2036. Males are also projected to live longer, increasing to 82.1 years by 2026 and 83.7 years by 2036.
Improved healthcare and lifestyles, especially for those aged 65 and over, is the main reason for the increase in life expectancy.
Back to table of contents3. The European context
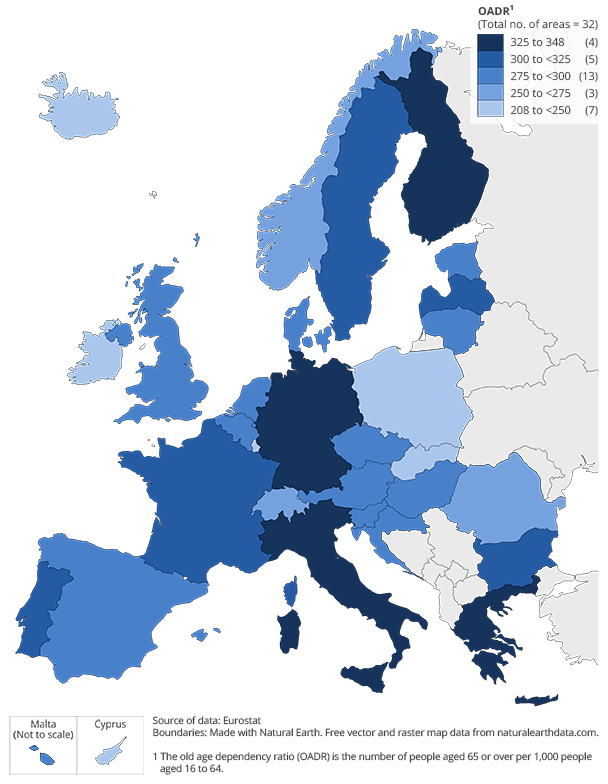
Figure 2 shows old age dependency ratios (OADRs) as at 1 January 2016, collated by Eurostat from the European Union (EU) and European Free Trade Association (EFTA) countries. At this time, the UK’s old age dependency ratio was 284. This was close to the OADR for all the selected European countries, which was 297. Italy (348), Greece (336) and Finland (329) have the highest ratios while Slovakia (209), Luxembourg (209) and Ireland (208) have the lowest.
Figure 2: Old Age Dependency Ratio for countries in the European Union and European Free Trade Association, 2016
Source: Eurostat
Download this image Figure 2: Old Age Dependency Ratio for countries in the European Union and European Free Trade Association, 2016
.png (183.3 kB)
4. The UK population is at its largest ever
The UK population is at its largest ever at 65.6 million, compared with 65.1 million for 2015, a growth rate of 0.8%. This is consistent with recent increases seen since 2005, which have varied between 0.6% and 0.8%.
Figure 3: UK population estimates and projections, 1960 to 2030
Source: Office for National Statistics
Notes:
- Population estimates data are used for 1996 to 2016, while 2014-based population projections are used for 2026 and 2036.
Download this chart Figure 3: UK population estimates and projections, 1960 to 2030
Image .csv .xlsFollowing the relatively high population growth in the UK population during the baby boom of the 1960s, growth slowed during the 1970s. In the late 1980s, the population began to grow again when the 1960s baby boomers were having children, echoing earlier growth. Recent uplifts in population growth have generally coincided with an increase in the number of countries holding EU membership.
It is projected that the population will grow steadily, passing 70 million people in 2026 (Figure 3).
The interactive population pyramid (Figure 4) shows the age and sex of the population by local authority. Several events have affected the structure of the UK population in 2016, including:
there are a larger number of 69 year olds due to the spike in births after the end of World War 2, but the rapid increases in numbers of those aged 65 and over seen between 2009 and 2015 may be temporarily slowing as relatively smaller cohorts reach age 65
the effects of the 1960s baby boom can be seen in the larger number of people in their mid-40s to mid-50s and the children of the baby boomers can be seen in the higher number of people in their 20s
low fertility in the 1970s and early 2000s can be seen in lower populations of people in their late 30s and early teens
the group aged 20 to 37 years in 2016 has increased in size when compared with 2006, when they were aged 10 to 27 years; such a change can only have been generated by adding to the population through international immigration
The shape of the population by age was broadly similar for males and females in both 2006 and 2016. At older ages women outnumber men; this is particularly evident in those aged 80 and over.
The population pyramid (Figure 4) is interactive so allows you to make comparisons across 10-year periods between 1996 and 2036 for different areas in the UK.
Figure 4: Population pyramid for the UK by local authority, 1996 to 2036
Embed code
Please note:
We are aware there were some technical errors with the interactives (affecting Wales and Northern Ireland), these have been updated and are correct as of midday on 25 July 2017.
Figure 4 shows that the age structure of the population can vary quite a lot between different regions. For example, in 2016 London boroughs have high proportions of young people whereas southern coastal areas have higher proportions of older people. Some neighbouring local authorities can differ greatly as well. In 2016 the profile of Southampton has large proportions of younger people, particularly aged 19 to 26 years, which differs greatly from that of the New Forest which has larger proportions of people aged around 50 and 70.
Back to table of contents5. What is causing the population to grow?
There are four factors that drive change in the population size; births, deaths, immigration and emigration.
Natural change is the difference between births and deaths. Over the last 60 years the number of births in the UK has been greater than the number of deaths. As a result of this natural change, the population has grown (Figure 5).
Figure 5: UK births, deaths and natural change, 1956 to 2016
Source: Office for National Statistics
Notes:
- 2016 data are provisional.
Download this chart Figure 5: UK births, deaths and natural change, 1956 to 2016
Image .csv .xlsThe number of live births has fluctuated over the last 60 years. After the baby boom in the 1960s and the “echo” of baby boomers having children, live births in the UK began to stabilise and have generally been between 700,000 and 800,000 since the mid 1970s. Births peaked recently in 2012 reaching 813,000, the highest since 1990.
The long-term trend in the number of deaths is more stable than the number of births. The number of deaths peaked in 1976 at 681,000 (the only year since 1955 to outnumber live births) before steadily declining until 2011. This decline is because people are living longer. More recently deaths began to slightly rise again, until 2016, where deaths decreased to 597,000.
These trends can also be explored in the interactive population pyramids (Figure 4).
Natural change has seen an increase in the population but the main driver of the growing population, particularly since the 1990s, can be attributed to net migration. Net migration is the number of immigrants (people moving to the UK for more than 12 months) minus the number of emigrants (people leaving the UK for more than 12 months).
The direct effect of net migration has increased the population by more than 251,000 people on average per year from 2004 to 2016; this is an average of 52,000 more people per year than natural change for the same period (Figure 6). In addition to this direct effect of migration on the size of the population, current and past international migration also has indirect effects on the size of the population as it changes the numbers of births and deaths in the UK.
Figure 6: UK emigration, immigration and net migration, 1991 to 2016
Source: Office for National Statistics (Long-Term International Migration)
Notes:
- 2016 data are provisional
- Net migration estimates between 2001 and 2011 have been revised in light of the 2011 Census. Immigration and emigration estimates have not been revised and are therefore not consistent with the revised net migration estimates.
Download this chart Figure 6: UK emigration, immigration and net migration, 1991 to 2016
Image .csv .xlsImmigration has been higher than emigration since the early 1990s. In 2015, levels of immigration (631,000) were more than double those of emigration (298,000). The highest immigration levels to date were seen in 2014 with 632,000 people coming to the UK. Rises in immigration have tended to coincide with the expansion of the EU, allowing more people to freely migrate to the UK. Immigration has fallen with provisional data for the year ending 2016 showing immigration dropped to 588,000, while emigration increased to 339,000. Provisional data for 2016 include 6 months of data following the EU referendum; a full year of data will be published in November 2017.
As shown by the widening of the population pyramid from 2006 to 2016, migrants tend to be aged 20 to 36 years, an age when people are likely to be working.
Back to table of contents6. Consequences of these population changes
The population of the UK is constantly changing and is projected to continue changing in the coming decades. With lower birth rates and higher life expectancy, the shape of the UK population is transforming. Whilst longevity is something to celebrate, the proportion of those of a working age is shrinking whilst those of a pensionable age is increasing. While a larger population can increase the size and productive capacity of the workforce, it also increases pressure and questions the sustainability to provide social services such as education, healthcare and housing.
Back to table of contents