1. Main points
Long-Term International Migration (LTIM) estimates (migration for 12 months or more)
In the year ending (YE) December 2015:
- Net Long-Term International Migration = +333,000 (up 20,000 from YE December 2014; not statistically significant)
- Immigration = 630,000 (down 2,000 from YE December 2014; not statistically significant)
- Emigration = 297,000 (down 22,000 from YE December 2014 ; not statistically significant)
Net migration in YE December 2015 was 10,000 higher than the 323,000 published for YE September 2015.
The increase in net migration was the result of a decrease in emigration, whereas immigration was at a similar level to the previous year. The decrease in emigration has been driven by a fall in the number of British citizens emigrating (down 14,000; not statistically significant).
Net migration of EU citizens was estimated to be 184,000 (compared with 174,000 in YE December 2014; change not statistically significant). Non-EU net migration was 188,000 a similar level compared with the previous year (194,000).
The estimate of immigration for EU citizens was 270,000, compared with 264,000 in YE December 2014 (a non statistically significant change). Immigration of non-EU citizens saw a decrease from 287,000 to 277,000 (not statistically significant).
In YE December 2015, 308,000 people immigrated for work, an increase of 30,000 from the previous year and the highest estimate on record. Of these, 178,000 (58%) had a definite job to go to and 130,000 (42%) arrived looking for work – the latter figure being a statistically significant increase from 104,000 the previous year.
Of all EU2 citizens who came to the UK in YE December 2015, 52,000 (84%) came for work-related reasons, a statistically significant increase of 17,000 from YE December 2014. Of these, 60% (31,000) arrived with a definite job to go to, a statistically significant increase of 17,000 from YE December 2014.
Latest employment statistics from the Labour Force Survey show the estimated employment level of EU nationals (excluding British) living in the UK was 2.1 million in January to March 2016, 224,000 higher than the same quarter last year. British nationals in employment increased by 185,000 to 28.2 million and non-EU nationals in employment increased by 5,000 to 1.2 million. Over half of the growth in employment over the last year was accounted for by foreign nationals. (These growth figures represent the NET change in the number of people in employment, not the proportion of new jobs that have been filled by non-UK workers.)
There were 630,000 National Insurance Number (NINo) registrations by EU nationals in YE March 2016, an increase of 1,000 (0%) on the previous year. For non-EU nationals, there were 195,000 NINo registrations in YE March 2016, an increase of 2,000 (1%) on the previous year.
In YE March 2016, visas granted (non-EU, main applicants) for skilled work rose 1,316 (+2%) to 54,961. Total work visas granted decreased 1,609 (-1%) to 121,639.
Long-term immigration for study was estimated to be 167,000 in YE December 2015, compared with 191,000 in YE December 2014 (not statistically significant). This was driven by a statistically significant decrease of 22,000 for non-EU citizens (112,000).
There were 41,563 asylum applications (including dependants) in YE March 2016, an increase of 30% compared with the previous year (32,036). This is the fifth successive year in which asylum applications have risen, although the number of applications is low relative to the peak in 2002 (103,081).
The largest number of applications for asylum, including dependants, came from nationals of Iran (4,811; +2,324), followed by Pakistan (3,511; -1), Iraq (3,374; +2,367), Eritrea (3,340; -270) and Afghanistan (3,133; +1,423). There were 2,235 (+680) Syrian nationals granted asylum or an alternative form of protection in the YE March 2016 and a further 1,667 Syrian nationals granted humanitarian protection under the Syrian Vulnerable Persons Resettlement Scheme.
Short-Term International Migration estimates for England and Wales, mid-2014
Short-Term International Migration estimates for England and Wales, mid-2014 were also published today (26 May 2016) and cover three definitions of a short-term migrant: the United Nations (UN) definition which is for 3 to 12 months for the purposes of work or study; 3 to 12 months covering all reasons; and the broadest definition which is 1 to 12 months covering all reasons for migration.
Using the UN definition in the year ending (YE) June 2014 there were 165,000 short-term immigrants, a statistically significant increase (43,000) compared with 122,000 in YE June 2013. There were 44,000 visits away compared with 39,000 the previous year.
In YE June 2014 short-term immigration for 3 to 12 months, for all reasons stood at 317,000, up 87,000 (statistically significant) from YE June 2013. Of these 37% (118,000) were for the reason “other” (which include activities such as: holidays and travelling; visiting family and friends; and working holidays). Short-term emigration of 3 to 12 months for all reasons was 399,000 compared with 384,000 in YE June 2013.
Short-term immigration of 1 to 12 months for all reasons in YE June 2014 was 1.2 million, a statistically significant increase of 110,000 visits compared with the previous year. Of these 62% (719,000) were for the reason “other”. Nearly 3 out of 4 (73%) of 1 to 12 month short-term immigrants leave within three months and all leave within 12 months. Short-term emigration of 1 to 12 months for all reasons was 2.4 million, similar to YE June 2013.
There were more than twice as many visits from England and Wales (1 to 12 months) than to England and Wales (1 to 12 months) and this pattern has been consistent since mid-2004. There is a similar pattern for the 3 to 12 month migrants but the gap is a lot closer. This is the opposite when using the UN definition of short-term migration.
In YE June 2014, the stock estimates showed that, on average, during the year there were 420,000 short-term emigrants compared with 241,000 short-term immigrants using the 1 to 12 month definition. The figures using the 3 to 12 month definition were 159,000 and 129,000 respectively. This shows that the impact of short-term migration, on average, reduces the resident population in England and Wales using either the 1 to 12 month or 3 to12 month definition. However, using the UN definition the opposite is the case but the numbers are much smaller: 19,000 short-term emigrants compared with 72,000 short-term immigrants.
2. Things you need to know
The Migration Statistics Quarterly Report (MSQR) brings together statistics on migration published by the Office for National Statistics (ONS), the Home Office and the Department for Work and Pensions (DWP).
Figures relating to visas are produced by the Home Office and include long-term and short-term migrants and their dependants; the Department for Work and Pensions National Insurance number allocations to adult overseas nationals also include long-term and short-term migrants.
ONS migration statistics use the UN recommended definition of a long-term international migrant: “A person who moves to a country other than that of his or her usual residence for a period of at least a year (12 months), so that the country of destination effectively becomes his or her new country of usual residence.”
Long-Term International Migration (LTIM) estimates are mainly based on data from the International Passenger Survey (IPS), with adjustments made for asylum seekers, non-asylum enforced removals, people resettled in the UK under the various resettlement schemes, visitor and migrant switchers and flows to and from Northern Ireland. This report uses LTIM estimates where available. However, these adjustments are only possible for single variables (for instance, citizenship or reason for migration). Estimates which look at citizenship by reason for migration are based solely on IPS data. In these cases the IPS totals will not match LTIM totals, but will give a good measure of magnitude and direction of change.
On 12 May 2016 we published an information note explaining the reasons why long-term international immigration figures from the IPS could differ from the number of National Insurance Number (NINo) registrations. It noted that the two series are likely to differ because of short-term immigration and timing differences between arriving in the UK and registering for a NINo. It emphasised that the estimates derived from the IPS are the most appropriate for measuring long-term immigration. NINo registrations data are not a good measure of LTIM, but they do provide a valuable source of information to highlight emerging changes in patterns of migration.
The analysis used 1 to 12 month short-term migration estimates for employment, study and work (other) to help explain the gap as this group was most likely to contain people who might register for a NINo. In YE June 2014 there were 251,000 EU citizens immigrating to England and Wales for 1 to 12 months for the reason of employment, study or work (other) compared with 239,000 the previous year. This is not the total level of short-term international migration but the most appropriate to help explain the gap. An adhoc analysis was also run to estimate the number of short-term international migrants in 2015 using ‘intentions’ data. Two estimates were included to reflect the uncertainty and the fact that they can be estimated in different ways. The paper provides more information on this. The mid-2015 ‘actual’ STIM estimates will be published in May 2017.
Definitional differences between these data are fundamental, meaning it is not possible to provide a reconciliation that simply ‘adds’ and ‘subtracts’ different elements of the NINo registrations, LTIM estimates and STIM estimates. Adding together LTIM and STIM estimates does not provide a reliable measure of all immigration to the UK within a specific time period. Short-term immigration flows are based on journeys, not people, and have methodological differences from LTIM flows. In addition, it is possible for someone to be both a long-term and short-term migrant in the same period, and STIM estimates are based on actual flows whereas LTIM covers migrants' intentions.
However, although they cannot be added together to provide one single, accurate measure of international migration, LTIM and STIM estimates of immigration and emigration should be considered alongside and in the context of each other. As these estimates represent different people immigrating for different reasons but they can help to provide an overall picture of international migration. Historical data on short-term and long-term international migrants are published on the ONS website, and there is a summary of the definitional differences between these data. For more detail on the NINo and IPS comparison, users are encouraged to read the report.
Short-Term International Migration estimates, mid-2014 were also published today (26 May 2016). Using the United Nations (UN) definition (3 to 12 months for work and study) in the year ending (YE) June 2014 there were 165,000 short-term immigrants, a statistically significant increase (43,000) compared with 122,000 in YE June 2013. There were 44,000 visits away compared with 39,000 the previous year.
In YE June 2014 short-term immigration for 3-12 months, for all reasons stood at 317,000, up 87,000 (statistically significant) from YE June 2013. Of these 37% (118,000) were for the reason “other” (which include activities such as: holidays and travelling; visiting family and friends; and working holidays). Short-term emigration of 3 to 12 months for all reasons was 399,000 compared with 384,000 in YE June 2013.
Short-term immigration of 1 to 12 months for all reasons in YE June 2014 was 1.2 million, a statistically significant increase of 110,000 visits compared with the previous year. Of these 62% (719,000) were for the reason “other”. Nearly 3 out of 4 (73%) of 1 to12 month short-term immigrants leave within three months and all leave within 12 months. Short-term emigration of 1 to 12 months for all reasons was 2.4 million, similar to YE June 2013.
There were more than twice as many visits from England and Wales (1 to 12 months) than to England and Wales (1 to 12 months) and this pattern has been consistent since mid-2004. There is a similar pattern for the 3-12 month migrants but the gap is a lot closer. This is the opposite when using the UN definition of short-term migration.
In YE June 2014, the stock estimates showed that, on average, during the year there were 420,000 short-term emigrants compared with 241,000 short-term immigrants using the 1 to 12 month definition. The figures using the 3 to 12 month definition were 159,000 and 129,000 respectively. This shows that the impact of short-term migration, on average, reduces the resident population in England and Wales using either the 1 to 12 month or 3 to 12 month definition. However, using the UN definition the opposite is the case but the numbers are much smaller: 19,000 short-term emigrants compared with 72,000 short-term immigrants.
There is considerable interest in migration statistics both nationally and internationally, and they are a fundamental component of our mid-year population estimates. These are used for planning and service delivery, resource allocation and managing the economy. Additionally, migration statistics are used to monitor progress against a government-stated ambition of delivering annual net migration in the tens of thousands, not the hundreds of thousands1, and are of much interest to the EU referendum debate.
Throughout the report, all changes referred to are from the year ending December 2014 to the year ending December 2015, unless otherwise stated.
Notes for Things you need to know
- Conservative Manifesto 2015 – for immigration see page 29.
3. Net migration to the UK
Net migration is the difference between immigration and emigration.
The net migration estimate for the year ending (YE) December 2015 is +333,000 and has a 95% confidence interval of +/-38,000, an increase (although not statistically significant) from the estimate of +313,000 (+/-43,000) in YE December 2014.
Net migration in YE December 2015 was 10,000 higher than the 323,000 published for YE September 2015.
(From here on, any reference to change, such as increase or decrease, refers to YE December 2015 compared with YE December 2014. All estimates quoted within this section are Long-Term International Migration (LTIM) based estimates, and comparisons are not statistically significant, unless otherwise stated.)
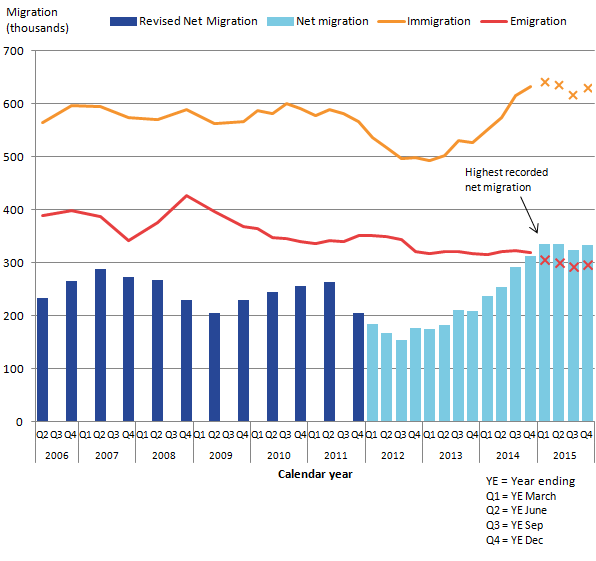
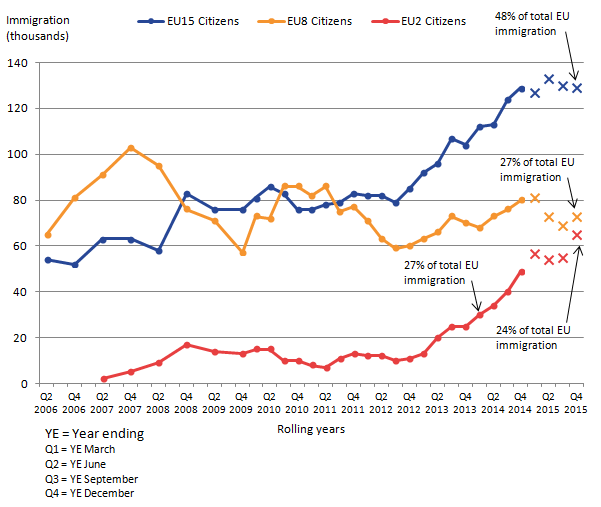
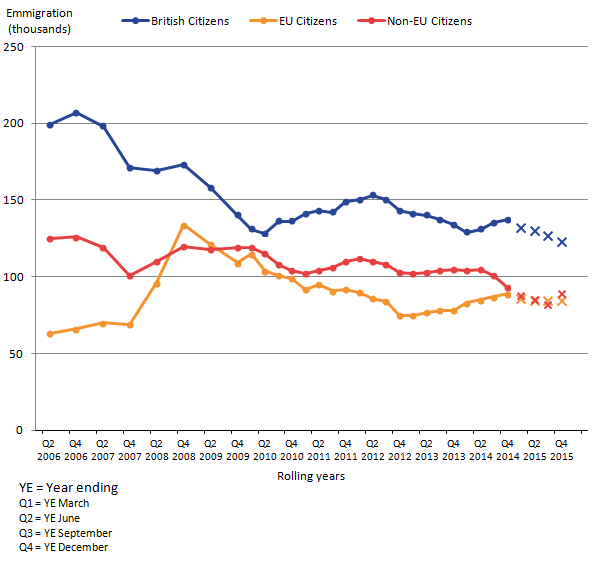
Figure 1 shows rolling annual estimates from YE June 2006 onwards illustrating that the latest provisional net migration estimate is higher than the emigration estimate, a result of immigration being more than twice as high as emigration.
Figure 1: Long-Term International Migration, UK, 2006 to 2015 (YE December 2015)
Source: Office for National Statistics, Long-Term International Migration
Notes:
- Figures for years ending 2015 are provisional. In this chart provisional estimates are represented by a cross.
- Net migration estimates for the period 2001 to 2011 have been revised in light of the 2011 Census. Immigration and emigration estimates have not been revised and are therefore not consistent with the revised net migration estimates. The revised estimates are only available for the years ending June and December each year.
Download this image Figure 1: Long-Term International Migration, UK, 2006 to 2015 (YE December 2015)
.png (21.6 kB) .xls (39.4 kB)
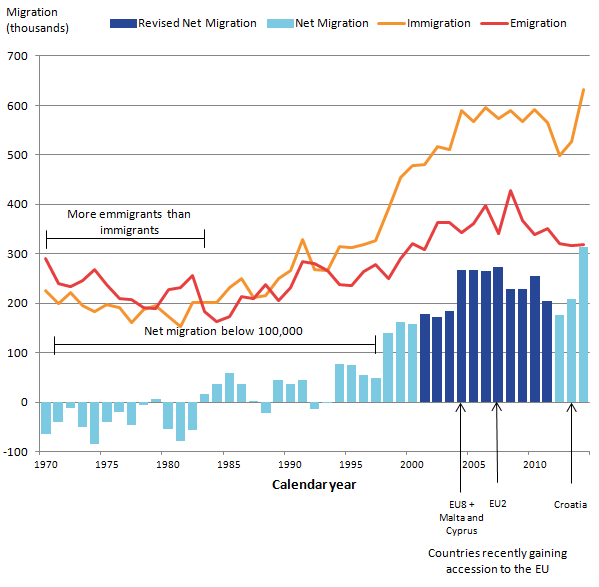
Figure 2 provides annual totals from 1970 to 2014 to show the longer-term context.
Figure 2: Long-Term International Migration, UK, 1970 to 2014 (annual totals)
Source: Office for National Statistics, Long-Term International Migration and International Passenger Survey
Notes:
- Net migration estimates for the period 2001 to 2011 have been revised in light of the 2011 Census. Immigration and emigration estimates have not been revised and are therefore not consistent with the revised net migration estimates.
- Data pre-1991 are IPS data only. LTIM data are shown from 1991 onwards.
- Although Malta and Cyprus also acceded in 2004, they are not included in the EU8.
Download this image Figure 2: Long-Term International Migration, UK, 1970 to 2014 (annual totals)
.png (29.3 kB) .xls (36.4 kB)
An interactive version of Figure 2 up to 2014 with additional commentary is available on the Neighbourhood Statistics website.
Table 1 shows the headline figures for YE December 2014 and YE December 2015 with their corresponding confidence intervals. Statistically significant changes are normally denoted with an asterisk, but no changes in this table are statistically significant.
Table 1: Latest changes in migration, UK, YE December 2014 and YE December 2015
| United Kingdom | |||||
| Thousands | |||||
| YE Dec 2014 | 95% CI | YE Dec 2015 | 95% CI | Difference | |
| Net migration | 313 | +/-43 | 333 | +/-38 | 20 |
| Immigration | 632 | +/-36 | 630 | +/-33 | -2 |
| Emigration | 319 | +/-22 | 297 | +/-20 | -22 |
| Source: Office for National Statistics | |||||
| Notes: | |||||
| 1. 2015 estimates are provisional | |||||
| 2. Figures are rounded to the nearest thousand. Figures may not sum due to rounding. | |||||
| 3. Further information on confidence intervals can be found in the MSQR Information for Users. | |||||
| 4. YE = Year Ending. | |||||
| 5. CI = Confidence Interval. | |||||
| 6. Statistically significant change at the 5% level is indicated by an asterisk. | |||||
Download this table Table 1: Latest changes in migration, UK, YE December 2014 and YE December 2015
.xls (27.6 kB)The most recent increase in net migration (not statistically significant) has been driven by a decrease in emigration (not statistically significant) coupled with a similar level of immigration compared with the previous year. The decrease in emigration has been driven by a fall in the number of British citizens emigrating (down 14,000; not statistically significant).
Table 2 illustrates EU and non-EU citizen net migration for YE December 2014 and YE December 2015 with their corresponding confidence intervals. Statistically significant changes are normally denoted with an asterisk, but no changes in this table are statistically significant.
Table 2: Latest changes in EU and non-EU citizens net migration, UK, YE December 2014 and YE December 2015
| United Kingdom | ||||||
| Thousands | ||||||
| YE Dec 2014 | 95% CI | YE Dec 2015 | 95% CI | Difference | ||
| British | -55 | +/-19 | -39 | +/-17 | 16 | |
| EU (Total exc British) | 174 | +/-29 | 184 | +/-27 | 10 | |
| EU15 | 79 | +/-21 | 79 | +/-18 | 0~ | |
| EU8 | 48 | +/-18 | 47 | +/-14 | -1 | |
| EU2 | 44 | +/-11 | 58 | +/-15 | 14 | |
| Non-EU | 194 | +/-25 | 188 | +/-20 | -6 | |
| Source: Office for National Statistics | ||||||
| Notes: | ||||||
| 1. 2015 estimates are provisional. | ||||||
| 2. 0~ = rounds to zero. | ||||||
| 3. Figures are rounded to the nearest thousand. Figures may not sum due to rounding. | ||||||
| 4. Estimates for Malta, Cyprus and Croatia are included within the EU total , but are not shown separately. | ||||||
| 5. Further information on confidence intervals can be found in the MSQR Information for Users. | ||||||
| 6. YE = Year Ending. | ||||||
| 7. CI = Confidence Interval. | ||||||
| 8. Statistically significant change at the 5% level is indicated by an asterisk. | ||||||
Download this table Table 2: Latest changes in EU and non-EU citizens net migration, UK, YE December 2014 and YE December 2015
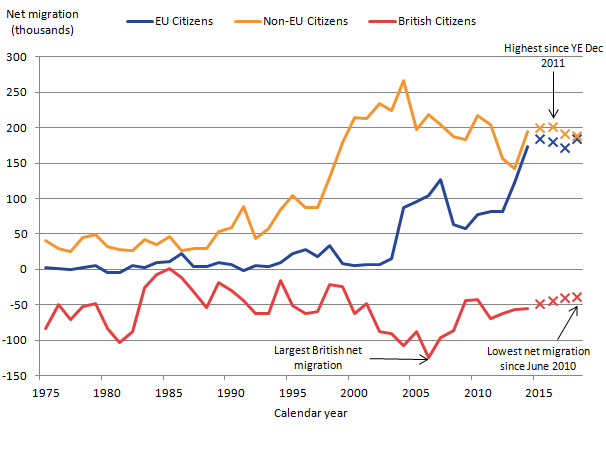
.xls (28.7 kB)Figure 3 shows the trend in net migration for EU, non-EU and British citizens and shows net migration for EU and non-EU citizens is almost equal.
Figure 3: Net Long-Term International Migration by citizenship, UK, 1975 to 2015 (YE December 2015)
Source: Office for National Statistics, Long-Term International Migration
Notes:
- Figures for 2015 are provisional and quarterly. All other figures are final calendar year estimates of LTIM. Provisional rolling quarterly estimates are represented in this chart by a cross.
- This chart is not consistent with the total revised net migration estimates as shown in Figures 1 and 2. This also means that estimates for the period 2001 to 2011 are not fully comparable with those for later periods.
- Note that the data for 2015 reflects quarterly year ending data whereas for 2014, and before, the data are calendar year data.
Download this image Figure 3: Net Long-Term International Migration by citizenship, UK, 1975 to 2015 (YE December 2015)
.png (32.6 kB) .xls (32.3 kB)
EU citizens
Net migration for EU citizens was estimated to be 184,0001 in YE December 2015 (compared with 174,000 in YE December 2014). The apparent increase in EU net migration was largely due to the increase in net migration of EU2 citizens (increasing from 44,000 to 58,000). Net migration of EU15 and EU8 citizens remained similar to the previous year at 79,000 and 47,000 respectively.
Non-EU citizens
In YE December 2015, non-EU net migration was 188,000, a similar level compared with the previous year (194,000). British citizens
British citizens
Net migration of British citizens was estimated to be -39,000 meaning more British people left the UK than came to the UK. This is the closest to zero that British net migration has been since YE June 2010 and continues a decreasing trend that started in YE March 2012.
Notes for Net migration to the UK
- Throughout the report, users are encouraged to review our published tables and note the confidence intervals around our estimates. These confidence intervals give an indication of the accuracy of the estimates and the extent to which comparisons can be drawn between them.
4. Immigration to the UK
The latest immigration estimate for the year ending (YE) December 2015 is 630,000, with a confidence interval of +/-33,000, similar to 632,000 (+/-36,000) in YE December 2014.
(From here on, any reference to change, such as increase or decrease, refers to YE December 2015 compared with YE December 2014. All estimates quoted within this section are Long-Term International Migration (LTIM) based estimates, and comparisons are not statistically significant, unless otherwise stated.)
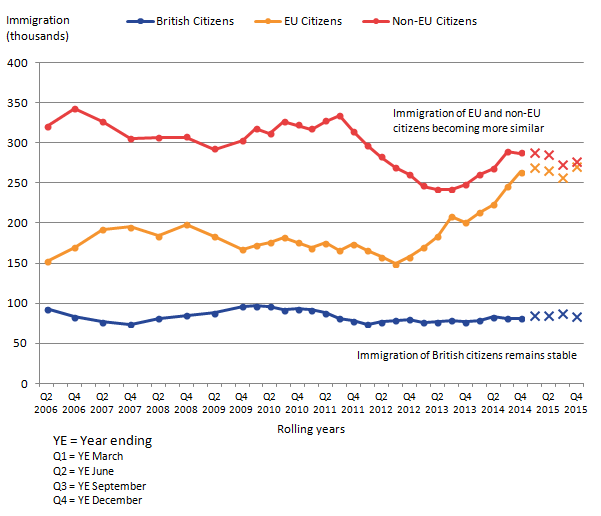
Immigration of EU citizens was estimated to be 270,000 compared with 264,000 the previous year. Non-EU citizens (277,000) showed a similar immigration estimate to EU citizens and a slight decrease compared with the previous year to 287,000 (Figure 4).
Figure 4: Immigration to the UK by citizenship, 2006 to 2015 (YE December 2015)
Source: Office for National Statistics, Long-Term International Migration
Notes:
- Figures for 2015 are provisional. In this chart provisional estimates are represented by a cross.
- This chart is not consistent with the total revised net migration estimates as shown in Figures 1 and 2.
Download this image Figure 4: Immigration to the UK by citizenship, 2006 to 2015 (YE December 2015)
.png (29.9 kB) .xls (35.3 kB)
EU citizens
Figure 5 shows how EU immigration is split between the 3 main EU groups.
Figure 5: EU immigration to the UK, 2006 to 2015 (YE December 2015)
Source: Office for National Statistics, Long-Term International Migration
Notes:
- Figures for 2015 are provisional. In this chart provisional estimates are represented by a cross.
- This does not include Malta, Cyprus or Croatia.
- Figures are rounded to the nearest thousand. Figures may not sum due to rounding.
Download this image Figure 5: EU immigration to the UK, 2006 to 2015 (YE December 2015)
.png (24.7 kB) .xls (35.8 kB)
Non-EU citizens
Immigration of non-EU citizens was estimated to be 277,000 compared with 287,000 the previous year. No statistically significant changes were seen for individual country groupings.
Immigration estimates of non-EU citizens showed a decline between YE September 2011 and YE June 2013. This decline was largely due to lower immigration of Asian citizens, in particular for study. Visa statistics suggest this was related to the sharp decline in long-term immigrants from South Asia coming to study in the further education sector.
Entry clearance visas
Nationality information on individuals that are subject to immigration controls, coming from non-EU countries, is provided by data on entry clearance visas.
Figure 6: Entry clearance visas granted (excluding visitor and transit visas) to the UK, top 10 nationalities, YE March 2016

Source: Home Office, Immigration Statistics January to March 2016
Notes:
- China excludes Hong Kong.
- The image shows the number of entry clearance visas granted, excluding visitor and transit visas, for the top 10 nationalities in YE March 2016. The data are available in Home Office Quarterly Immigration Statistics within the visa topic section.
Download this image Figure 6: Entry clearance visas granted (excluding visitor and transit visas) to the UK, top 10 nationalities, YE March 2016
.png (172.4 kB) .xls (278.5 kB)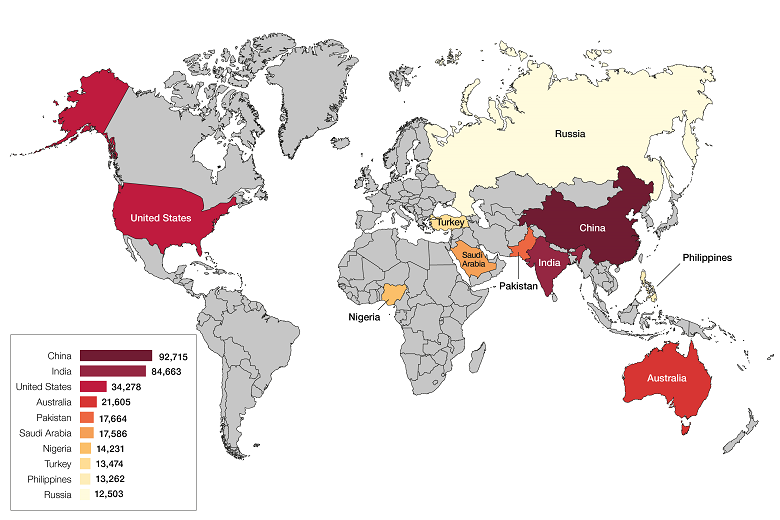
Figure 6 shows, for YE March 2016, the top 10 nationalities granted visas after excluding visitor and transit visas. Asian nationals accounted for 298,231 (56%) of the 531,375 longer-term visas granted in YE March 2016, with China and India accounting for 17% and 16% of the total respectively. The third largest number granted went to US Nationals, who comprised less than 7% of the total.
The number of non-visitor visas granted in YE March 2016 (531,375), decreased slightly from YE March 2015 (down 11,931 or -2%). There were increases for Chinese nationals (up 7,365 or +9%) and falls for Russians (down 5,661 or -31%) and Libyans (down 5,093 or -83%).
There are a range of potential reasons why the long-term immigration estimates from the IPS may differ from figures for visas granted or passenger arrivals, including:
- differences in coverage, including differences between intentions and visa length
- sampling variation in the IPS
- timing differences between when visas are granted and when an individual travels
- visa and admissions data includes dependants, and both short-term and long-term migrants
Although the above figures exclude visitor and transit visas, they will include some individuals who do not plan to move to the UK for a year or more, as well as dependants. Nevertheless, recent trends in visas granted have provided a good leading indicator for trends in long-term non-EU immigration.
For more information see the Home Office Immigration Statistics January to March 2016 bulletin.
British citizens
LTIM estimates show that in YE December 2015, the estimated number of British citizens immigrating to the UK was 83,000. This figure is similar to the 81,000 British citizens estimated to have immigrated to the UK in YE December 2014. These numbers include British citizens returning to the UK after living abroad for a period, or citizens who were born abroad and may be coming to the UK for the first time. IPS estimates show that the majority of British citizens (53% or 44,000) are immigrating for work-related reasons, 45% of whom had a definite job to go to.
Immigration to the UK by main reason
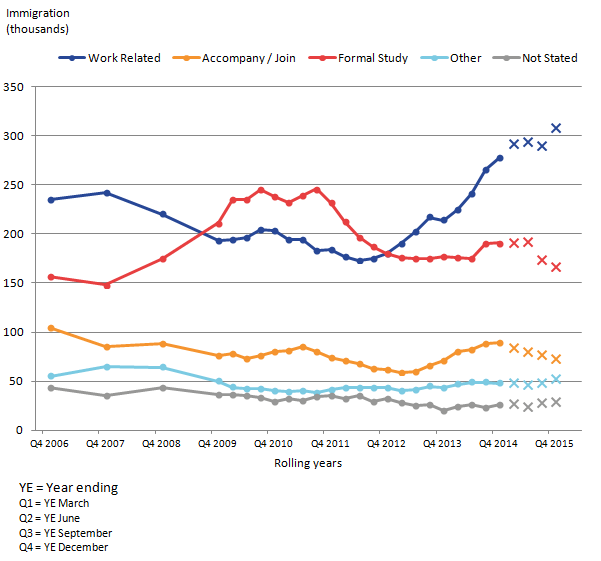
The following sections describe the main reason for migration for long-term immigrants to the UK. Three-quarters of immigrants to the UK are people migrating to work or study (Figure 7).
Figure 7: Long-Term International Migration estimates of immigration to the UK, by main reason for migration, 2006 to 2015 (YE December 2015)
Source: Office for National Statistics, Long-Term International Migration
Notes:
- Figures for 2015 are provisional. In this chart provisional estimates are represented by a cross.
- Up to YE Dec 09, estimates are only available annually.
- Acc./join means accompanying or joining.
Download this image Figure 7: Long-Term International Migration estimates of immigration to the UK, by main reason for migration, 2006 to 2015 (YE December 2015)
.png (22.5 kB) .xls (32.8 kB)
IPS data show that, of those whose main reason for migration was work-related, the majority (61%) were EU citizens. However of those whose main reason for migration was study, the majority (72%) were non-EU citizens. This difference likely reflects the differing rights of EU and non-EU citizens to migrate to the UK as well as the impact of government policies and other factors.
Table 3 shows Home Office visa statistics by reason for immigration of non-EU citizens.
Table 3: Grants by visa categories to non-EEA nationals, UK, YE March 2016
| United Kingdom | |
| Visa category | Visa granted |
| Total | 531,375 |
| Study | 206,162 |
| Work: | 163,857 |
| High value & Skilled work (Tiers 1 & 2) | 96,616 |
| Youth mobility, temporary and other work visas (Tier 5 & other) | 67,241 |
| Short-term students | 64,798 |
| Family-related | 38,274 |
| Other | 58,284 |
| Source: Home Office, Immigration Statistics January to March 2016 | |
Download this table Table 3: Grants by visa categories to non-EEA nationals, UK, YE March 2016
.xls (26.6 kB)IPS long-term immigration estimates for work and formal study among non-EU nationals broadly follow the same long-term trends as visas granted for work and study. However, IPS estimates will be lower than the visa figures because the IPS estimates exclude those individuals who intend to stay for less than 1 year, and there will be other differences in categorisation. Furthermore, the dependants of those granted a visa to work or study are included in the work and study visa figures, whereas the reason for migration for such individuals, in most cases, are likely to be recorded as accompanying or joining others by the IPS. For more information see the Home Office Immigration Statistics January to March 2016 bulletin.
Immigration for work
The most commonly stated reason for immigration to the UK is work (Figure 7). In YE December 2015, 308,000 people immigrated for work, an increase of 30,000 from the previous year and the highest estimate on record. Of these, 178,000 (58%) had a definite job to go to and 130,000 (highest estimated) arrived looking for work – a statistically significant increase from 104,000.
IPS estimates show around 61% of immigrants arriving for work were EU citizens, 24% were non-EU citizens and 15% were British citizens. 178,000 EU citizens arrived for work in YE December 2015, compared with 155,000 in YE December 2014. While that change was not statistically significant, there was a statistically significant increase in EU2 citizens coming for work, from 35,000 to 52,000.
Figure 8: IPS estimates of immigration to the UK for work-related reasons by citizenship, YE December 2012 to YE December 2015

Source: Office for National Statistics, International Passenger Survey
Notes:
- Figures for 2015 are provisional. In this chart provisional estimates are represented by a cross.
- These are rolling year estimates, and peaks are shown with the appropriate “year ending” data.
Download this image Figure 8: IPS estimates of immigration to the UK for work-related reasons by citizenship, YE December 2012 to YE December 2015
.png (38.0 kB) .xls (30.2 kB)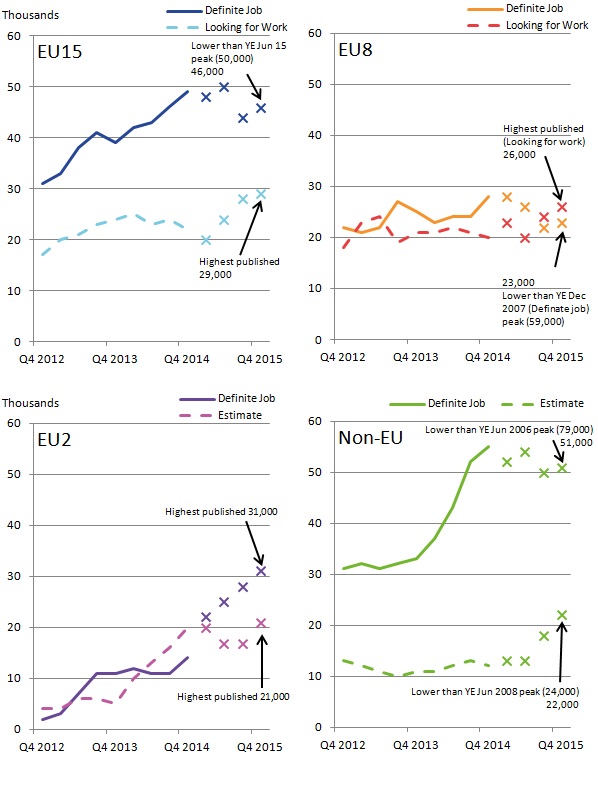
IPS estimates show approximately 57% (101,000) of all EU immigrants arriving for work-related reasons reported they had a definite job to go to (the rest, 77,000, were looking for work). The equivalent percentages for each EU citizenship group were EU15 (61%), EU2 (60%) and EU8 (46%). These proportions have changed over the last year, from 69%, 40% and 58% respectively.
This shows that for EU15 and EU8 a smaller proportion of those immigrating for work had a definite job to come to in YE December 2015 compared with the previous year. For EU2 citizens a much larger proportion of those immigrating for work had a definite job to come to in YE December 2015, a statistically significant increase from 14,000 to 31,000.
EU immigration for work began to increase following the EU Accession (enlargement) in 2004, from 65,000 in 2004, to 125,000 in 2007. There was a decline in EU immigration for work during 2008 and 2009, particularly among EU8 citizens. Up until 2012 it remained steady at around 90,000. Since then EU immigration for work has increased (Figure 8) particularly by EU2 and EU15 nationals, the former following the lifting of the transitional controls at the start of 2014, 7 years after their countries’ accession to the EU and the latter coinciding with the weak labour market conditions in some of the southern European EU15 member states.
Of the non-EU immigrants who arrived for work-related reasons, 51,000 (71%) had a job to go to. Of those non-EU immigrants arriving for work-related reasons, 28% were South Asian nationals. There was a statistically significant increase in the number of non-EU citizens looking for work, from 12,000 to 22,000.
Immigration for work - National Insurance number (NINo) allocations to adult overseas nationals
NINo and IPS estimates are not directly comparable with each other. NINo figures include short-term migrants and the figures are based on the recorded registration date on the National Insurance recording and Pay As You Earn system (NPS) (after the NINo application process has been completed) and so are not a direct measure of when a person migrated to the UK. More information on this is available in the MSQR Information for Users.
As such, there will be differences between the NINo registration data shown below, and the estimates of long-term international migration. A summary of the definitional differences between the 2 data sources was published in March 2016 and more detailed information on these differences is discussed in a publication on 12 May.
Figure 9 shows the rolling 12 month totals for NINo registrations to adult overseas nationals, split by EU and non-EU nationals. In YE March 2016, 826,000 overseas nationals registered for a NINo (an increase of 2,000 (0%) on the previous year) of which three-quarters were from within the EU. Of these, 219,000 were EU2 nationals, an increase of 26,000 (13%) on YE March 2015. Romanian citizens were allocated 179,000, and Bulgarian citizens 40,000.
Figure 9: National Insurance number allocations to adult overseas nationals entering the UK from the EU and Non-EU, YE June 2006 to YE March 2016
Source: Department for Work and Pensions, National Insurance number registrations to adult overseas nationals
Notes:
- The figures are based on recorded registration date on the National Insurance Recording and Pay As You Earn System (NPS), ie after the NINo application process has been completed, and are not a direct measure of when a person migrated to the UK
Download this chart Figure 9: National Insurance number allocations to adult overseas nationals entering the UK from the EU and Non-EU, YE June 2006 to YE March 2016
Image .csv .xlsAlthough figures do accurately reflect the number of NINos registered over time, a change to the process of recording NINos during the quarter April to June 2014, means that the volume of NINo registrations recorded were lower in that quarter and then higher in the subsequent quarter July to September 2014 than would otherwise be the case. Comparisons of NINo registrations over time between these periods should be viewed with caution.
For EU citizens the number of NINo registrations in YE March 2016 was 630,000, an increase of 1,000 (0% on the previous year) (see table 4). The sharp rise in registrations to EU2 nationals in 2014 mirrors the long-term migration trend over an extended period. However, in the last year, the growth in EU2 registrations has been offset by a similar fall in registrations from other EU member states. Within the last year, the total number of EU registrations (over a rolling 12 month period) has fallen in each quarter. In addition, over a third of the EU2 nationals registering for a NINo in the year from January 2014 had reported that they were already in the UK before transitional controls were lifted on 1 January 2014.
For non-EU citizens, the number of NINo registrations was 195,000, almost the same as the previous year. Table 5 shows the top registrations for individual EU and non-EU nationalities.
Table 4: National Insurance number registrations to adult overseas nationals entering the UK, YE March 2016
| United Kingdom | ||||
| thousands | ||||
| World area | Year to March 2015 total | Year to March 2016 total | Difference | % Change to previous year |
| Total | 824 | 826 | 2 | 0% |
| European Union | 629 | 630 | 1 | 0% |
| Non European Union | 193 | 195 | 2 | 1% |
| EU15 | 238 | 228 | -10 | -4% |
| EU8 | 195 | 180 | -15 | -8% |
| EU2 | 193 | 219 | 26 | 13% |
| Source: Department for Work and Pensions | ||||
| Notes: | ||||
| 1. The figures are based on recorded registration date on the National Insurance Recording and Pay as you Earn System, ie after the NINo application process has been completed and are not a direct measure of when a person migrated to the UK. | ||||
| 2.The number of new registrations of NINos to non-UK nationals over a given period is not the same as the total number of non-UK nationals who hold a NINo. | ||||
| 3.The total number of non-UK nationals who have been allocated a NINo is not the same as the number of non-UK nationals working in the UK. This is because people who have been allocated NINos may subsequently have left the UK, or they may still be in the UK but have ceased to be in employment. | ||||
| 4. Some people arriving into the UK may already hold a NINo from a previous stay in the UK. Once a person has been allocated a NINo, they do not need to reapply in order to work in the UK. | ||||
| 5. There are a small number of cases where the nationality of an individual is not recorded on the source system – therefore the sum of world areas may differ to total. | ||||
Download this table Table 4: National Insurance number registrations to adult overseas nationals entering the UK, YE March 2016
.xls (27.6 kB)
Table 5: Top 5 EU and non-EU nationalities for NINo registrations, YE March 2016.
| United Kingdom | |||
| EU nationality | NINo registrations | Non-EU nationality | NINo registrations |
| Romanian | 179,000 | Indian | 34,000 |
| Polish | 109,000 | Australian | 14,000 |
| Italian | 57,000 | Chinese | 13,000 |
| Spanish | 48,000 | Pakistani | 12,000 |
| Bulgarian | 40,000 | Nigerian | 10,000 |
| Source: Department for Work and Pensions | |||
Download this table Table 5: Top 5 EU and non-EU nationalities for NINo registrations, YE March 2016.
.xls (25.1 kB)Immigration for work - Labour market statistics
Labour market statistics are a measure of the stock of people working in the UK and are not designed to provide a measure of migration flows. As a result, changes in the labour market stock cannot be directly compared to long-term net migration changes. There have been increases of all nationality groupings in the UK labour force in January to March 2016, compared with the same quarter for the previous year (table 6).
Table 6: Change in labour market activity, January to March 2016
| United Kingdom | ||||
| thousands | ||||
| Nationality grouping | Total in employment, Jan to Mar 2015 | Total in employment, Jan to Mar 2016 | Difference | % Change to previous year |
| Total | 31082 | 31495 | 412 | 1.3% |
| British | 27967 | 28153 | 185 | 0.7% |
| Non-UK | 3109 | 3337 | 229 | 7.4% |
| Non-EU | 1187 | 1192 | 5 | 0.4% |
| EU | 1922 | 2146 | 224 | 11.7% |
| EU15 | 808 | 939 | 131 | 16.3% |
| EU8 | 931 | 962 | 32 | 3.4% |
| EU2 | 173 | 228 | 55 | 31.5% |
| Source: Office for National Statistics | ||||
| Notes: | ||||
| 1. Figures may not sum due to rounding. | ||||
Download this table Table 6: Change in labour market activity, January to March 2016
.xls (26.6 kB)The growth in overall employment over the last year was 412,000. Of this, 45% can be accounted for by a growth in employment for British nationals and 56% by the growth in employment among non-UK nationals, where nationality is known. (Percentages do not sum due to rounding and these estimates relate to the number of people in employment rather than the number of jobs and therefore show NET changes in the number of people in employment, not the proportion of new jobs that have been filled by UK and non-UK workers.)
Work-related visas (Non-EEA nationals)
In YE March 2016, the total number of work visas granted to non-EU national main applicants decreased by 1% to 121,639. Including dependants, there were 163,857 work visas granted in YE March 2016, down 4% (-7,167).
The number of skilled work visas granted rose 1,316 (+2%) to 54,961. The number of dependants of Tier 2 skilled workers granted a visa decreased by 6% to 36,872.
Table 7: Work related visa grants by category, YE March 2015 and YE March 2016
| United Kingdom | ||||
| Types of visa granted | YE Mar 2015 | YE Mar 2016 | Difference | % change to previous year |
| Total work-related visas granted | 171,024 | 163,857 | -7,167 | -4% |
| Tier 1 visas | 8,992 | 4,783 | -4,209 | -47% |
| Tier 2 (skilled) visas | 93,061 | 91,833 | -1,228 | -1% |
| Tier 5 (youth mobility and temporary) visas | 46,339 | 43,591 | -2,748 | -6% |
| Non-PBS/Other work visas | 22,632 | 23,650 | 1,018 | 4% |
| Source: Home Office | ||||
| Notes: | ||||
| 1. Figures include dependants. | ||||
Download this table Table 7: Work related visa grants by category, YE March 2015 and YE March 2016
.xls (27.1 kB)Indian nationals accounted for 57% of total skilled work visas granted (52,109 of 91,833), with USA nationals the next largest nationality group (9,981 or 11% of the total).
Trends in visa numbers reflect both changes to the immigration rules and the prevalent economic environment. There were falls in numbers of work-related visas granted following the introduction of the points-based system and the onset of the recession in 2008. More recently, the closure of the tier 1 general and tier 1 post-study categories to new applicants has led to further reductions in work visas (see Home Office Immigration Statistics release - Work topic).
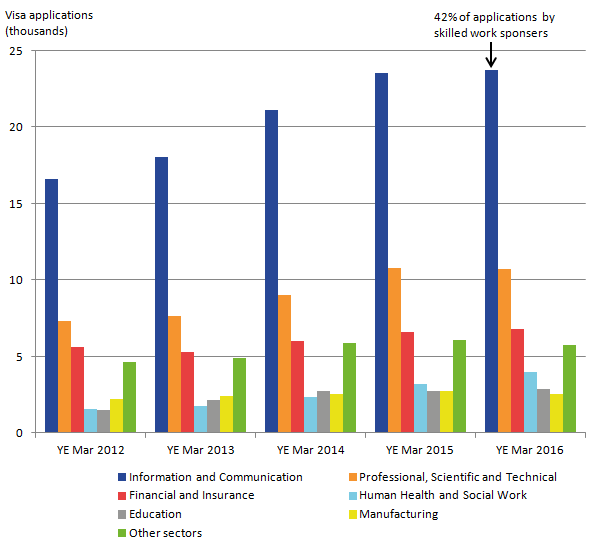
There was a 1% increase in sponsored visa applications for skilled work to 56,320 in YE March 2016 (main applicants). The Information and Communication sector accounted for 42% of applications by skilled work sponsors (Figure 10).
Figure 10: Skilled work visa applications by industry sector, UK, YE March 2012 to YE March 2016
Source: Home Office, Immigration Statistics January to March 2016
Notes:
- As part of the application process for visas, individuals must obtain a certificate of sponsorship from an employer. The data shown relate to the numbers of sponsoring documents used by main applicants applying for tier 2 (Skilled work) visas.
- European Economic Area (EEA) nationals do not require a visa to enter the UK.
Download this image Figure 10: Skilled work visa applications by industry sector, UK, YE March 2012 to YE March 2016
.png (12.6 kB) .xls (27.6 kB)
Immigration for study
Long-term immigration to the UK to study was estimated to be 167,000 in YE December 2015, compared with 191,000 in YE December 2014. This is the lowest it has been since YE Dec 2007. IPS estimates show 23% were EU citizens arriving to study and 72% were non-EU citizens. There was a statistically significant decline in the number of non-EU citizens migrating to the UK to study, from 134,000 in the previous year to 112,000. Of the 112,000, 71% were Asian citizens. Over the same period, there were 206,162 visas granted for the purposes of study, excluding the short-term student category (formerly known as “student visitors”), a fall of 5% compared with YE March 2015.
In YE March 2016, visa applications1 from non-EU nationals (main applicants only) to study fell by 6% to 222,609, largely driven by declines in the non-university sector. Non-EU applications to study at a UK university fell slightly (down 1%) to 166,357.
Table 8 shows the 5 largest student nationalities. More than one-third of non-EU study visas were granted to Chinese students.
Table 8: Top 5 nationalities for study, YE March 2016.
| United Kingdom | ||
| Nationality | Study visa granted | % of total |
| Total | 206,162 | 100% |
| China | 70,515 | 34% |
| United States | 13,970 | 7% |
| India | 10,705 | 5% |
| Malaysia | 9,563 | 5% |
| Hong Kong | 9,021 | 4% |
| Other non-EEA nationalities | 92,388 | 45% |
| Source: Home Office. | ||
Download this table Table 8: Top 5 nationalities for study, YE March 2016.
.xls (25.6 kB)The largest absolute increases in the number of study visas granted were to:
- Chinese (+6,038; +9%),
- Egyptian (+371; +29%); and
- Indonesian (+330; +14%) nationals
and the largest absolute decreases in the number of study visas granted were to:
- Iraqi (-2,241; -73%),
- Nigerian (-2,234; -20%); and
- Libyan (-2,195; -73%) nationals.
In YE March 2016, there were falls in visa applications to study for main applicants for:
- universities (to 164,123, -1%),
- the independent schools’ sector (to 13,591, -3%), and
- Further Education sector and other educational institutions (to 20,770, -16%).
Figure 11: Study-related sponsored visa applications by sector, UK, YE December 2010 to YE March 2016
Source: Home Office, Immigration Statistics January to March 2016
Notes:
- The numbers show the use of a Confirmation of Acceptance for Study (CAS) in a study visa application.
- Universities are “recognised bodies” (meaning that they have their own UK degree-awarding powers), or bodies in receipt of public funding as a Higher Education Institute (HEI).
Download this chart Figure 11: Study-related sponsored visa applications by sector, UK, YE December 2010 to YE March 2016
Image .csv .xls“Short-term students” (formerly “student visitors”) cannot normally stay for longer than 11 months (most are for the shorter 6 month visa) and are therefore not covered in detail in this report. There were 279,000 “short-term student” admissions in the calendar year 2014, a higher number than the number of “short-term student” visas granted over the same period (73,607) because not all nationalities require a visa to visit the UK for short periods of study. For example, the USA, Brazil and Japan accounted for 121,000, 19,100 and 17,200 respectively of the “short-term student” admissions to the UK in 2014, none of whom feature in the short-term student visa numbers.
For more information on immigration to the UK for study, see the Home Office topic report on study and the Home Office research report on student visitors.
Immigration for other reasons - accompanying or joining
The third most common reason for migrating to the UK is to accompany or join others. In YE December 2015, 12% (73,000) of long-term migrants arrived in the UK to accompany or join others (Figure 7), a decrease of 16,000. This category can include people who are arriving to marry a UK resident as well as people coming as a family member of another migrant coming for other reasons, such as to work2.
Home Office entry clearance visa statistics for non-EEA nationals show that 38,274 family route visas were granted in YE March 2016, an increase of 11% compared with YE March 2015 (34,592), although over half the level of the peak in YE March 2007 (72,894).
Further information on visas granted for family reasons has been published by the Home Office.
Immigration for other reasons - asylum applications
There were 41,563 asylum applications (including dependants) in YE March 2016, an increase of 30% compared with the previous year (32,036). This is the fifth successive year in which asylum applications have risen, although the number of applications is low relative to the peak in 2002 (103,081) and low compared to other European countries (the UK is receiving the ninth highest number of asylum seekers of the 28 EU member states).
Table 9 shows the 5 nationalities with the highest number of applications for asylum to the UK in 2015.
Table 9: Nationalities with highest number of asylum applications, UK, YE March 2016
| United Kingdom | ||||
| Nationality | Asylum applications | Change since last year | Proportion granted at initial decision | |
| Iran | 4,811 | +2,324 | 49% | |
| Pakistan | 3,511 | -1 | 17% | |
| Iraq | 3,374 | +2,367 | 16% | |
| Eritrea | 3,340 | -270 | 42% | |
| Afghanistan | 3,133 | +1,423 | 34% | |
| Source: Home Office. | ||||
| Notes: | ||||
| 1. These data include dependants | ||||
Download this table Table 9: Nationalities with highest number of asylum applications, UK, YE March 2016
.xls (26.1 kB)A total of 12,410 people were granted asylum or an alternative form of protection in YE March 2016. Grant rates for asylum, humanitarian protection, discretionary leave or other grants of stay vary considerably between nationalities. For example, 49% of the total initial decisions made for Iranians were grants of asylum or another form of protection, compared with 16% for Iraqi nationals.
For the first time since YE September 2012, Syrian is not one of the top 5 nationalities for asylum applications. There were 2,755 asylum applications from Syrian nationals (including dependants) in YE March 2016, an increase of 10% compared with the previous year (2,496).
There were 2,235 grants of asylum or an alternative form of protection (including dependants) to those giving Syrian as their nationality in YE March 2016, with a grant rate of 88%. In addition, 1,667 people were granted humanitarian protection under the Syrian Vulnerable Persons Resettlement Scheme (1,854 since the scheme began). On 7 September 2015 the Prime Minister announced an expansion to the existing Syrian Vulnerable Persons Resettlement Scheme. It is expected that 20,000 Syrians in need of protection will be resettled in the UK by 2020. In total, 2,441 people in need of protection were resettled in the UK in YE March 2016.
Settlement in the UK
The number of people granted permission to stay permanently in the UK fell by 26% to 78,334 in YE March 2016. The number of grants is low relative to the peak number of grants in YE September 2010 (241,586). The decrease in the latest 12 months was driven by falls in family-related grants (-21,217). This may partly reflect changes to the rules in July 2012 on how quickly partners qualify for settlement and the number of visas and extensions granted in previous years.
In February 2016 the Home Office published its “Migrant journey: sixth report”, which shows how non-EEA migrants change their immigration status, and the immigration routes used prior to achieving settlement in the UK.
In May 2016 the Home Office published an update to the article “Extensions of stay by previous category”. Looking at extensions data by individuals’ previous category, 7,226 former students were granted extensions for work in 2015 (main applicants).
Notes for Immigration to the UK
There are a range of reasons why LTIM and IPS figures for long-term migrants for study may be different from Home Office figures for study visas granted. For example, the Home Office visa statistics include short-term students migrating to the UK for less than 1 year, but only record students from outside the EU.
Much more detail can be found in the Home Office Immigration Statistics User Guide.
5. Emigration from the UK
The latest emigration estimate for the year ending (YE) December 2015 was 297,000 with a confidence interval of +/-20,000, a decrease from 319,000 (+/-22,000) in YE December 2014 (not statistically significant).
(From here on, any reference to change, such as increase or decrease, refers to YE December 2015 compared with YE December 2014. All estimates quoted within this section are Long-Term International Migration (LTIM) based estimates, and comparisons are not statistically significant, unless otherwise stated.)
Recent levels of emigration have remained stable and well below the high of 427,000 in 2008. The latest data show a reduction in emigration from the previous year of 22,000.
In YE December 2015, work-related reasons remain the main reason given for emigration, accounting for 164,000 (55%) of emigrants, a reduction from 178,000 the previous year.
Figure 12: Emigration from the UK by citizenship, 2006 to 2015 (YE December 2015)
Source: Office for National Statistics, Long-Term International Migration
Notes:
- Figures for 2015 are provisional. In this chart provisional estimates are represented by a cross.
- This chart is not consistent with the total revised net migration estimates as shown in Figures 1 and 2. Please see guidance note for further information.
Download this image Figure 12: Emigration from the UK by citizenship, 2006 to 2015 (YE December 2015)
.png (19.3 kB) .xls (23.0 kB)
British citizens
In YE December 2015, 123,000 British citizens emigrated from the UK, a decrease of 14,000 compared with the previous year. This decrease in British emigration has driven the overall decrease in emigration and the change in net migration.
British citizens account for 41% of emigration. Emigration of British citizens has remained at a similar level since 2009, having fallen from the peak of 207,000 in 2006 (Figure 12).
IPS data show reasons for emigration for British citizens were:
- work-related reasons (56,000)
- accompanying/joining others (15,000)
- formal study (8,000)
- “other” or “not stated” (34,000)
Data for 2014 show that the top 5 most common countries for British citizens to emigrate to were;
- Australia
- France
- USA
- United Arab Emirates
- Canada
EU citizens
The latest estimates show that emigration among the various EU citizenship groups has remained stable over the last few years. The estimated number of EU citizens emigrating from the UK was 85,000 in YE December 2015, similar to the estimated number of EU citizens who emigrated in YE December 2014 (89,000).
Just under half of non-British emigration was accounted for by EU citizens; 53% of EU emigrants left for work-related reasons. Of the 30,000 emigrants who, in the IPS, stated their main reason for migration as “going home to live”, almost three-quarters (22,000) were EU citizens.
Non-EU citizens
The latest estimates show 89,000 non-EU citizens emigrated (compared with 93,000 in the previous year). This comprises a reduction in emigration of Asian citizens, and an increase in emigration of citizens of the rest of the world.
Of the non-EU emigrants, 58% were of Asian citizenship.
71% of non-EU emigrants were emigrating for work-related reasons.
Emigrating from the UK by previous main reason for immigration
In 2012, a new question was added to the IPS asking current emigrants who had previously immigrated to the UK about their main reason for originally coming to the UK. Of the 277,000 individuals shown in IPS data to be emigrating from the UK, 84,000 were “new” long-term emigrants (individuals who had not previously lived away from the UK for 12 months or more) and 194,000 were long-term emigrants who had formerly immigrated to the UK.
For further estimates related to this IPS question, please see Tables 4a and Table 4b in the accompanying provisional tables for this MSQR release.
“International Student Migration – what do the statistics tell us” explores the reasons for the apparent gap between student immigrants and emigrants who previously arrived to study. It also compares emigration of migrants to study and emigration of former students.
Back to table of contents6. About MSQR
If you are new to migration statistics, you might find it helpful to read our “International Migration Statistics First Time User Guide”.
The MSQR is a summary of the latest quarterly release of official international migration statistics. This edition covers those released on 26 May 2016 and includes links to other migration products released on that date. The latest ONS estimates refer to YE December 2015, though other estimates’ periods may differ as stated.
There is a lot more information within the charts and tables found in the accompanying download of provisional data tables alongside this report. Users are encouraged to view these data themselves for more detail around the estimates presented in this document.
For further information on how our migration statistics are used, along with information on their fitness for purpose including strengths and limitations, please see the “Quality and Methodology Information for Long-Term International Migration (LTIM) releases” and the “accuracy of migration estimates” section.
If you would like to subscribe to our newsletter, please send an email to population.statistics@ons.gov.uk with the subject title “Subscribe to ONS Population Statistics Newsletter”.
You can also follow our statistician @PaulVickers_ONS on twitter for the latest Population Statistics news and updates, and to join in the conversation.
Back to table of contents7. Accuracy of migration estimates
Surveys gather information from a sample of people from a population. In the case of the IPS, the population is passengers travelling through the main entry and exit points from the UK including airports, seaports and the Channel Tunnel. The estimates produced are based on only one of a number of possible samples that could have been drawn at a given point in time. Each of these possible samples would produce an estimated number of migrants. These may be different to the true value that would have been obtained if it were possible to ask everyone passing through about their migration intentions. This is known as sampling variability.
The published estimate is based upon the single sample that was taken and is the best estimate of the true value based on the data collected. However, to account for sampling variability, the estimates are published alongside a 95% confidence interval.
The confidence interval is a measure of the uncertainty around the estimate. Confidence intervals become larger for more detailed estimates (such as citizenship by reason for migrating). This is because the number of people in the sample who have these specific characteristics (for example, EU8 citizens arriving to study in the UK) is smaller than the number of people sampled within a category at a higher level (such as the total number of EU citizens arriving to study in the UK). The larger the confidence interval is, the less precise the estimate. Therefore users of migration statistics are advised to use the highest level breakdown of data where possible.
A 95% confidence interval is used, which is a widely accepted level, meaning that over many repeats of the sample under the same conditions, we would expect the confidence interval to contain the true value 95 times out of 100. Equivalently, we can say that there would be a 1 in 20 chance that the true value would lie outside of the range of the 95% confidence interval.
Estimates from the IPS may change from one period to the next simply due to sampling variability. In other words, the change may be due to which individuals were selected to answer the survey, and may not represent any real-world change in migration patterns.
Statistical tests can be used to determine whether any increases or decreases that we see in the estimates from the IPS could be due to chance, or whether they are likely to represent a real change in migration patterns. If the tests show that the changes are unlikely to have occurred through chance alone, and are likely to reflect a real change, then the change is described as being statistically significant. The usual standard is to carry out these tests at the 5% level of statistical significance. This means that in 1 out of 20 differences identified as statistically significant, it is not possible to assert that the difference is the result of a real change.
For information on the accuracy of these statistics, the difference between provisional and final figures and guidance on comparing different data sources, please see the “MSQR Information for Users”.
Revisions to net migration estimates in light of the 2011 Census
In April 2014, we published a report examining the quality of international migration statistics between 2001 and 2011, using the results of the 2011 Census. A main finding of the report was that, over the 10 year period, annual net migration estimates were a total of 346,000 lower than total net migration implied by the 2011 Census. However, the report also showed that the quality of international migration estimates improved following changes made to the IPS in 2009.
Within the report, we published a revised series of net migration estimates for the UK. Published tables have been updated on our website to include the revised estimates. The report, a summary and guidance on how to use these revised figures are available on our website.
Users should be aware that no revisions were made to separate immigration and emigration estimates at the time the net migration estimates were revised – ONS analysis of the differences between the Census and population estimates suggest immigration figures could have been higher in the mid-2000s as a result of migration from Eastern Europe.
Back to table of contents8. List of products
The following are URL links to the products underlying this report, or otherwise associated with the co-ordinated migration release of 26 May 2016. The department releasing each product is indicated.
Annual releases:
Short-Term International Migration Annual Report (ONS) – a report and tables detailing estimates of short-term migration to and from the UK for England and Wales for the year ending mid-2014. The product is updated as of 26 May 2016.
Final Long-Term International Migration (2014) (ONS) – this product is updated as of 26 November 2015.
Local Area Migration Indicators Suite (ONS) – this is an interactive product bringing together different migration-related data sources to allow users to compare indicators of migration at local authority level. This product is updated as of 27 August 2015.
Population by Country of Birth and Nationality (ONS) – this short report focuses on changes in the UK resident population by country of birth and nationality for YE December 2014. This product is updated as of 27 August 2015.
Methodology of migration statistics:
Overview of population statistics (ONS) – this describes different aspects of population we measure and why. Information on how these are measured, and the statistics themselves, can be found via the links provided within the document.
The MSQR User Information (ONS) – guidance on interpreting confidence intervals, the difference between provisional and final estimates, and the comparability and quality of input data sources.
International Migration Statistics First Time User Guide (ONS) – an introduction to the main concepts underpinning migration statistics including basic information on definitions, methodology, use of confidence intervals and information on the range of available statistics related to migration.
Long-Term International Migration – Frequently Asked Questions and Background Notes (ONS) – information on recent trends in migration, methods and coverage, comparisons with international migration estimates, a complete list of definitions and terms and a guide to the published tables.
Quality and Methodology Information for International Migration (ONS) – information on the usability and fitness for purpose of long-term international migration estimates.
Long-Term International Migration Estimates Methodology (ONS) – a detailed methodology document for LTIM estimates, including information on current methodology and assumptions, data sources including the International Passenger Survey and changes to the methodology since 1991.
International Passenger Survey: Quality Information in Relation to Migration Flows (ONS) – an overview of the quality and reliability of the International Passenger Survey (IPS) in relation to producing Long-Term International Migration estimates.
Revised estimates (2001 to 2011):
Quality of Long-Term International Migration Estimates from 2001 to 2011 (ONS)
Guidance on revised net migration statistics (ONS) – information for users on how to interpret the revised net migration estimates for 2001 to 2011 alongside published LTIM estimates.
Interactive products:
International Migration Timeline (ONS) – for 1964 to 2014.
What are migration levels like in your area? – includes a quiz.
Research papers:
Note on the difference between National Insurance number registrations and the estimate of long-term international migration: 2016 (ONS) - in depth research into the differences between NINos and the IPS.
Sources of Migration Statistics (ONS) - summary of the differences between NINos and the IPS.
A Comparison of International Estimates of Long-Term Migration (ONS)
Population by country of birth and nationality, reweighted data for calendar year 2004 to 2013 (ONS) – publication of revised datasets following the reweighting of the Annual Population Survey in light of results of the 2011 Census. The product was published in July 2015 as a one-off publication.
Seasonal Patterns of Long-Term International Migration
Report on the history of immigration to the UK based on the 2011 Census – published in December 2013, in collaboration with the Home Office, which provides further analysis on the drivers of historical migration to the UK.
Home Office Research Report 68 (November 2012) - presents information from academic research and surveys drawn together to present the main aspects of long-term emigration from the UK. This includes recent outward migration and some trends over the last 20 years, separately for British, EU and non-EU citizens.
The reason for migration and labour market characteristics of UK residents born abroad (September 2014) - uses data from the Labour Force Survey to provide estimates of the stock of residents born abroad by the reason for original migration. This report revealed that the distribution of original reasons given by non UK-born residents of the UK was very different from that produced when looking at the migration flows reported in the IPS.
‘Migrant journey sixth report’ statistics – Home Office research which provides evidence on the behaviour of migrants entering the UK immigration system for the 5 main routes of entry to the UK and the common pathways through the immigration system that result in settlement.
International student migration – what do the statistics tell us - provides information on the differences between various migration data sources.
Releases on 26 May 2016:
- Provisional Long-Term International Migration, Year Ending December 2015 (ONS)
- Short-Term International Migration, mid-2014 (ONS)
- Immigration Statistics January to March 2016 (Home Office)
- National Insurance number (NINo) Allocations to Adult Overseas Nationals to March 2016 (DWP)
Annual releases on 26 November 2015:
Useful links to other departments:
Labour Market Statistics - May 2016 (ONS) - this includes estimates of the number of people in employment in the UK by country of birth and nationality.
Immigration Statistics User Guide (Home Office)
Back to table of contents9. Glossary
Annual Population Survey
The Annual Population Survey (APS) is a continuous household survey, covering the UK, with the aim of providing estimates between censuses of main social and labour market variables at a local area level. The APS is not a stand-alone survey, but uses data combined from 2 waves from the main Labour Force Survey (LFS) with data collected on a local sample boost. Apart from employment and unemployment, the topics covered in the survey include housing, ethnicity, religion, health and education.
British citizenship
The countries for which the migrant is a British passport holder can include the United Kingdom and the crown dependencies of Jersey, Guernsey and the Isle of Man.
Citizenship
This is the term used in the International Passenger Survey (IPS) to define the country for which a migrant is a passport holder. This refers specifically to the passport being used to enter or leave the UK at the time of interview. It does not refer to any other passport(s) which migrants of multiple nationality may hold. More generally a British citizen as described in IPS statistics includes those with UK nationality usually through a connection with the UK: birth, adoption, descent, registration, or naturalisation. British nationals have the right of abode in the UK.
Commonwealth (ONS statistical grouping)
The Commonwealth statistical grouping consists of countries of the old Commonwealth and the new Commonwealth (see below).
Confidence interval
This is the range within which the true value of a population parameter lies with known probability. For example the 95% confidence interval represents the range in which, over many repeats of the sample under the same conditions, we would expect the confidence interval to contain the true value 95 times out of 100. Equivalently, we can say that there would be a 1 in 20 chance that the true value would lie outside of the range of the 95% confidence interval. The uppermost and lowermost values of the confidence interval are termed “confidence limits”.
European Economic Area (EEA)
The EEA consists of the 28 countries of the EU (see below), plus Iceland, Liechtenstein and Norway. Swiss nationals are treated as EEA nationals for immigration purposes; however for statistical purposes Switzerland is not included in EEA estimates by ONS.
European Union (EU)
The EU consists of 28 countries: Austria, Belgium, Bulgaria, Croatia, Cyprus, Czech Republic, Denmark, Estonia, Finland, France, Germany, Greece, Hungary, Italy, Latvia, Lithuania, Luxembourg, Malta, Netherlands, Poland, Portugal, Republic of Ireland, Romania, Slovakia, Slovenia, Spain, Sweden and the United Kingdom. Croatia joined the EU in July 2013 – data with a reference period after that date will include Croatia within the EU grouping. Estimates for the EU quoted in this bulletin and accompanying tables exclude British citizens, who are reported as a separate group.
European Union (EU) Accession Countries
The accession countries are those that joined the EU in 2004 or later. A total of 10 joined in 2004 (the EU8, plus Cyprus and Malta), 2 joined in 2007 (the EU2) and Croatia joined in 2013.
EU2
The EU2 (formerly known as the A2) are the 2 countries that joined the EU on 1 January 2007: Bulgaria and Romania. Between 2007 and 2013, EU2 nationals had certain restrictions placed on them; in the first 12 months of stay, working Bulgarian and Romanian nationals were generally required to hold an accession worker card or apply for 1 of 2 lower-skilled quota schemes. Other Bulgarian and Romanian nationals could apply for a registration certificate, giving proof of a right to live in the UK. These restrictions were lifted on 1 January 2014.
EU8
The EU8 (formerly known as the A8) are the 8 central and eastern European countries that joined the EU on 1 May 2004: Czech Republic, Estonia, Hungary, Latvia, Lithuania, Poland, Slovakia and Slovenia. The EU8 does not include the 2 other countries that joined on that date: Cyprus and Malta. EU8 nationals previously had restrictions on their rights to work and were required to register under the worker registration scheme, but these restrictions were lifted from 1 May 2011.
EU15
The EU15 consists of Austria, Belgium, Denmark, Finland, France, Germany, Greece, Italy, Luxembourg, Netherlands, Portugal, Republic of Ireland, Spain, Sweden and the United Kingdom. However, EU15 statistics exclude British citizens.
EU Other
The EU Other includes Malta and Cyprus which joined the EU in 2004, and Croatia which joined in 2013.
International Passenger Survey (IPS)
The International Passenger Survey (IPS) is a survey of a random sample of passengers entering and leaving the UK by air, sea or the Channel Tunnel. Between 700,000 and 800,000 people are interviewed on the IPS each year. Of those interviewed, approximately 4,000 people each year are identified as long-term international migrants.
Long-Term International Migration (LTIM)
Long-Term International Migration (LTIM) estimates are produced by combining migration data from the IPS, Home Office data on asylum seekers (including non-asylum enforced removals adjustment), migration to and from Northern Ireland (from the Northern Ireland Statistics and Research Agency) and adjustments for visitor switchers and migrant switchers.
Migrant
ONS uses the UN recommended definition of a long-term international migrant: “A person who moves to a country other than that of his or her usual residence for a period of at least a year (12 months), so that the country of destination effectively becomes his or her new country of usual residence.”
This is the definition used to calculate net migration, and is also used for the UK usually resident population estimate series. This definition does not necessarily coincide with those used by other organisations.
National Insurance number (NINo)
National Insurance numbers are issued to non-UK nationals immigrating for work. The number of NINos will include people who are coming to the UK for short periods or temporary purposes, as well as long-term migrants. The figures are based on recorded registration date on the national insurance recording and pay as you earn system (NPS), i.e. after the NINo application process has been completed, and so are not a direct measure of when a person migrated to the UK.
Nationality
Nationality is often used interchangeably with citizenship, and some datasets refer to “nationals” of a country rather than “citizens”. Different datasets have different ways of establishing someone’s nationality. The APS, which underlies the population estimates by nationality, simply asks people “what is your nationality”. However, the IPS, NINo and entry clearance visa data are based on people’s passports. For asylum statistics the nationality is as stated on the “Case Information Database”. This will usually be based on documentary evidence, but sometimes asylum seekers arrive in the UK without any such documentation.
New Commonwealth (ONS Statistical Grouping)
The new Commonwealth statistical grouping consists of African Commonwealth countries (Botswana, Cameroon, The Gambia, Ghana, Kenya, Lesotho, Malawi, Mauritius, Mozambique, Namibia, Nigeria, Seychelles, Sierra Leone, Swaziland, Tanzania, Uganda, Zambia and Zimbabwe), Indian subcontinent countries (Bangladesh, India, Pakistan and Sri Lanka), and other Commonwealth countries in the Asian, Caribbean, and Oceanian regions.
It also includes British Overseas Territories. Up to and including 2003, Malta and Cyprus are included in the new Commonwealth grouping. From 2004, the year of accession, they are included in the EU. Malta and Cyprus are members of both the Commonwealth and the EU from May 2004 onwards. However, for estimation purposes they have only been included in the EU grouping for 2004 onwards.
Rwanda was admitted to the Commonwealth in November 2009, but the definition for this statistical grouping has remained unchanged. Zimbabwe and The Gambia withdrew from the Commonwealth in 2003 and 2013 respectively, but again the definition for this grouping has remained unchanged.
New country groupings
We introduced new country groupings in 2014. These are available for both LTIM and IPS estimates. A listing of which countries are in each of the old and new groups is available.
Old Commonwealth (ONS Statistical Grouping)
The old Commonwealth statistical grouping consists of 4 countries: Australia, Canada, New Zealand and South Africa.
Points Based System (PBS)
The PBS is a rationalisation of immigration control processes for people coming into the UK for the purposes of work or study who are not EEA or Swiss nationals. Entries are classed into 5 tiers. Tier 1 is for high value individuals such as investors and entrepreneurs. Tier 2 is for skilled workers with a job offer. Tier 3 is low skilled workers – this entry route was never opened and is currently suspended. Tier 4 is for students and tier 5 is for youth mobility and temporary workers.
Short-term student category (formerly known as ‘student visitors’)
The short-term student category (formerly known as ‘student visitors’) provides for those people who wish to come to the UK as a visitor and undertake a short period of study which will be completed within the period of their leave (maximum 6 months unless applying under the concession for English language courses – 11 months). Short-term students (that is those studying on courses of 6 months’ duration or less) who do not intend to work part-time or undertake a paid or unpaid work placement as part of their course can also apply within this category.
Statistical significance
The International Passenger Survey interviews a sample of passengers passing through ports within the UK. As with all sample surveys, the estimates produced from them are based upon one of a number of different samples that could have been drawn at that point in time. This means that there is a degree of variability around the estimates produced. This variability sometimes may present misleading changes in figures as a result of the random selection of those included in the sample. If a change or a difference between estimates is described as “statistically significant”, it means that statistical tests have been carried out to reject the possibility that the change has occurred by chance. Therefore statistically significant changes are very likely to reflect real changes in migration patterns.
Study
Estimates for study refer only to migrants arriving to or leaving the UK for formal study.
Back to table of contents