Table of contents
- Main points
- Introduction
- Financial assets
- Household gross financial wealth
- Financial liabilities
- Household net financial wealth
- Household net financial wealth by main household characteristics
- Household net financial wealth by individual characteristics
- Quality assuring financial wealth data
- Background notes
1. Main points
Aggregate net financial wealth for all private households in Great Britain was £1.6 trillion in the period July 2012 to June 2014. This was a 22% increase over the same figure for July 2010 to June 2012. This was driven mainly by an increase in the value of financial assets as opposed to a decrease in financial liabilities
In July 2012 to June 2014, half of all households had net financial wealth of £5,900 or more
In the period July 2012 to June 2014, 23% of households had negative net financial wealth, down 2 percentage points from the July 2010 to June 2012 level
Over one third of children aged under 16 lived in households with negative net financial wealth in the period July 2012 to June 2014
Households in the South West saw the largest percentage rise in median net financial wealth of 29% to £11,700 in July 2012 to June 2014 compared to July 2010 to June 2012. Yorkshire and The Humber saw the largest fall (24%) in the median value of net financial wealth over the same period (falling from £5,100 to £3,900)
2. Introduction
This chapter looks at estimates of household financial wealth from the Wealth and Assets Survey (WAS). Financial wealth comprises: formal financial assets (such as bank accounts, savings accounts, stocks and shares); informal financial assets (such as money saved at home); assets held by children in the household; and liabilities (such as formal borrowing, overdrafts and arrears on household bills). The gross value of financial assets is considered first, followed by the value of liabilities. These are then combined to produce estimates of net financial wealth (gross assets minus liabilities). The measure of financial wealth is based on the personal, private wealth of households. This means that it does not include business assets owned by household members.
Much of the analysis in this chapter is presented at the household level. This means that all assets held by individuals living within households have been added together to produce household totals. In some cases the household totals represent only one account or holding, whereas in others they represent multiple accounts held by one or more than one individual.
Some individual-level analyses are presented towards the end of the chapter, considering the distribution of individuals by age, education level, economic activity and socio-economic classification across the net financial wealth bands of the household they live in.
All estimates are presented as current values (i.e. the value at time of interview) and have not been adjusted for inflation.
Due to the complexity of the data, for example, the use of imputed values and complex weighting, only a very limited amount of high level significance testing has been undertaken, which is presented in the Technical chapter of this report. None of the estimates commented on in this chapter have been tested for significance.
Back to table of contents3. Financial assets
Financial assets are classified as either ‘formal financial assets’: recognised products designed for individuals to hold, save or invest their monies; or ‘informal financial assets’: money saved in cash at home, money lent to others or money paid into a savings and loan club.
For most formal financial asset products, having the product would imply a positive financial asset. However, there are some products which, although ‘open’ allow an individual to have little or no money in them, or indeed in the case of current accounts in debit (overdrafts) the product would actually be a financial liability rather than a financial asset.
Formal financial assets
Table 5.1 shows the percentage of households with different types of formal financial asset products across all 4 periods of the survey. Very little change is seen in any of the figures between the latest 2 sets of results, July 2010 to June 2012 and July 2012 to June 2014.
For the period July 2012 to June 2014, an estimated 98% of households had some type of formal financial asset product. Where all current accounts are excluded, almost three-quarters (74%) of all households report ownership of a formal financial asset.
The most common formal financial asset held by households was a current account; 96% of households held one or more in the period July 2012 to June 2014. A current account is an account used for day-to-day transactions. There is immediate access to the money – usually by a card for cash machine withdrawal and/or a cheque book. Current accounts also provide other benefits to the holder including a direct debit facility – the preferred payment method for utilities in particular.
Savings are money which is set aside, away from regular spending, with the intention that it will be available at a later date. Savings accounts remain the most common formal financial asset which households use to save money, with individual(s) in 57% of households having some form of savings account. The money deposited can always be returned in full to the saver, usually with interest, although, unlike current accounts, account holders may be required to give notice to withdraw their savings.
Nearly half of all households (48%) had an Individual Savings Account (ISA) during the period July 2012 to June 2014. Income from ISAs is tax-free and there are annual ceilings on the amount that can be invested.
National Savings certificates and bonds (including premium bonds) were owned by 23% of households in the period July 2012 to June 2014. Premium bonds are unique financial assets – instead of earning interest, the bonds go into a monthly draw for tax-free prizes.
Table 5.1: Percentage of households with formal financial assets
| Great Britain | ||||
| % | ||||
| July 2012 to June 2014 | July 2010 to June 2012 | July 2008 to June 2010 | July 2006 to June 2008 | |
| All current accounts1 | 96 | 96 | 96 | 95 |
| Current accounts in credit | 91 | 90 | 90 | 85 |
| Savings accounts | 57 | 58 | 68 | 62 |
| ISAs2 | 48 | 48 | 49 | 42 |
| National Savings certificates and bonds3 | 23 | 22 | 28 | 24 |
| UK shares | 12 | 12 | 16 | 15 |
| Insurance products4 | 6 | 7 | 10 | 10 |
| Fixed term bonds | 10 | 11 | 12 | 8 |
| Employee shares and share options | 7 | 6 | 8 | 7 |
| Unit/Investment trusts | 5 | 5 | 6 | 6 |
| Overseas shares | 2 | 2 | 2 | 2 |
| UK bonds/gilts | 1 | 1 | 1 | 1 |
| Any formal financial asset including current accounts in credit5,6 | 98 | 98 | 98 | 98 |
| Any formal financial asset excluding all current accounts | 74 | 74 | 80 | 75 |
| Source: Wealth and Assets Survey, Office for National Statistics | ||||
| Notes: | ||||
| 1. Includes households with current accounts in credit, with zero balance, or in debit (overdraft). | ||||
| 2. Individual Savings Account, including Personal Equity Plans (PEPs) - During the period July 2006 to June 2008, PEPs were separately identified, but in April 2008, PEPs were regulated as ISAs. Therefore during the periods July 2008 to June 2010 and July 2010 to June 2012, they are included as ISAs. | ||||
| 3. Including Premium Bonds. | ||||
| 4. Includes Life insurance, Friendly Society or endowment policies (excluding endowments linked to the mortgage on this property). Excluding term insurance policies i.e. life insurance policies which only have a value if you die in the period of the insurance. | ||||
| 5. Includes a small number of households with overseas bonds/gilts. | ||||
| 6. Excludes current accounts with zero balance or in debit (overdraft). | ||||
Download this table Table 5.1: Percentage of households with formal financial assets
.xls (56.8 kB)Table 5.2 presents the median amounts held in the different formal financial asset products identified in the survey. For all types of formal financial assets there has been an increase in the median value since the period July 2010 to June 2012, apart from insurance products which has remained the same. The figures quoted exclude households without each type of asset.
In the period July 2012 to June 2014, half of all households with current accounts in credit had £1,400 or more in their accounts. The assets with the largest median value for this period were fixed term bonds and unit/investment trusts both with a value of £25,000, though were only owned by 10% and 5% of households respectively (Table 5.1). The asset with the lowest median value was for national saving certificates and bonds at £900 (owned by 23% of households) but this had increased from £600 in the period July 2010 to June 2012.
The asset with the largest median increase between July 2010 to June 2012 and July 2012 to June 2014 was unit/investment trusts rising by £5,000 (from £20,000 to £25,000). The asset showing the largest percentage increase in median value over the two periods was overseas shares, with an increase of 67% (from £3,000 to £5,000). These were owned by just 2% of households.
Looking at the collective amount held in all formal financial asset products (i.e. including current accounts in credit), half of all households holding formal financial assets valued these at £8,900 or more during the period of July 2012 to June 2014, compared with £8,100 for the period July 2010 to June 2012. Half of all households holding one or more formal assets other than a current account valued these assets at £13,700 or more in the periods July 2012 to June 2014 compared to £12,600 in July 2010 to June 2012.
Table 5.2: Median value of formal financial assets
| Great Britain | ||||
| £ | ||||
| July 2012 to June 2014 | July 2010 to June 2012 | July 2008 to June 2010 | July 2006 to June 2008 | |
| All current accounts2 | 1,200 | 1,000 | 900 | 800 |
| Current accounts in credit | 1,400 | 1,200 | 1,000 | 1,000 |
| Savings accounts | 4,200 | 4,000 | 3,000 | 3,500 |
| ISAs3 | 10,000 | 9,000 | 7,000 | 7,000 |
| National Savings certificates and bonds4 | 900 | 600 | 300 | 300 |
| UK shares | 4,800 | 4,000 | 2,000 | 4,000 |
| Insurance products5 | 20,000 | 20,000 | 17,500 | 15,000 |
| Fixed term bonds | 25,000 | 20,400 | 20,000 | 17,000 |
| Employee shares and share options | 5,000 | 3,600 | 3,000 | 4,000 |
| Unit/Investment trusts | 25,000 | 20,000 | 14,000 | 15,000 |
| Overseas shares | 5,000 | 3,000 | 2,000 | 3,000 |
| UK bonds/gilts | 20,000 | 17,000 | 11,500 | 15,000 |
| Any formal financial asset including current accounts in credit6,7 | 8,900 | 8,100 | 7,900 | 7,000 |
| Any formal financial asset excluding all current accounts | 13,700 | 12,600 | 10,300 | 10,200 |
| Source: Wealth and Assets Survey, Office for National Statistics | ||||
| Notes: | ||||
| 1. Results exclude households without each type of asset. | ||||
| 2. Includes households with current accounts in credit, with zero balance, or in debit (overdraft). | ||||
| 3. Individual Savings Accounts; note that households may have both cash ISAs and stocks and shares ISAs, so total is not the sum of cash plus stocks and shares ISAs. | ||||
| 4. Including Premium Bonds. | ||||
| 5. Includes Life insurance, Friendly Society or endowment policies (excluding endowments linked to the mortgage on this property). Excluding term insurance policies i.e. life insurance policies which only have a value if you die in the period of the insurance. | ||||
| 6. Personal Equity Plans - During the period July 2006 to June 2008, PEPs were reported separately, however during July 2008 to June 2010 and July 2010 to June 2012, they were reported under ISAs. | ||||
| 7. Excludes current accounts with zero balance or in debit (overdraft). | ||||
Download this table Table 5.2: Median value of formal financial assets
.xls (57.3 kB)Informal financial assets
Informal saving comprises money saved in cash at home, money given to someone to look after or money paid into a savings and loan club. The percentage of households who held informal financial assets of some kind during July 2012 to June 2014 with a value over £250 was 8%. This has fallen by 2 percentage points since the previous period of the survey (July 2010 to June 2012).
The survey asked only about informal saving and lending for amounts in excess of £250. This £250 minimum amount adopted by the survey means that it might have underestimated the true percentages of households with informal saving and lending in Great Britain. Previous research1 has shown that small amounts of informal savings are common in low-income households, and is often the only type of saving that such households engage in.
Table 5.3: Percentage of households with informal financial assets
| Great Britain | ||||
| % | ||||
| July 2012 to June 2014 | July 2010 to June 2012 | July 2008 to June 2010 | July 2006 to June 2008 | |
| Amounts saved informally | 5 | 6 | 6 | 6 |
| Amounts lent to others informally | 4 | 4 | 5 | 4 |
| Households with any informal financial assets | 8 | 10 | 10 | 10 |
| Source: Wealth and Assets Survey, Office for National Statistics | ||||
| Notes: | ||||
| 1. Excludes small values (less than £250). | ||||
Download this table Table 5.3: Percentage of households with informal financial assets
.xls (54.8 kB)Table 5.4 shows the median value held in different types of informal financial asset product.
Half of all households who held informal financial assets valued these at £800 or more during the period July 2012 to June 2014, no change from the previous period of the survey. The median value for amounts saved informally dropped from £400 to £300 over the same period. The median value for amounts lent to others informally increased from £2,500 to £3,000.
Table 5.4: Median value of informal financial assets
| Great Britain | ||||
| £ | ||||
| July 2012 to June 2014 | July 2010 to June 2012 | July 2008 to June 2010 | July 2006 to June 2008 | |
| Amounts saved informally | 300 | 400 | 400 | 500 |
| Amounts lent to others informally | 3,000 | 2,500 | 1,900 | 1,800 |
| Households with any formal financial assets | 800 | 800 | 700 | 700 |
| Source: Wealth and Assets Survey, Office for National Statistics | ||||
| Notes: | ||||
| 1. Results exclude households without each type of asset. | ||||
| 2. Excludes small values (less than £250). | ||||
Download this table Table 5.4: Median value of informal financial assets
.xls (54.8 kB)Children’s financial assets
The survey also enquired about children’s assets, including the Child Trust Fund (CTF). A Child Trust Fund (CTF) is a long-term tax-free savings and investment account for children in the United Kingdom. New accounts cannot be created but money can still be deposited into existing accounts. On 1 November 2011, Junior Individual Savings Accounts (Junior ISAs) were introduced as a replacement.
Child Trust Funds (CTFs)
In general, all children born between 1 September 2002 and 2 January 2011 were eligible for a CTF if their parent or guardian received Child Benefit and they lived in the UK. The Child Benefit claimant (usually the parent) received a voucher with which to open an account; a voucher worth £250 for children eligible before 1 August 2010, or a voucher worth £50 for those children eligible after 1 August 2010. There was an additional sum for children born into low-income families eligible for full Child Tax Credit; £250 for children eligible before 1 August 2010 or £50 for those eligible after. If the CTF account was not opened by the time the voucher expired (normally 12 months), HM Revenue and Customs would open an account for the child. Once opened, family and friends can deposit up to £1,200 a year into the CTF on behalf of the child.
Although Child Trust Funds were discontinued in 2011, for the period July 2012 to June 2014, 17% of all households reported having one or more Child Trust Funds, which was an increase from 15% in July 2010 to June 2012 (Table 5.5). This is therefore not as a result in new CTFs being started but more likely parents becoming aware that a CTF had been opened on behalf of their child by HMRC. Table 5.5 also shows that the household value of Child Trust Funds was £600 in the same period.
Table 5.5: Child Trust Funds
| Great Britain | ||||
| July 2012 to June 2014 | July 2010 to June 2012 | July 2008 to June 2010 | July 2006 to June 2008 | |
| Percentage with Child Trust Funds (%) | 17 | 15 | 13 | 10 |
| Median (£) | 600 | 500 | 500 | 300 |
| Source: Wealth and Assets Survey, Office for National Statistics | ||||
| Notes: | ||||
| 1. Results exclude households without this type of asset. | ||||
| 2. Child Trust Funds are for children born between 1 September 2002 and 2 January 2011. | ||||
Download this table Table 5.5: Child Trust Funds
.xls (54.8 kB)The survey also asked whether children in the household had any other financial assets in their names. For the period July 2012 to June 2014, 14% of all households reported having such assets (Table 5.6). Half of these households valued their children’s other assets at £1,000 or more.
Table 5.6: Other children's assets
| Great Britain | ||||
| July 2012 to June 2014 | July 2010 to June 2012 | July 2008 to June 2010 | July 2006 to June 2008 | |
| Percentage with other children's assets (%) | 14 | 16 | 17 | 16 |
| Median (£) | 1,000 | 1,000 | 1,000 | 800 |
| Source: Wealth and Assets Survey, Office for National Statistics | ||||
| Notes: | ||||
| 1. Results exclude households without this type of asset. | ||||
| 2. Other children’s assets are for those under 16 and exclude Child Trust Funds. | ||||
Download this table Table 5.6: Other children's assets
.xls (54.8 kB)Endowments
Endowments for the purpose of mortgage repayments are a financial asset and are therefore included here rather than as part of property wealth. Endowment policies can be used to save funds to repay the mortgage at the end of the term. This product also provides life cover and will pay out if the holder dies before policy maturity.
For the period July 2012 to June 2014, endowments for the purposes of repaying a mortgage were held by 2% of households (Table 5.7). This percentage has fallen from a high of 7% in July 2006 to June 2008. Half of all households possessing endowments valued these at £32,000 or more which is an increase from £28,800 in July 2010 to June 2012. This could be explained by the endowments that have reached maturity between the two periods being of lower value than those remaining rather than new endowments of higher value commencing.
Table 5.7: Endowments
| Great Britain | ||||
| July 2012 to June 2014 | July 2010 to June 2012 | July 2008 to June 2010 | July 2006 to June 2008 | |
| Percentage with endowments (%) | 2 | 4 | 5 | 7 |
| Median (£) | 32,000 | 28,800 | 27,000 | 28,000 |
| Source: Wealth and Assets Survey, Office for National Statistics | ||||
| Notes: | ||||
| 1. Results exclude households without this type of asset. | ||||
| 2. Endowments for the purpose of mortgage repayments. | ||||
Download this table Table 5.7: Endowments
.xls (54.3 kB)Notes for financial assets
- Kempson, E. (1998) ‘Savings and Low-income Households’. London: Personal Investment Authority.
4. Household gross financial wealth
Gross financial wealth is the sum of: formal financial assets (not including current accounts in overdraft), plus informal financial assets held by adults, plus financial assets held by children, plus endowments for the purpose of mortgage repayment. Half of all households had gross financial wealth of £8,500 or more during the period July 2012 to June 2014 (Table 5.8).
Table 5.8: Median household gross financial wealth
| Great Britain | ||||
| £ | ||||
| July 2012 to June 2014 | July 2010 to June 2012 | July 2008 to June 2010 | July 2006 to June 2008 | |
| Median household gross financial wealth | 8,500 | 8,400 | 8,500 | 8,000 |
| Source: Wealth and Assets Survey, Office for National Statistics | ||||
Download this table Table 5.8: Median household gross financial wealth
.xls (54.3 kB)5. Financial liabilities
This section examines the financial liabilities of households, including non-mortgage borrowing, and arrears on these and/or on other household bills. Mortgage statistics are provided within Chapter 3: Property wealth.
Household non-mortgage borrowing
Table 5.9 shows the percentage of households who had non-mortgage borrowing. During the period July 2012 to June 2014, just under half of all households (46%) had some form of non-mortgage borrowing; this was 3 percentage points lower than that seen in the period July 2010 to June 2012. The most popular means of non-mortgage borrowing was a credit or charge card; just under a quarter of all households (23%) had outstanding balances on credit or charge cards.
The percentage of households with any of the non-mortgage liability categories either decreased or stayed the same between the periods of July 2010 to June 2012 and July 2012 to June 2014. The liability with the biggest decrease over this period was formal loans, falling by 3 percentage points to 15%.
Table 5.9: Percentage of households with non-mortgage borrowing, by type of borrowing
| Great Britain | ||||
| % | ||||
| July 2012 to June 2014 | July 2010 to June 2012 | July 2008 to June 2010 | July 2006 to June 2008 | |
| Formal loans | 15 | 18 | 20 | 15 |
| Informal Loans | 1 | 2 | 2 | 1 |
| Loans from the Student Loan Company | 5 | 5 | 4 | 3 |
| Hire purchase | 14 | 14 | 13 | 14 |
| Credit and charge cards | 23 | 25 | 25 | 26 |
| Overdrafts | 16 | 18 | 18 | 17 |
| Store cards and charge accounts | 4 | 5 | 5 | 5 |
| Mail order | 5 | 7 | 8 | 9 |
| Any non-mortgage borrowing | 46 | 49 | 50 | 50 |
| Excluding overdrafts | 42 | 45 | 46 | 46 |
| Excluding loans from the Student Loans Company | 45 | 48 | 49 | 49 |
| Source: Wealth and Assets Survey, Office for National Statistics | ||||
Download this table Table 5.9: Percentage of households with non-mortgage borrowing, by type of borrowing
.xls (55.3 kB)Table 5.10 shows the median values of borrowing for households with each particular liability1. The median value of all non-mortgage borrowing for households with any such liabilities was £3,700 during the period July 2012 to June 2014, the same as that seen in the period July 2010 to June 2012.
The percentage of households with formal loans fell by 3 percentage points between July 2010 to June 2012 and July 2012 to June 2014. However, the median amount outstanding on the loans stayed the same at £5,500.
Informal loans were the least popular type of non-mortgage borrowing identified on the survey; only 1% of households reported this type of liability. The median value outstanding for households with informal loans decreased from £2,400 to £1,900 over the period July 2010 to June 2012 and July 2012 to June 2014. The fall in the median value of informal loans between these periods is consistent with the trend in Table 5.3, where there was a decrease in the median amount of money lent to others reported as an informal financial asset.
Table 5.10: Median amounts outstanding for household non-mortgage borrowing
| Great Britain | ||||
| £ | ||||
| July 2012 to June 2014 | July 2010 to June 2012 | July 2008 to June 2010 | July 2006 to June 20082 | |
| Formal loans2 | 5,500 | 5,500 | 4,800 | 4,500 |
| Informal Loans | 1,900 | 2,400 | 1,300 | 1,500 |
| Loans from the Student Loan Company | 11,000 | 9,000 | 9,000 | 8,000 |
| Hire purchase | 2,900 | 2,700 | 2,100 | 2,600 |
| Credit and charge cards | 1,700 | 1,800 | 1,600 | 1,500 |
| Overdrafts | 500 | 600 | 500 | 500 |
| Store cards and charge accounts | 200 | 300 | 200 | 200 |
| Mail order | 200 | 200 | 200 | 100 |
| Any non-mortgage borrowing | 3,700 | 3,700 | 3,200 | 2,900 |
| Excluding overdrafts | 4,100 | 4,000 | 3,500 | 3,100 |
| Excluding loans from the Student Loans Company | 3,100 | 3,200 | 2,900 | 2,600 |
| Source: Wealth and Assets Survey, Office for National Statistics | ||||
| Notes: | ||||
| 1. Excludes households without this particular type of borrowing. | ||||
| 2. Between July 2006 to June 2008, estimates exclude new loans i.e. those where no repayments had yet been made. | ||||
Download this table Table 5.10: Median amounts outstanding for household non-mortgage borrowing
.xls (55.8 kB)Household arrears
In addition to the amounts outstanding on non-mortgage borrowing, some households will be in arrears in relation to these and/or other household bills. During the period July 2012 to June 2014, 4% of households were in arrears in terms of their fixed-term non-mortgage borrowing (Table 5.11).
Table 5.11: Percentage of households in arrears of their fixed term non-mortgage borrowing, by type of borrowing
| Great Britain | ||||
| % | ||||
| July 2012 to June 2014 | July 2010 to June 2012 | July 2008 to June 2010 | July 2006 to June 2008 | |
| Personal and cash loan arrears | 4 | 5 | 5 | 4 |
| Mail order arrears | 2 | 3 | 4 | 4 |
| Any fixed term non-mortgage borrowing arrears3 | 4 | 4 | 4 | 4 |
| Source: Wealth and Assets Survey, Office for National Statistics | ||||
| Notes: | ||||
| 1. Number of responding households was those who were behind by two or more consecutive payments on specified commitment. | ||||
| 2. Excludes households without this type of fixed term non-mortgage borrowing. | ||||
| 3. Includes hire purchase arrears, which are not presented separately due to a low number of responding households. | ||||
Download this table Table 5.11: Percentage of households in arrears of their fixed term non-mortgage borrowing, by type of borrowing
.xls (55.3 kB)Those who reported arrears for any type of non-mortgage borrowing commitments were also asked a series of questions to enable the total amount outstanding to be calculated. Table 5.12 shows the values of arrears for households who were behind with fixed-term non-mortgage borrowing. Half of all households with any fixed term non-mortgage borrowing arrears owed £200 or more in outstanding commitments during the period July 2012 to July 2014.
Table 5.12: Median household arrears, by type of borrowing
| Great Britain | ||||
| £ | ||||
| July 2012 to June 2014 | July 2010 to June 2012 | July 2008 to June 2010 | July 2006 to June 2008 | |
| Personal and cash loan arrears | 300 | 600 | 300 | 400 |
| Mail order arrears | 100 | 100 | 200 | 100 |
| Any fixed-term non-mortgage borrowing arrears3 | 200 | 500 | 300 | 300 |
| Source: Wealth and Assets Survey, Office for National Statistics | ||||
| Notes: | ||||
| 1. Number of responding households was those who were behind by two or more consecutive payments on specified commitment. | ||||
| 2. Excludes households without this type of fixed term non-mortgage borrowing. | ||||
| 3. Includes hire purchase arrears, which are not presented separately due to a low number of responding households. | ||||
Download this table Table 5.12: Median household arrears, by type of borrowing
.xls (55.3 kB)Household financial liabilities
Financial liabilities are the sum of arrears on consumer credit and household bills plus personal loans and other non-mortgage borrowing plus informal borrowing plus overdrafts on current accounts. During July 2012 to June 2014, less than half of all households (48%) had some form of financial liability (Table 5.13). The median value of financial liabilities for these households was £3,400 in the same period.
Table 5.13: Household financial liabilities, summary statistics
| Great Britain | ||||
| July 2012 to June 2014 | July 2010 to June 2012 | July 2008 to June 2010 | July 2006 to June 2008 | |
| Percentage with financial liabilities (%) | 48 | 51 | 51 | 51 |
| Median (£) | 3,400 | 3,500 | 3,200 | 2,800 |
| Source: Wealth and Assets Survey, Office for National Statistics | ||||
Download this table Table 5.13: Household financial liabilities, summary statistics
.xls (54.3 kB)Notes for financial liabilities
- In order to obtain a value for non-mortgage borrowing, information is collected on the value of payments and how many payments are outstanding.
6. Household net financial wealth
Net financial wealth represents gross financial wealth minus financial liabilities. Median net financial wealth was £5,900 during the period July 2012 to June 2014.
Table 5.14: Median household net financial wealth
| Great Britain | ||||
| £ | ||||
| July 2012 to June 2014 | July 2010 to June 2012 | July 2008 to June 2010 | July 2006 to June 2008 | |
| Median household net financial wealth | 5,900 | 5,800 | 6,400 | 5,700 |
| Source: Wealth and Assets Survey, Office for National Statistics | ||||
Download this table Table 5.14: Median household net financial wealth
.xls (54.3 kB)Figure 5.15 presents the distribution of households by net financial wealth bands. Combining the three lowest net financial wealth bands enables us to identify those households in negative net financial wealth. Just under a quarter of households (22%) had negative net financial wealth during July 2012 to June 2014, slightly down on the July 2010 to June 2012 figure of 25%.
The percentage of households with a net financial wealth of less than -£5,000, the lowest net financial wealth band, had dropped by 2 percentage points to 10% in the latest period. Considering the upper net financial wealth band of £100,000 or more, 13% of households belonged within this band. The net financial wealth band containing the highest percentage of households was ‘at least £500 but less than £5,000’. In July 2012 to June 2014, 16% of households had enough net financial wealth to fall within this band.
Figure 5.15: Household net financial wealth (banded)
Geat Britain, July 2010 to June 2014
Source: Wealth and Assets Survey - Office for National Statistics
Download this chart Figure 5.15: Household net financial wealth (banded)
Image .csv .xlsAggregate estimates of financial wealth
Table 5.16 shows the aggregate values for financial wealth for all households in Great Britain (i.e. the weighted sum of each component of financial wealth for every household). Total net financial wealth for the whole of Great Britain was £1,596 billion for the period July 2012 to June 2014, up from £1,305 billion in the previous period of the survey.
The majority of this increase was down to changes in aggregate value of household gross financial wealth which rose from £1,409 billion to £1,698 billion over the same period. In contrast, the aggregate value for household financial liabilities saw a decrease from £105 billion to £101 billion over the same period.
Table 5.16: Aggregate financial wealth
| Great Britain | ||||
| £ billion | ||||
| July 2012 to June 2014 | July 2010 to June 2012 | July 2008 to June 2010 | July 2006 to June 2008 | |
| Aggregate household gross financial wealth | 1,698 | 1,409 | 1,186 | 1,131 |
| Aggregate household financial liabilities | 101 | 105 | 95 | 88 |
| Aggregate household net financial wealth | 1,596 | 1,305 | 1,091 | 1,043 |
| Source: Wealth and Assets Survey, Office for National Statistics | ||||
Download this table Table 5.16: Aggregate financial wealth
.xls (54.3 kB)7. Household net financial wealth by main household characteristics
Financial wealth by income
For the period July 2012 to June 2014, households in the lowest income band had a median net financial wealth of £300, the lowest of any income group. While those households in the highest income band have a median net financial wealth of £66,800, the highest of any income group. Figure 5.17 shows that median household net financial wealth increases as the household's income bands increases.
Median net financial wealth was lower in July 2012 to June 2014 for households in the lowest four income bands than for the households who fell in these bands in July 2010 to June 2012 – some households will have moved bands but some will be the same households. The largest fall was seen in the lowest income band where median net financial wealth fell from £600 to £300. Median net financial wealth increased for the top 6 income bands over the same period. The largest increase was seen in the highest income band rising from £60,200 to £66,800.
Figure 5.17: Median household net financial wealth, by total household net equivalised income decile
Great Britain, July 2010 to June 2014
Source: Wealth and Assets Survey - Office for National Statistics
Download this chart Figure 5.17: Median household net financial wealth, by total household net equivalised income decile
Image .csv .xlsFinancial wealth by region
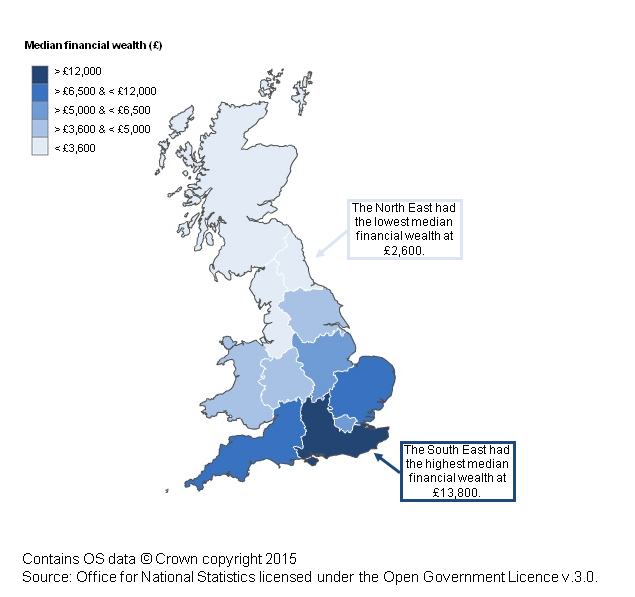
Figure 5.18 shows median household net financial wealth according to the location of the main residence of the household. It shows Scotland, Wales and the nine English regions (London has its own region; the figures for the South East exclude London). The region with the highest median net financial wealth during the period of July 2012 to June 2014 was the South East; half of all households within this particular region held net financial wealth of £13,800 or more. Households in the North East had the lowest median net financial wealth value of £2,600.
Figure 5.18: Median household net financial wealth, by region
Figure 5.18: Median household net financial wealth, by region
Great Britain, July 2012 to June 2014
Source: Wealth and Assets Survey - Office for National Statistics
Download this image Figure 5.18: Median household net financial wealth, by region
.png (113.1 kB) .xls (18.9 kB)
Figure 5.19 presents the change in median household net financial wealth between July 2010 to June 2012 and July 2012 to June 2014 for all households by region. The South West saw the largest percentage rise in median net financial wealth of 29%, increasing from £9,100 to £11,700. Yorkshire and The Humber saw the largest fall (24%) in the median value of net financial wealth (falling from £5,100 to £3,900).
Figure 5.19: Percentage change in household median net financial wealth, by region
Great Britain, June 2010 to July 2014
Source: Wealth and Assets Survey - Office for National Statistics
Download this chart Figure 5.19: Percentage change in household median net financial wealth, by region
Image .csv .xlsFinancial wealth by household type
Figure 5.20 shows the median values of household net financial wealth according to the ten categories of household type.
The median value of household net financial wealth was the highest for couple households who have no children, where one person was over and the other under 60/651, at £46,100. As illustrated in the introduction and demographics chapter of the current report, 3% of households were categorised as this type of household, making it one of the least common of all the household types. Couple households with no children, where both persons were above 60/65 had the second highest median net financial wealth, at £45,000. The median value of household net financial wealth was the lowest for lone parent households with dependent children, at £300. Single person households where the householder was under 60/65 and lone parent households with non-dependent children also had low net median financial wealth values of £600 and £1,500 respectively.
The most common household type comprised couple households with dependent children, accounting for 23% of all households. Median net financial wealth for this particular household type was £2,900. The biggest increases between July 2010 to June 2012 and July 2012 to June 2014 were in the two main ‘older couple’ categories with median net financial wealth increasing by 41% for households which were a “couple both over 60/65, no children” and by 31% for households which were a “couple 1 over / 1 under 60/65, no children”.
Figure 5.20: Median net household financial wealth, by household type
Great Britain, July 2010 to June 2014
Source: Wealth and Assets Survey - Office for National Statistics
Download this chart Figure 5.20: Median net household financial wealth, by household type
Image .csv .xls8. Household net financial wealth by individual characteristics
This section looks at some main characteristics of individuals living in households by net financial wealth bands. It is important to remember that this analysis presents individual characteristics by the total net financial wealth of the household that the individual lives within. In certain instances it is possible that this wealth is more likely attributed to other individuals living within that household.
Sex and marital status
Table 5.21 shows the distribution of individuals by sex and marital status, across the bands of household net financial wealth. During the period July 2012 to June 2014, 26% of all individuals lived in households with negative net financial wealth.
A higher percentage of cohabiting individuals lived in households in the lowest net financial wealth band in the period July 2012 to June 2014 than any other marital status group (19% of both men and women lived in households with net financial wealth of less than -£5,000). Married individuals were most likely to live in households belonging to the highest net financial wealth band of £100,000 or more (18% for men and women). Compared with single and cohabitating individuals, married individuals are on average older1. Also, knowing that the earnings of older workers are higher than those of younger workers2 and older individuals will have had longer to accumulate financial wealth, might go some way towards explaining these differences.
Table 5.21: Individuals by sex and marital status, by household net financial wealth
| Great Britain | |||||||||
| % | |||||||||
| Less than £0 | £0 but < £500 | £500 but < £5,000 | £5,000 but < £12,500 | £12,500 but < £25,000 | £25,000 but < £50,000 | £50,000 but < £100,000 | £100,000 or more | All Households | |
| Men | |||||||||
| Married1 | 20 | 4 | 13 | 11 | 10 | 12 | 11 | 18 | 100 |
| Cohabiting2 | 36 | 7 | 17 | 10 | 8 | 7 | 7 | 8 | 100 |
| Single | 31 | 8 | 18 | 10 | 8 | 8 | 6 | 10 | 100 |
| Widowed | 8 | 11 | 19 | 13 | 9 | 12 | 11 | 17 | 100 |
| Divorced | 20 | 18 | 18 | 13 | 8 | 9 | 6 | 8 | 100 |
| Separated3 | 31 | 14 | 18 | .. | .. | .. | .. | .. | 100 |
| All men | 26 | 7 | 16 | 11 | 9 | 10 | 9 | 13 | 100 |
| Women | |||||||||
| Married1 | 20 | 4 | 13 | 11 | 10 | 12 | 11 | 18 | 100 |
| Cohabiting2 | 36 | 7 | 17 | 9 | 8 | 7 | 7 | 9 | 100 |
| Single | 33 | 9 | 18 | 10 | 8 | 7 | 6 | 8 | 100 |
| Widowed | 9 | 10 | 21 | 14 | 13 | 13 | 9 | 12 | 100 |
| Divorced | 28 | 13 | 22 | 12 | 7 | 6 | 5 | 5 | 100 |
| Separated3 | 37 | 17 | 19 | 10 | .. | .. | .. | .. | 100 |
| All women | 26 | 8 | 17 | 11 | 9 | 9 | 8 | 12 | 100 |
| All Persons | 26 | 7 | 16 | 11 | 9 | 9 | 8 | 13 | 100 |
| Source: Wealth and Assets Survey, Office for National Statistics | |||||||||
| Notes: | |||||||||
| 1. Includes civil partnerships. | |||||||||
| 2. Includes same sex couples. | |||||||||
| 3. Includes civil partner separations and dissolutions. | |||||||||
| 4. ".." - Estimates that have been suppressed due to fewer than 30 unweighted cases. | |||||||||
Download this table Table 5.21: Individuals by sex and marital status, by household net financial wealth
.xls (57.3 kB)Age
Table 5.22 shows the distribution of individuals living in households with varying degrees of net financial wealth according to their age.
As wealth tends to be accumulated over the life of an individual – particularly their working life, it is unsurprising that younger people are more likely to live in households with negative net financial wealth compared to older people. In the period July 2012 to June 2014, individuals within the 25 to 34 age group were most likely to live in households with negative wealth, with 37% of individuals of this age group living in such households. However, it should also be noted that over a third (34%) of individuals aged under 16 and aged 16 to 24 are also living in households with negative net financial wealth.
Focusing on the highest net financial wealth band, individuals aged 55 to 64 and 65 years and above were most likely to live in households with net financial wealth of £100,000 or more (22% and 23% respectively). Individuals aged 25 to 34 were least likely to live in households with the highest amounts of net financial wealth (6%).
Table 5.22: Individuals by age, by household net financial wealth
| Great Britain | |||||||||
| % | |||||||||
| Less than £0 | £0 but < £500 | £500 but < £5,000 | £5,000 but < £12,500 | £12,500 but < £25,000 | £25,000 but < £50,000 | £50,000 but < £100,000 | £100,000 or more | All Households | |
| Under 16 | 34 | 8 | 21 | 10 | 8 | 7 | 5 | 7 | 100 |
| 16-24 | 34 | 9 | 15 | 9 | 8 | 9 | 7 | 9 | 100 |
| 25-34 | 37 | 6 | 19 | 11 | 8 | 7 | 5 | 6 | 100 |
| 35-44 | 31 | 7 | 17 | 12 | 9 | 9 | 7 | 8 | 100 |
| 45-54 | 26 | 7 | 14 | 10 | 9 | 11 | 10 | 13 | 100 |
| 55-64 | 17 | 6 | 11 | 9 | 10 | 12 | 13 | 22 | 100 |
| 65+ | 6 | 6 | 15 | 12 | 11 | 13 | 14 | 23 | 100 |
| All Persons | 26 | 7 | 16 | 11 | 9 | 9 | 8 | 13 | 100 |
| Source: Wealth and Assets Survey, Office for National Statistics | |||||||||
Download this table Table 5.22: Individuals by age, by household net financial wealth
.xls (56.3 kB)Education level
Table 5.23 shows the percentage of individuals living in households with varying degrees of net financial wealth according to their education level.
The percentage of individuals educated at degree level or above living in households with net financial wealth of £100,000 or more (the highest net financial wealth band) was 24% – 17 percentage points higher than individuals reporting no qualifications.
Nearly three in ten individuals with other qualifications lived in households with negative net financial wealth (27%). This compares with 21% of individuals reporting both no qualifications and degree level qualifications or above.
Table 5.23: Individuals by education level, by household net financial wealth
| Great Britain | |||||||||
| % | |||||||||
| Less than £0 | £0 but < £500 | £500 but < £5,000 | £5,000 but < £12,500 | £12,500 but < £25,000 | £25,000 but < £50,000 | £50,000 but < £100,000 | £100,000 or more | All Households | |
| Degree level or above | 21 | 2 | 10 | 10 | 10 | 12 | 12 | 24 | 100 |
| Other qualifications | 27 | 7 | 16 | 11 | 9 | 10 | 9 | 12 | 100 |
| No qualifications | 21 | 15 | 21 | 12 | 10 | 8 | 7 | 7 | 100 |
| All Persons | 24 | 7 | 15 | 11 | 9 | 10 | 9 | 14 | 100 |
| Source: Wealth and Assets Survey, Office for National Statistics | |||||||||
| Notes: | |||||||||
| 1. Includes only eligible adults who gave their education level. | |||||||||
Download this table Table 5.23: Individuals by education level, by household net financial wealth
.xls (55.8 kB)Economic activity
Table 5.24 shows the percentage of individuals living in households with varying degrees of net financial wealth according to their economic activity.
The percentage of individuals living in households in negative net financial wealth was highest for those who were economically inactive due to sickness or disability (40%), and those who were unemployed (43%). Fewer retired individuals lived in households with negative net financial wealth than any other economic activity group (6%). Retired and other inactive individuals were most likely to live in households with net financial wealth of £100,000 or more (23% and 21% respectively).
Table 5.24: Individuals by economic activity, by household net financial wealth
| Great Britain | |||||||||
| % | |||||||||
| Less than £0 | £0 but < £500 | £500 but < £5,000 | £5,000 but < £12,500 | £12,500 but < £25,000 | £25,000 but < £50,000 | £50,000 but < £100,000 | £100,000 or more | All Households | |
| Economically Active | |||||||||
| In Employment | 28 | 5 | 15 | 11 | 10 | 10 | 9 | 12 | 100 |
| Employee | 28 | 5 | 16 | 12 | 10 | 10 | 9 | 12 | 100 |
| Self Employed | 25 | 4 | 15 | 10 | 9 | 11 | 9 | 18 | 100 |
| Unemployed | 43 | 19 | 12 | 7 | 5 | 5 | 5 | 5 | 100 |
| Economically Inactive | |||||||||
| Student | 32 | 8 | 15 | 7 | 7 | 10 | 10 | 12 | 100 |
| Looking after family/home | 32 | 15 | 22 | 7 | 6 | 6 | 4 | 8 | 100 |
| Sick / Disabled2 | 40 | 23 | 16 | 7 | 5 | 4 | 2 | 3 | 100 |
| Retired | 6 | 7 | 14 | 12 | 11 | 13 | 14 | 23 | 100 |
| Other Inactive | 23 | 11 | 15 | 7 | 8 | 10 | 7 | 21 | 100 |
| All Persons | 26 | 7 | 16 | 11 | 9 | 9 | 8 | 13 | 100 |
| Source: Wealth and Assets Survey, Office for National Statistics | |||||||||
| Notes: | |||||||||
| 1. Combined figure for temporarily sick / injured and long term sick and disabled. | |||||||||
Download this table Table 5.24: Individuals by economic activity, by household net financial wealth
.xls (57.3 kB)Socio-economic group
Table 5.25 shows the distribution of individuals living in households with varying degrees of net financial wealth according to their socio-economic classification.
Over one in four individuals classified in the group ‘large employers and higher managerial’ lived in households with net financial wealth of £100,000 or more (28%). Individuals working in semi-routine and routine occupations were least likely to live in a household within the highest net financial wealth band (5%).
The percentage of individuals living in households in negative net financial wealth was highest for those who were working in routine occupations (38%). The percentage of individuals classified in lower supervisory and technical occupations who lived in households in negative net financial wealth was 29%.
Table 5.25: Individuals by socio-economic classification, by household net financial wealth
| Great Britain | |||||||||
| % | |||||||||
| Less than £0 | £0 but < £500 | £500 but < £5,000 | £5,000 but < £12,500 | £12,500 but < £25,000 | £25,000 but < £50,000 | £50,000 but < £100,000 | £100,000 or more | All Households | |
| Large employers and higher managerial | 16 | 1 | 9 | 9 | 10 | 14 | 13 | 28 | 100 |
| Higher professional | 22 | 3 | 12 | 12 | 10 | 12 | 12 | 18 | 100 |
| Lower managerial and professional | 23 | 4 | 15 | 12 | 11 | 11 | 10 | 14 | 100 |
| Intermediate occupations | 24 | 6 | 17 | 10 | 9 | 10 | 9 | 15 | 100 |
| Small employers and own account workers | 28 | 6 | 19 | 11 | 10 | 10 | 8 | 7 | 100 |
| Lower supervisory and technical | 29 | 11 | 19 | 11 | 9 | 8 | 6 | 7 | 100 |
| Semi-routine occupations | 29 | 14 | 22 | 11 | 8 | 7 | 5 | 5 | 100 |
| Routine occupations | 38 | 19 | 18 | 7 | 5 | 4 | 4 | 5 | 100 |
| Never worked/long term unemployed | 21 | 10 | 15 | 10 | 9 | 10 | 10 | 16 | 100 |
| All persons | 26 | 7 | 16 | 11 | 9 | 9 | 8 | 13 | 100 |
| Source: Wealth and Assets Survey, Office for National Statistics | |||||||||
| Notes: | |||||||||
| 1. Includes only eligible adults who gave sufficient information to determine socio-economic group. | |||||||||
Download this table Table 5.25: Individuals by socio-economic classification, by household net financial wealth
.xls (56.8 kB)9. Quality assuring financial wealth data
Where possible, the following section has performed comparisons with estimates derived from the financial chapter of the Wealth in Great Britain 2012 -2014 report with other sources of financial wealth data.
HMRC ISA data
Initially HM Revenue & Customs (HMRC) published statistics on Individual Savings Accounts (ISAs) are compared with data from the WAS. HMRC data on ISAs1 are derived from annual information submitted to HMRC by providers in respect of each individual scheme member. It provides figures on the number of individuals contributing to these savings accounts and the amounts held in ISAs by sex and age.
Comparison of the market value of ISA funds
Table A compares the median ISA wealth from the two sources. Figure B shows the percentage difference between these two sources, by age. Note that the average market values are only for those with non-zero reported ISA wealth.
The mean ISA values are smaller in the WAS data than the HMRC figures (£17,700 compared with HMRC’s figure of £19,500)2. The difference is most pronounced in the youngest age group i.e. those aged under 25. Here the mean ISA wealth from HMRC is £1,800 greater than those estimated from the WAS (a difference of 36%).
There are a number of things to bear in mind where attempts are made to compare these two sources. Firstly, HMRC data is for the United Kingdom, whereas WAS only surveys households in Great Britain. Additionally, as the WAS data covers those surveyed any time between 2012 to 2014, and the HMRC figures relate to specific ISA market values on 5th April 2013, a second comparison has been run using just those WAS cases who were surveyed in 2013 (presented on the right hand side of table A). There is a larger difference between the figures when only looking at 2013.
Table 5.A: Comparison of median ISA wealth, by age and sex, noting that WAS covers Great Britain (July 2012 to June 2014) to and HMRC covers United Kingdom (5th April 2013)
| HMRC (as of end of tax year 2013) | WAS July 2012 to June 2014 | Difference | |
| United Kingdom | Great Britain | ||
| Male | |||
| Under 25 | £3,345 | £5,321 | 37% |
| 25 to 34 | £5,098 | £6,315 | 19% |
| 35 to 44 | £10,142 | £11,898 | 15% |
| 45 to 54 | £17,386 | £16,337 | -6% |
| 55 to 64 | £26,683 | £25,774 | -4% |
| 65 and over | £35,476 | £28,562 | -24% |
| All Male | £20,617 | £19,403 | -6% |
| Female | |||
| Under 25 | £3,158 | £4,766 | 34% |
| 25 to 34 | £4,702 | £5,485 | 14% |
| 35 to 44 | £8,640 | £8,683 | 0% |
| 45 to 54 | £14,317 | £13,492 | -6% |
| 55 to 64 | £24,970 | £20,055 | -25% |
| 65 and over | £33,904 | £23,835 | -42% |
| All Female | £18,487 | £16,150 | -14% |
| All | |||
| Under 25 | £3,247 | £5,041 | 36% |
| 25 to 34 | £4,892 | £6,050 | 19% |
| 35 to 44 | £9,366 | £10,416 | 10% |
| 45 to 54 | £15,770 | £18,462 | 15% |
| 55 to 64 | £25,801 | £28,624 | 10% |
| 65 and over | £34,705 | £32,944 | -5% |
| All ISA holders | £19,528 | £17,692 | -10% |
| HMRC (as of end of tax year 2013) | WAS 2013 | Difference | |
| United Kingdom | Great Britain | ||
| Male | |||
| Under 25 | £3,345 | £4,564 | 27% |
| 25 to 34 | £5,098 | £6,853 | 26% |
| 35 to 44 | £10,142 | £10,672 | 5% |
| 45 to 54 | £17,386 | £15,349 | -13% |
| 55 to 64 | £26,683 | £24,709 | -8% |
| 65 and over | £35,476 | £28,359 | -25% |
| All Male | £20,617 | £18,890 | -9% |
| Female | |||
| Under 25 | £3,158 | £4,151 | 24% |
| 25 to 34 | £4,702 | £5,784 | 19% |
| 35 to 44 | £8,640 | £7,809 | -11% |
| 45 to 54 | £14,317 | £12,927 | -11% |
| 55 to 64 | £24,970 | £19,831 | -26% |
| 65 and over | £33,904 | £21,479 | -58% |
| All Female | £18,487 | £15,179 | -22% |
| All | |||
| Under 25 | £3,247 | £4,361 | 26% |
| 25 to 34 | £4,892 | £6,290 | 22% |
| 35 to 44 | £9,366 | £9,261 | -1% |
| 45 to 54 | £15,770 | £14,030 | -12% |
| 55 to 64 | £25,801 | £22,042 | -17% |
| 65 and over | £34,705 | £24,647 | -41% |
| All ISA holders | £19,528 | £16,917 | -15% |
| Source: Office for National Statistics | |||
| Notes: | |||
| 1. Excludes individual’s without ISA wealth. | |||
Download this table Table 5.A: Comparison of median ISA wealth, by age and sex, noting that WAS covers Great Britain (July 2012 to June 2014) to and HMRC covers United Kingdom (5th April 2013)
.xls (28.7 kB)The WAS estimates that 18.3 million adults have an ISA between 2010 and 2012. This is lower than HMRC’s estimates that around 22.7 million adults have ISAs.
Comparison of aggregate market value of ISA funds
In the fourth wave of WAS, total ISA wealth is calculated as £324,5 billion, whereas HMRC estimates that total ISA wealth on the 5th April 2013 was £442,8 billion. Therefore, it seems that both at a population and individual level, ISA wealth is underestimated in WAS Wave 4. However, the difference in estimates could be due to the differences in the coverage of each data source, as WAS does not survey households in Northern Ireland.
FRS savings and investments data
The following section examines how published savings and investment statistics from the Family Resources Survey (FRS) compares with WAS data. The FRS is a major study, sponsored by the Department for Work and Pensions (DWP). It provides information about the living conditions of people in the UK and the resources available to them.
Like with the data from HMRC, a number of factors need to be factored in when attempting comparisons between the two sources. The FRS data used for comparison purposes covers a time period of 2013 to 2014, whereas wave three of WAS covers 2012 to 2014. Furthermore, the FRS surveys households in the United Kingdom, whereas WAS only surveys households in Great Britain.
Percentage of households with formal financial assets
The FRS estimated that 93% of households have a current account, compared to 96% of households estimated by WAS. However, when looking at the definitions of the different types of assets in WAS and FRS, it might not be suitable to compare those figures directly.
The FRS estimates that 97% of households have any Direct Payment Account, which is any account that accepts electronic payment of benefits via the BACS system. This can include current accounts, basic bank accounts, post office card accounts and other types of savings and investment accounts. This figure is more comparable to the WAS figure since Current Account in WAS includes current accounts, basic bank accounts and post office card accounts. WAS estimates that 96% of households have a current account only 1 percentage points lower than the FRS estimate.
The FRS estimates that 19% and 3% of households had premium bonds and national savings bonds respectively. WAS estimates that 3% of households had National Savings bonds (certificates) and premium bonds.
The FRS estimates that 41% of households have an ISA, compared to 48% estimated by WAS.
WAS estimates that 5% of households had a unit or investment trust, 2% higher than the FRS estimate that 3% of households had a unit trust.
Table 5.B: Comparison of financial assets in WAS and FRS, where WAS covers Great Britain (2012 to 2014) and FRS covers United Kingdom (2013 to 14)
| Great Britain | ||
| % | ||
| WAS July 2012 to June 2014 | FRS 2013/2014 | |
| All current accounts | 96 | 93 |
| Direct Payment Account1 | 97 | |
| ISAs | 48 | 41 |
| Unit/Investment trusts | 5 | 3 |
| National Savings certificates and bonds2 | 23 | 19 |
| Premium Bonds | 3 | |
| Source: Wealth and Assets Survey and Family Resources Survey | ||
| Notes: | ||
| 1. The definition of Direct Payment Account in FRS is similar to the definition of Current Account in WAS. | ||
| 2. National Savings bonds and certificates are separately identified in FRS but they are identified together in WAS. | ||
| 3. All numbers rounded to the nearest whole number. | ||
Download this table Table 5.B: Comparison of financial assets in WAS and FRS, where WAS covers Great Britain (2012 to 2014) and FRS covers United Kingdom (2013 to 14)
.xls (55.3 kB)Half a century since they first went on sale, Premium Bonds have a place in the savings portfolios of 23 million people – this represents almost 40% of the population of the UK. Together, they own over 32 billion Bonds. Premium Bonds are one of Britain’s financial success stories, offering investors the chance to win tax-free prizes up to £1 million without putting their capital at risk.
1.6 million people hold £5,000 in Bonds. 300,000 people hold the maximum £30,000.
Published by National Savings and Investments 2006
Information is correct as at October 2006 unless stated.
Table 5.C: Proportion of households with formal financial assets: Great Britain, WAS July 2012 to June 2014 compared with United Kingdom, FRS 2013 to 2014
| Great Britain | |
| WAS July 2012 to June 2014 | % |
| All current accounts | 96 |
| Savings accounts | 57 |
| ISAs | 48 |
| National Savings certificates and bonds2 | 23 |
| UK shares | 12 |
| Overseas shares | 2 |
| Employee shares and share options | 7 |
| Unit/Investment trusts | 5 |
| Other formal financial assets | 1 |
| Any formal financial asset | 98 |
| FRS 2013 - 2014 | % |
| Direct Payment Account1 | 97 |
| NS&I Savings account | 3 |
| Other Bank/Building Society account | 45 |
| ISAs | 41 |
| Premium Bonds | 19 |
| National Savings Bonds | 3 |
| Stocks and shares/member of a Share club | 15 |
| Company Share Scheme/profit sharing | 3 |
| Unit trusts | 3 |
| Any other type of asset | 1 |
| Any type of account (including POCA) | 97 |
| Source: Office for National Statistics | |
| Notes: | |
| 1. The definition of Direct Payment Account in FRS is similar to the definition of Current Account in WAS. | |
| 2. Including Premium Bonds. | |
Download this table Table 5.C: Proportion of households with formal financial assets: Great Britain, WAS July 2012 to June 2014 compared with United Kingdom, FRS 2013 to 2014
.xls (56.3 kB)HMRC Child Trust Funds data
Table D presents a comparison of figures on Child Trust Funds for Great Britain from WAS against official figures produced by HMRC for 2012. Possible reasons for the low figure include: firstly, if the child was less than one year old at the time of the survey, an account may not yet have been opened on their behalf; secondly, the survey may have underreported children with CTFs if the adult interviewed about a child was unaware that an account had been opened – either by another adult with responsibility for the child or by HM Revenue and Customs; thirdly, HMRC’s market value reflects value during the second half of the WAS survey period covering 2012 to 2014, and may have increased to reflect additional deposits, accumulation of interest, and so on. Children born from 2nd January 2011 onwards were no longer entitled to open a Child Trust Fund account.
Table 5.D: Child Trust Funds: Great Britain, WAS July 2012 to June 2014 compared with Great Britain1, HMRC 2013/14
| Great Britain | ||
| £ | ||
| WAS | HMRC | |
| Value of assets held in accounts (£ millions) | 5,734 | 6,141 |
| Number of accounts held (thousands) | 4,258 | 4,893 |
| Source: Office for National Statistics | ||
| Notes: | ||
| 1. GB figures from HMRC derived by adding values from regions to form GB. | ||
Download this table Table 5.D: Child Trust Funds: Great Britain, WAS July 2012 to June 2014 compared with Great Britain1, HMRC 2013/14
.xls (54.8 kB)HMRC Child Trust Funds data
Table D presents a comparison of figures on Child Trust Funds for Great Britain from WAS against official figures produced by HMRC for 2012. Possible reasons for the low figure include: firstly, if the child was less than one year old at the time of the survey, an account may not yet have been opened on their behalf; secondly, the survey may have underreported children with CTFs if the adult interviewed about a child was unaware that an account had been opened – either by another adult with responsibility for the child or by HM Revenue and Customs; thirdly, HMRC’s market value reflects value during the second half of the WAS survey period covering 2012 to 2014, and may have increased to reflect additional deposits, accumulation of interest, and so on. Children born from 2nd January 2011 onwards were no longer entitled to open a Child Trust Fund account.
Table 5.D: Child Trust Funds: Great Britain, WAS July 2012 to June 2014 compared with Great Britain1, HMRC 2013/14
| £ | ||
| WAS | HMRC | |
| Value of assets held in accounts (£ millions) | 5,734 | 6,141 |
| Number of accounts held (thousands) | 4,258 | 4,893 |
| Source: Office for National Statistics | ||
| Notes: | ||
| 1. GB figures from HMRC derived by adding values from regions to form GB. | ||