Table of contents
- Main points
- Summary
- Weekly earnings
- Annual earnings
- Hourly earnings (excluding overtime)
- Distribution of earnings
- Earnings trends
- Gender pay difference
- Public and private sector pay
- Regional earnings
- Earnings by age group
- Earnings by occupation
- The make-up of earnings
- Total weekly and overtime paid hours
- Background notes
- Methodology
1. Main points
In April 2013 median gross weekly earnings for full-time employees were £517, up 2.2% from £506 in 2012
For men, full-time earnings were £556 per week, up 1.8%, compared with £459 for women, up 2.2%
The gender pay gap (i.e. the difference between men's and women's earnings as a percentage of men's earnings) based on median gross hourly earnings (excluding overtime) for full-time employees increased to 10.0% from 9.5% in 2012
For the year ending 5 April 2013 median gross annual earnings for full-time employees (who had been in the same job for at least 12 months) were £27,000, an increase of 2.1% from the previous year
In April 2013 10% of full-time employees earned less than £7.28 per hour (excluding overtime), an increase of 1.5% compared with the previous year. At the other end of the distribution, 10% of full-time employees earned more than £27.02 per hour, which was also an increase of 1.5% compared with the previous year
In April 2013 median gross weekly earnings for full-time employees were highest in London, at £658, and lowest in Northern Ireland, at £460
2. Summary
The Annual Survey of Hours and Earnings (ASHE) is based on a 1% sample of employee jobs. This is drawn from HM Revenue and Customs Pay As You Earn (PAYE) records. ASHE collects information on the levels, distribution and make-up of earnings and hours paid. Results are produced for various industrial, occupational and geographic breakdowns, as well as by public and private sectors and age groups.
This bulletin contains provisional estimates from the 2013 survey and revised estimates from the 2012 survey. Unless otherwise stated, all figures in this bulletin relate to employees on adult rates whose earnings for the survey pay period were not affected by absence.
Back to table of contents3. Weekly earnings
In April 2013 median gross weekly earnings for full-time employees were £517, up 2.2% from £506 in 2012.
Men’s median full-time weekly earnings increased by 1.8% to £556 between 2012 and 2013, compared with an increase of 2.2% for women to £459.
Figure 1: Median full-time gross weekly earnings by sex, UK, April 2012 and 2013
Source: Annual Survey of Hours and Earnings (ASHE) - Office for National Statistics
Notes:
- Employees on adult rates, pay unaffected by absence
- Full-time defined as employees working more than 30 paid hours per week (or 25 or more for the teaching professions)
- 2012 data are revised, 2013 data are provisional
Download this chart Figure 1: Median full-time gross weekly earnings by sex, UK, April 2012 and 2013
Image .csv .xlsPart-time median weekly earnings were £160 in April 2013, up 3.1% from 2012. For women, part-time weekly earnings were £164, compared with £149 for men.
The median gross weekly earnings for all employee jobs (full-time and part-time) were £417, an increase of 2.6% from 2012.
Figure 2: Median gross weekly earnings, UK, April 2012 and 2013
Source: Annual Survey of Hours and Earnings (ASHE) - Office for National Statistics
Notes:
- Employees on adult rates, pay unaffected by absence
- Full-time defined as employees working more than 30 paid hours per week (or 25 or more for the teaching professions)
- 2012 data are revised, 2013 data are provisional
Download this chart Figure 2: Median gross weekly earnings, UK, April 2012 and 2013
Image .csv .xls
Table 1: Median gross weekly earnings, UK, April 2012 and 2013
| £ per week | |||||
| Full-time | Part-time | All | |||
| April 2012 | Men | 546.0 | 145.8 | 498.1 | |
| Women | 448.9 | 158.7 | 319.7 | ||
| All | 506.1 | 155.2 | 405.8 | ||
| April 2013 | Men | 556.0 | 149.5 | 508.0 | |
| Women | 458.8 | 164.3 | 327.5 | ||
| All | 517.5 | 160.1 | 416.5 | ||
| Change % | Men | 1.8 | 2.5 | 2.0 | |
| Women | 2.2 | 3.5 | 2.5 | ||
| All | 2.2 | 3.1 | 2.6 | ||
| Source: Annual Survey of Hours and Earnings - Office for National Statistics Notes: 1. Employees on adult rates, pay unaffected by absence 2. Full-time defined as employees working more than 30 paid hours per week (or 25 or more for the teaching professions) 3. 2012 data are revised, 2013 data are provisional 4. Figures rounded to one decimal place | |||||
Download this table Table 1: Median gross weekly earnings, UK, April 2012 and 2013
.xls (25.6 kB)4. Annual earnings
For the tax year ending 5 April 2013 median gross annual earnings for full-time employees on adult rates who had been in the same job for at least 12 months (including those whose pay was affected by absence) were £27,000. This was an increase of 2.1% compared with £26,500 in the year ending 5 April 2012.
Median gross annual earnings for men were £29,300, up 1.9% from 2012, and for women were £23,600, up 2.2%.
Figure 3: Median full-time gross annual earnings by sex, UK, 2012 and 2013
Source: Annual Survey of Hours and Earnings (ASHE) - Office for National Statistics
Notes:
- Employees on adult rates who have been in the same job for at least 12 months, including those whose pay was affected by absence
- Full-time defined as employees working more than 30 paid hours per week (or 25 or more for the teaching professions)
- Earnings for tax year ending 5 April
- 2012 data are revised, 2013 data are provisional
Download this chart Figure 3: Median full-time gross annual earnings by sex, UK, 2012 and 2013
Image .csv .xls
Table 2: Median full-time gross annual earnings by sex, UK, 2012 and 2013
| £ thousands per year | |||||
| Men | Women | All | |||
| 2012 | 28.7 | 23.1 | 26.5 | ||
| 2013 | 29.3 | 23.6 | 27.0 | ||
| Change % | 1.9 | 2.2 | 2.1 | ||
| Source: Annual Survey of Hours and Earnings - Office for National Statistics Notes: 1. Employees on adult rates who have been in the same job for at least 12 months, including those whose pay was affected by absence 2. Full-time defined as employees working more than 30 paid hours per week (or 25 or more for the teaching professions) 3. Earnings for tax year ending 5 April 4. 2012 data are revised, 2013 data are provisional 5. Figures rounded to one decimal place | |||||
Download this table Table 2: Median full-time gross annual earnings by sex, UK, 2012 and 2013
.xls (24.6 kB)5. Hourly earnings (excluding overtime)
Excluding overtime, median gross hourly earnings of full-time employees were £13.03 per hour in April 2013, up 2.0% on 2012. The median hourly earnings of men increased by 2.5% compared with an increase of 1.9% for women.
Figure 4: Median gross hourly earnings (excluding overtime), UK, April 2012 and 2013
Source: Annual Survey of Hours and Earnings (ASHE) - Office for National Statistics
Notes:
- Employees on adult rates, pay unaffected by absence
- Full-time defined as employees working more than 30 paid hours per week (or 25 or more for the teaching professions)
- 2012 data are revised, 2013 data are provisional
Download this chart Figure 4: Median gross hourly earnings (excluding overtime), UK, April 2012 and 2013
Image .csv .xls
Table 3: Median gross hourly earnings (excluding overtime), UK, April 2012 and 2013
| £ per hour | |||||
| Full-time | Part-time | All | |||
| April 2012 | Men | 13.27 | 7.72 | 12.50 | |
| Women | 12.01 | 8.14 | 10.05 | ||
| All | 12.77 | 8.02 | 11.23 | ||
| April 2013 | Men | 13.60 | 7.95 | 12.86 | |
| Women | 12.24 | 8.40 | 10.33 | ||
| All | 13.03 | 8.29 | 11.56 | ||
| Change % | Men | 2.5 | 3.0 | 2.9 | |
| Women | 1.9 | 3.2 | 2.8 | ||
| All | 2.0 | 3.4 | 2.9 | ||
| Source: Annual Survey of Hours and Earnings - Office for National Statistics Notes: 1. Employees on adult rates, pay unaffected by absence 2. Full-time defined as employees working more than 30 paid hours per week (or 25 or more for the teaching professions) 3. 2012 data are revised, 2013 data are provisional 4. Earnings rounded to two decimal places, percentages rounded to one decimal place | |||||
Download this table Table 3: Median gross hourly earnings (excluding overtime), UK, April 2012 and 2013
.xls (25.6 kB)6. Distribution of earnings
In April 2013 10% of full-time employees earned less than £7.28 per hour (excluding overtime), while 10% earned more than £27.02 per hour.
Between 2012 and 2013 hourly earnings for full-time employees at the 10th percentile grew by 1.5%, which was the same as the growth seen at the 90th percentile. The comparable figures for part-time employees were increases of 1.8% for the 10th percentile and 2.7% for the 90th percentile.
The hourly earnings at the 90th percentile of full-time employees were 207% of the median while the hourly earnings at the 10th percentile were 56% of the median.
Figure 5: Distribution of gross hourly earnings (excluding overtime), UK, April 2013
Source: Annual Survey of Hours and Earnings (ASHE) - Office for National Statistics
Notes:
- Employees on adult rates, pay unaffected by absence
- Full-time defined as employees working more than 30 paid hours per week (or 25 or more for the teaching professions)
- 2013 data are provisional
Download this chart Figure 5: Distribution of gross hourly earnings (excluding overtime), UK, April 2013
Image .csv .xls
Table 4: Distribution of gross hourly earnings (excluding overtime), UK, April 2013
| £ per hour | ||||
| Full-time | Part-time | All | ||
| Men | 10% earned less than | 7.50 | 6.19 | 6.90 |
| 50% earned less than | 13.60 | 7.95 | 12.86 | |
| 10% earned more than | 29.59 | 23.65 | 28.88 | |
| Women | 10% earned less than | 7.00 | 6.19 | 6.40 |
| 50% earned less than | 12.24 | 8.40 | 10.33 | |
| 10% earned more than | 23.55 | 19.50 | 22.13 | |
| All | 10% earned less than | 7.28 | 6.19 | 6.56 |
| 50% earned less than | 13.03 | 8.29 | 11.56 | |
| 10% earned more than | 27.02 | 20.21 | 25.42 | |
| Source: Annual Survey of Hours and Earnings - Office for National Statistics Notes: 1. Employees on adult rates, pay unaffected by absence 2. Full-time defined as employees working more than 30 paid hours per week (or 25 or more for the teaching professions) 3. 2013 data are provisional 4. Figures rounded to two decimal places | ||||
Download this table Table 4: Distribution of gross hourly earnings (excluding overtime), UK, April 2013
.xls (25.6 kB)7. Earnings trends
Between 1997 (the first year for which ASHE data are available) and 2013 median full-time gross weekly earnings increased by 61%, from £321 to £517. Up until 2008 the annual increase in weekly earnings was fairly steady, averaging at around 4% each year. However since the start of the economic downturn earnings growth has slowed, with the annual increase averaging at around 2% each year between 2009 and 2013.
In April 2013 the annual increase in median full-time gross weekly earnings, at 2.2%, was slightly lower than the growth in the Consumer Prices Index (CPI), which was 2.4%. This was the fifth consecutive year that the CPI had increased above the growth rate in median weekly earnings after 11 consecutive years in which it was lower. However the gap has narrowed compared with that seen in April 2012.
Figure 6: Annual percentage change in median full-time gross weekly earnings and the Consumer Prices Index (CPI), UK, April 1998 to 2013
Source: Annual Survey of Hours and Earnings (ASHE) - Office for National Statistics
Notes:
- Employees on adult rates, pay unaffected by absence
- Full-time defined as employees working more than 30 paid hours per week (or 25 or more for the teaching professions)
- CPI figures are based on the All Items Consumer Prices Index of inflation for April
- 2013 earnings figure is provisional
Download this chart Figure 6: Annual percentage change in median full-time gross weekly earnings and the Consumer Prices Index (CPI), UK, April 1998 to 2013
Image .csv .xlsSimilar trends over time are observed for annual and hourly earnings. Table 5 shows selected earnings time series for full-time employees for the period 1997 to 2013.
Table 5: Time series for selected earnings estimates for full-time employees, UK, 1997 to 2013
| £ | |||||
| Year | Median gross weekly earnings | Median gross annual earnings | Gross hourly earnings (excluding overtime) | ||
| Median | 10% earned less than | 10% earned more than | |||
| 1997 | 320.5 | - | 7.83 | 4.30 | 16.08 |
| 1998 | 334.9 | - | 8.16 | 4.49 | 16.89 |
| 1999 | 345.5 | 17,803 | 8.50 | 4.70 | 17.74 |
| 2000 | 359.0 | 18,848 | 8.76 | 4.91 | 18.34 |
| 2001 | 375.9 | 19,722 | 9.21 | 5.11 | 19.58 |
| 2002 | 390.9 | 20,376 | 9.63 | 5.35 | 20.57 |
| 2003 | 404.0 | 21,124 | 9.96 | 5.60 | 21.22 |
| 2004a | 422.8 | 22,011 | 10.47 | 5.83 | 22.15 |
| 2004b | 419.2 | 22,056 | 10.35 | 5.76 | 21.80 |
| 2005 | 431.2 | 22,888 | 10.67 | 5.98 | 22.83 |
| 2006c | 446.4 | 23,554 | 11.11 | 6.19 | 23.63 |
| 2006d | 443.6 | 23,367 | 11.03 | 6.18 | 23.49 |
| 2007 | 457.6 | 24,043 | 11.36 | 6.40 | 24.16 |
| 2008 | 479.1 | 25,165 | 11.88 | 6.61 | 25.10 |
| 2009 | 488.5 | 25,806 | 12.33 | 6.90 | 25.90 |
| 2010 | 498.5 | 25,882 | 12.50 | 7.00 | 26.28 |
| 2011e | 500.7 | 26,244 | 12.62 | 7.01 | 26.75 |
| 2011f | 498.3 | 26,095 | 12.56 | 7.00 | 26.60 |
| 2012 | 506.1 | 26,472 | 12.77 | 7.17 | 26.62 |
| 2013 | 517.5 | 27,017 | 13.03 | 7.28 | 27.02 |
| Source: Annual Survey of Hours and Earnings - Office for National Statistics Notes: 1. Weekly and hourly figures relate to employees on adult rates whose pay was unaffected by absence 2. Annual figures relate to employees on adult rates who had been in the same job for at least 12 months, including those whose pay was affected by absence 3. Full-time defined as employees working more than 30 paid hours per week (or 25 or more for the teaching professions) 4. Annual earnings information was first collected in 1999. Figures represent earnings for the tax year ending 5 April 5. Breaks in series in 2004, 2006 and 2011: (a) 2004 results excluding supplementary survey for comparison with 2003 (b) 2004 results including supplementary survey designed to improve coverage of the survey; (c) 2006 results with methodology consistent with 2005; (d) 2006 results with methodology consistent with 2007; (e) 2011 results based on Standard Occupational Classification 2000; (f) 2011 results based on Standard Occupational Classification 2010 6. 2013 data are provisional 7. Weekly figures rounded to one decimal place, hourly figures rounded to two decimal places and annual figures rounded to the nearest whole number | |||||
Download this table Table 5: Time series for selected earnings estimates for full-time employees, UK, 1997 to 2013
.xls (28.7 kB)8. Gender pay difference
The earnings of women relative to men vary according to whether an employee works full-time or part-time. ASHE estimates show that median gross hourly earnings (excluding overtime) of part-time employees were 36% less than the earnings of full-time employees in April 2013. At the same time (2013 Quarter 2), the Labour Force Survey (LFS) indicates that the UK workforce consisted of approximately 12.8 million men (51% of the employee workforce) and 12.5 million women (49% of the workforce).
The LFS also shows that there is a difference in the proportion of male and female employees who work full- and part-time. For male employees, 88% worked full-time and 12% worked part-time in 2013 Q2, while the comparable figures for female employees were 58% and 42% respectively. This highlights the fact that more women work part-time than men and consequently they are more likely to receive lower hourly rates of pay.
Figure 7: Employee workforce composition, UK, 2013 Q2
Source: Labour Force Survey - Office for National Statistics
Notes:
- Number of employees to nearest thousand, seasonally adjusted
- Split between full-time and part-time employment based on respondents' self-classification
Download this chart Figure 7: Employee workforce composition, UK, 2013 Q2
Image .csv .xls
Table 6: Employee workforce composition, UK, 2013 Q2
| Employees, thousands | ||||||
| Men | % of total | Women | % of total | All | % of total | |
| Full-time | 11,356 | 88.4 | 7,260 | 58.2 | 18,616 | 73.5 |
| Part-time | 1,489 | 11.6 | 5,214 | 41.8 | 6,704 | 26.5 |
| All | 12,845 | 100.0 | 12,475 | 100.0 | 25,320 | 100.0 |
| Source: Labour Force Survey - Office for National Statistics Notes: 1. Number of employees to nearest thousand, seasonally adjusted 2. Split between full-time and part-time employment based on respondents' self-classification 3. Percentages rounded to one decimal place | ||||||
Download this table Table 6: Employee workforce composition, UK, 2013 Q2
.xls (25.1 kB)Median hourly earnings (excluding overtime)
The gender pay gap is defined as the difference between men’s and women’s earnings as a percentage of men’s earnings. Looking at median hourly earnings (excluding overtime) there is a large difference in the gap for full-time employees compared to part-time employees.
Full-time
In April 2013 men’s median gross hourly earnings (excluding overtime) grew by 2.5% to £13.60, up from £13.27 in 2012. In comparison, women’s hourly earnings were £12.24, a 1.9% increase compared with £12.01 in 2012. The gender pay gap for full-time employees therefore increased to 10.0% from 9.5% in 2012.
Part-time
For part-time employees, men’s median gross hourly earnings (excluding overtime) were £7.95 in April 2013, up 3.0% from £7.72 in 2012. In comparison, women’s hourly earnings were £8.40, an increase of 3.2% from £8.14. The gender pay difference for part-time employees was therefore in the opposite direction to that of full-time employees, widening to -5.7% compared with -5.5% in 2012.
All
In April 2013 the gender pay gap based on median hourly earnings for all employees (full-time and part-time) increased slightly to 19.7% from 19.6% in 2012.
Figure 8: Gender pay gap for median gross hourly earnings (excluding overtime), UK, April 2000 to 2013
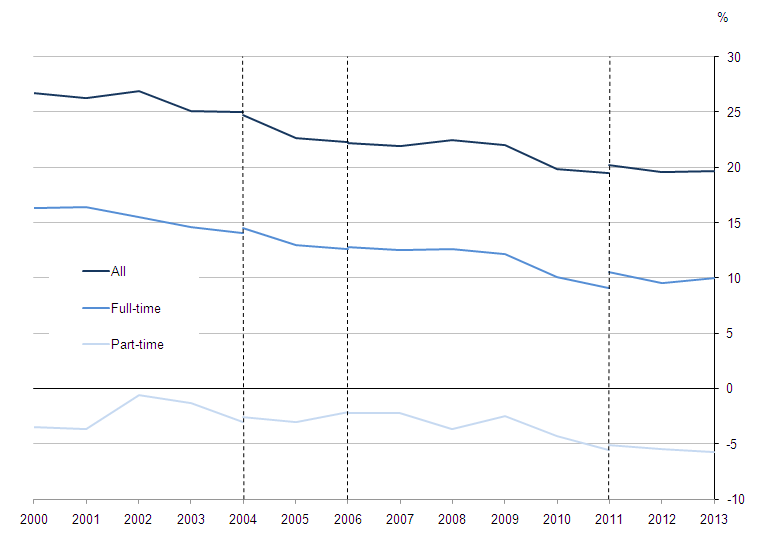
Source: Annual Survey of Hours and Earnings (ASHE) - Office for National Statistics
Notes:
- Employees on adult rates, pay unaffected by absence
- Full-time defined as employees working more than 30 paid hours per week (or 25 or more for the teaching professions)
- Figures represent the difference between men's and women's hourly earnings as a percentage of men's earnings
- Dashed lines represent discontinuities in 2004, 2006 and 2011 ASHE estimates
- 2013 data are provisional
Download this image Figure 8: Gender pay gap for median gross hourly earnings (excluding overtime), UK, April 2000 to 2013
.png (22.2 kB)
Table 7: Median gross hourly earnings (excluding overtime) with gender pay differences, UK, April 2012 and 2013
| £ per hour | ||||
| Men | Women | Pay gap % | ||
| April 2012 | Full-time | 13.27 | 12.01 | 9.5 |
| Part-time | 7.72 | 8.14 | -5.5 | |
| All | 12.50 | 10.05 | 19.6 | |
| April 2013 | Full-time | 13.60 | 12.24 | 10.0 |
| Part-time | 7.95 | 8.40 | -5.7 | |
| All | 12.86 | 10.33 | 19.7 | |
| Source: Annual Survey of Hours and Earnings - Office for National Statistics Notes: 1. Employees on adult rates, pay unaffected by absence 2. Full-time defined as employees working more than 30 paid hours per week (or 25 or more for the teaching professions) 3. Percentages represent the difference between men's and women's hourly earnings as a percentage of men's earnings 4. 2012 data are revised, 2013 data are provisional 5. Earnings rounded to two decimal places, percentages rounded to one decimal place | ||||
Download this table Table 7: Median gross hourly earnings (excluding overtime) with gender pay differences, UK, April 2012 and 2013
.xls (25.6 kB)Mean hourly earnings (excluding overtime)
Although ONS’s headline estimates of gender pay differences are based on median hourly earnings (excluding overtime), mean hourly earnings provide a useful supplementary measure. The mean measure of earnings tends to be higher than the median as it is skewed by the relatively small number of employees at the top end of the distribution with extremely high earnings.
Full-time
Men’s mean gross hourly earnings (excluding overtime) were £16.91 in April 2013, up 2.3% from £16.52 in 2012. Women’s mean hourly earnings increased by 1.3% to £14.25 compared with £14.07 in 2012. This means that the gender pay difference for full-time employees widened to 15.7% from 14.8% in 2012.
Part-time
For part-time employees, men’s mean hourly earnings (excluding overtime) were £11.73, up from £11.58 in 2012, compared with women’s hourly earnings of £11.12, up from £10.79. The gender pay gap for part-time employees therefore narrowed to 5.2%, from 6.9% in 2012. It is noteworthy that the pay gap for mean earnings is in the opposite direction to that for median earnings. The reason for this is that there are a larger number of men than women who are working part-time with high earnings, which skews the distribution and increases the mean relative to the median.
All
The gender pay difference based on the mean for all employees has increased to 19.1% in 2013 from 18.6% in 2012.
Figure 9: Gender pay gap for mean gross hourly earnings (excluding overtime), UK, April 2000 to 2013
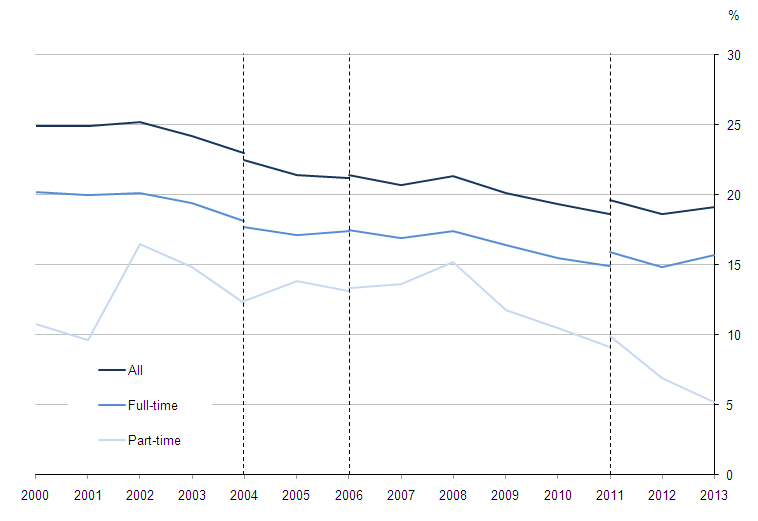
Source: Annual Survey of Hours and Earnings (ASHE) - Office for National Statistics
Notes:
- Employees on adult rates, pay unaffected by absence
- Full-time defined as employees working more than 30 paid hours per week (or 25 or more for the teaching professions)
- Figures represent the difference between men's and women's hourly earnings as a percentage of men's earnings
- Dashed lines represent discontinuities in 2004, 2006 and 2011 ASHE estimates
- 2013 data are provisional
Download this image Figure 9: Gender pay gap for mean gross hourly earnings (excluding overtime), UK, April 2000 to 2013
.png (23.1 kB)
Table 8: Mean gross hourly earnings (excluding overtime) with gender pay differences, UK, April 2012 and 2013
| £ per hour | ||||
| Men | Women | Pay gap % | ||
| April 2012 | Full-time | 16.52 | 14.07 | 14.8 |
| Part-time | 11.58 | 10.79 | 6.9 | |
| All | 16.20 | 13.19 | 18.6 | |
| April 2013 | Full-time | 16.91 | 14.25 | 15.7 |
| Part-time | 11.73 | 11.12 | 5.2 | |
| All | 16.58 | 13.42 | 19.1 | |
| Source: Annual Survey of Hours and Earnings - Office for National Statistics Notes: 1. Employees on adult rates, pay unaffected by absence 2. Full-time defined as employees working more than 30 paid hours per week (or 25 or more for the teaching professions) 3. Percentages represent the difference between men's and women's hourly earnings as a percentage of men's earnings 4. 2012 data are revised, 2013 data are provisional 5. Earnings rounded to two decimal places, percentages rounded to one decimal place | ||||
Download this table Table 8: Mean gross hourly earnings (excluding overtime) with gender pay differences, UK, April 2012 and 2013
.xls (25.6 kB)Age
Figure 10 shows median gender pay differences by age group based on full-time hourly earnings (excluding overtime). The gender pay gap is relatively small in age groups up to, and including, the 30-39 age group (with the exception of the 16-17 age group), but is relatively large thereafter. This is likely to be connected with the fact that many women have children and the time taken out of the labour market, combined with career choices they make subsequent to this, may impact on their earnings thereafter.
Figure 10: Gender pay gap for median full-time gross hourly earnings (excluding overtime) by age group, UK, April 2013
Source: Annual Survey of Hours and Earnings (ASHE) - Office for National Statistics
Notes:
- All employees aged 16-17 and employees aged 18 and over on adult rates, pay unaffected by absence
- Full-time defined as employees working more than 30 paid hours per week (or 25 or more for the teaching professions)
- Gender pay gap defined as difference between men’s and women’s hourly earnings as a percentage of men’s earnings
- 2013 data are provisional
Download this chart Figure 10: Gender pay gap for median full-time gross hourly earnings (excluding overtime) by age group, UK, April 2013
Image .csv .xlsDistribution of earnings
In April 2013 the gender pay gap for full-time employees at the 90th percentile (20.4%) was larger than those for the median (10.0%) and 10th percentile (6.6%).
For part-time employees, there was no gender pay gap at the 10th percentile, a gap of -5.7% for the median (i.e. women’s earnings were higher than men’s), and a gap of 17.5% for the 90th percentile.
For all employees (full-time and part-time), the gender pay difference was smallest at the 10th percentile (7.2%) and largest at the 90th percentile (23.4%).
Table 9: Gender pay difference by distribution of gross hourly earnings (excluding overtime), UK, April 2013
| % | |||
| Full-time | Part-time | All | |
| 10th percentile | 6.6 | 0.0 | 7.2 |
| Median | 10.0 | -5.7 | 19.7 |
| 90th percentile | 20.4 | 17.5 | 23.4 |
| Source: Annual Survey of Hours and Earnings - Office for National Statistics Notes: 1. Employees on adult rates, pay unaffected by absence 2. Full-time defined as employees working more than 30 paid hours per week (or 25 or more for the teaching professions) 3. Figures represent the difference between men's and women's hourly earnings as a percentage of men's earnings 4. 2013 data are provisional 5. Figures rounded to one decimal place | |||
Download this table Table 9: Gender pay difference by distribution of gross hourly earnings (excluding overtime), UK, April 2013
.xls (24.6 kB)9. Public and private sector pay
The median gross weekly pay of full-time employees in the public sector was £574 in April 2013, up 1.6% from £564 in 2012. For the private sector the comparable figure was £490, up 2.3% from £479 in 2012.
The public and private sectors have workforces which are composed quite differently. Consequently differences in gross weekly earnings do not reveal differences in rates of pay for comparable jobs. For example, many of the lowest paid occupations, such as bar and restaurant staff, hairdressers, elementary sales occupations and cashiers, exist primarily in the private sector, while there are a larger proportion of graduate-level and professional occupations in the public sector.
Figure 11: Median full-time gross weekly earnings for public and private sectors, UK, April 2012 and 2013
Source: Annual Survey of Hours and Earnings (ASHE) - Office for National Statistics
Notes:
- Employees on adult rates, pay unaffected by absence
- Full-time defined as employees working more than 30 paid hours per week (or 25 or more for the teaching professions)
- Private sector comprised of businesses whose legal status is defined as “Company”, “Sole Proprietor” or “Partnership”; public sector comprised of those defined as “Public Corporation”, “Central Government” or “Local Authority”
- 2012 data are revised, 2013 data are provisional
Download this chart Figure 11: Median full-time gross weekly earnings for public and private sectors, UK, April 2012 and 2013
Image .csv .xlsASHE breakdowns by public and private sector are produced according to the legal status of the employers. Between 2008 and 2009 some banks were nationalised, meaning that they moved from the private sector to the public sector.
These bank reclassifications changed the distribution of earnings in the public and private sectors and so it is interesting to look at the impact of the reclassifications on public and private sector growth. If median earnings for 2012 and 2013 are recalculated with all the nationalised banks reclassified to the private sector then the annual increase in weekly earnings between April 2012 and 2013 for the public sector stays at 1.6% but for the private sector it becomes 2.6% (compared with 2.3%).
Table 10: Median full-time gross weekly earnings for public and private sectors (with and without nationalised banks reclassified to private sector), UK, April 2012 and 2013
| £ per week | ||||
| Banks in public sector | Banks in private sector | |||
| Public sector | Private sector | Public sector | Private sector | |
| April 2012 | 564.3 | 479.1 | 563.5 | 479.2 |
| April 2013 | 573.6 | 490.1 | 572.6 | 491.4 |
| Change % | 1.6 | 2.3 | 1.6 | 2.6 |
| Source: Annual Survey of Hours and Earnings - Office for National Statistics Notes: 1. Employees on adult rates, pay unaffected by absence 2. Full-time defined as employees working more than 30 paid hours per week (or 25 or more for the teaching professions) 3. Private sector comprised of businesses whose legal status is defined as “Company”, “Sole Proprietor” or “Partnership”;public sector comprised of those defined as “Public Corporation”, “Central Government” or “Local Authority”, public sector comprised of those defined as “Public Corporation”, “Central Government” or “Local Authority” 4. 2012 data are revised, 2013 data are provisional 5. Figures rounded to one decimal place | ||||
Download this table Table 10: Median full-time gross weekly earnings for public and private sectors (with and without nationalised banks reclassified to private sector), UK, April 2012 and 2013
.xls (26.1 kB)The composition of the public and private sectors changes from year to year. For example, when new jobs are created at the lower end of the earnings distribution, or when highly-paid jobs are lost, this exerts a drag on the median figure. Looking only at jobs in which the employee had been in post for at least one year (thereby removing the influence of the changes in the composition of the labour market), different growth rates in the public and private sectors are seen. For the public sector the annual increase in median full-time gross weekly earnings between April 2012 and 2013 becomes 3.8% (compared with 1.6%) and for the private sector it becomes 3.5% (compared with 2.3%).
Figure 12a: Annual percentage change in median full-time gross weekly earnings for public and private sectors for all employees and those in continuous employment, UK, April 2006 to 2013
Public sector
Source: Annual Survey of Hours and Earnings (ASHE) - Office for National Statistics
Notes:
- Employees on adult rates, pay unaffected by absence
- Full-time defined as employees working more than 30 paid hours per week (or 25 or more for the teaching professions)
- Private sector comprised of businesses whose legal status is defined as “Company”, “Sole Proprietor” or “Partnership”; public sector comprised of those defined as “Public Corporation”, “Central Government” or “Local Authority”
- 2013 data are provisional
Download this chart Figure 12a: Annual percentage change in median full-time gross weekly earnings for public and private sectors for all employees and those in continuous employment, UK, April 2006 to 2013
Image .csv .xls
Figure 12b: Annual percentage change in median full-time gross weekly earnings for public and private sectors for all employees and those in continuous employment, UK, April 2006 to 2013
Private sector
Source: Annual Survey of Hours and Earnings (ASHE) - Office for National Statistics
Notes:
- Employees on adult rates, pay unaffected by absence
- Full-time defined as employees working more than 30 paid hours per week (or 25 or more for the teaching professions)
- Private sector comprised of businesses whose legal status is defined as “Company”, “Sole Proprietor” or “Partnership”; public sector comprised of those defined as “Public Corporation”, “Central Government” or “Local Authority”
- 2013 data are provisional
Download this chart Figure 12b: Annual percentage change in median full-time gross weekly earnings for public and private sectors for all employees and those in continuous employment, UK, April 2006 to 2013
Image .csv .xls10. Regional earnings
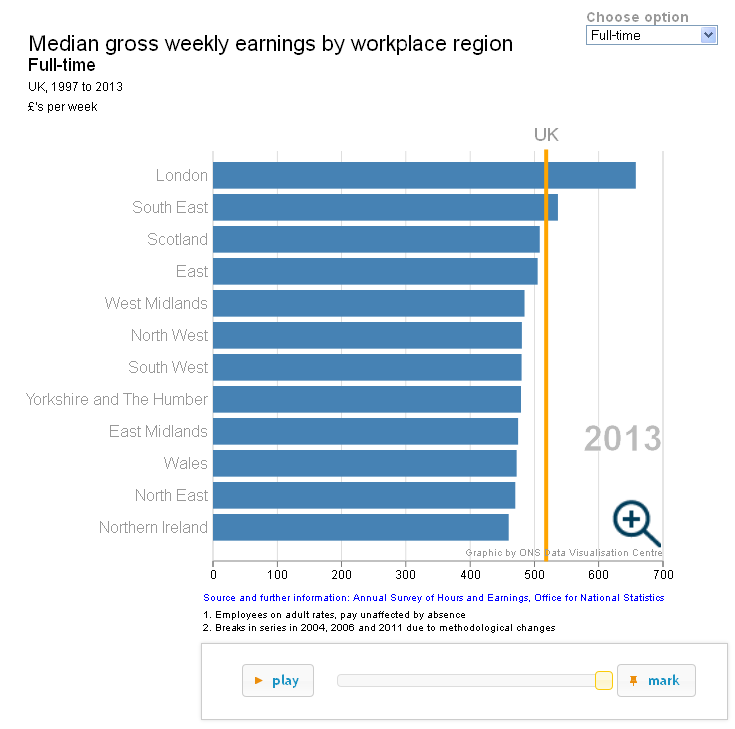
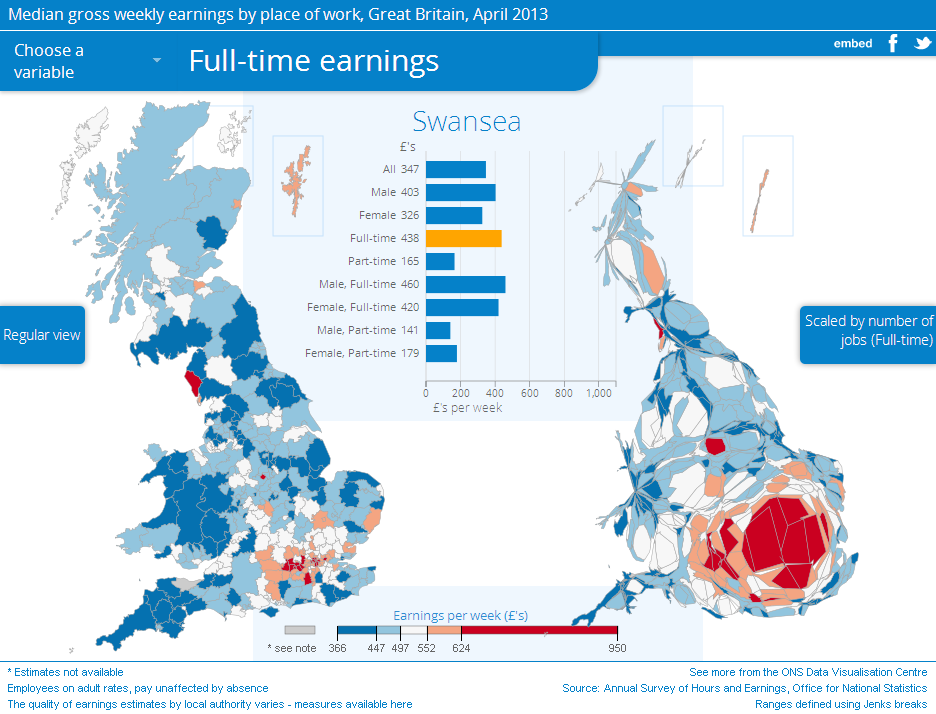
In April 2013 median gross weekly earnings for full-time employees were highest in London, at £658 (27% higher than the national median), and lowest in Northern Ireland, at £460 (11% lower than the national median). London’s high levels of pay are largely due to the fact that a high proportion of its labour force is employed in high-paying industries and occupations, and also because many employees are entitled to allowances for working in the capital.
It should be noted that earnings comparisons take no account of variations in prices for goods and services between regions and therefore do not necessarily indicate differences in the standard of living. Neither do they take account of differences in the regional composition of the workforce, meaning that like-for-like comparisons may not be appropriate. For example, a region might have a lower level of median earnings than another if it has a higher proportion of employees in industries or occupations with relatively low earnings.
Figure 13 shows median full-time gross weekly earnings by region in April 2013. In addition, an interactive chart showing changes in earnings by region over time and an interactive map showing earnings by local authority are available by clicking the following links:
Click to view interactive version
Click to view interactive version
Figure 13: Median full-time gross weekly earnings by region, UK, April 2013
Source: Annual Survey of Hours and Earnings (ASHE) - Office for National Statistics
Notes:
- Employees on adult rates, pay unaffected by absence
- Full-time defined as employees working more than 30 paid hours per week (or 25 or more for the teaching professions)
- 2013 data are provisional
Download this chart Figure 13: Median full-time gross weekly earnings by region, UK, April 2013
Image .csv .xlsThe regional earnings distribution differed by sex. While weekly earnings were highest in London for both sexes, earnings for men were lowest in Northern Ireland, at £477, and for women they were lowest in the East Midlands, at £409.
Table 11: Median full-time gross weekly earnings by region, UK, April 2013
| £ per week | ||||||
| Region | Men | % change from 2012 | Women | % change from 2012 | All | % change from 2012 |
| United Kingdom | 556.0 | 1.8 | 458.8 | 2.2 | 517.5 | 2.2 |
| North East | 507.8 | 3.6 | 416.1 | 2.3 | 470.2 | 3.5 |
| North West | 516.9 | 2.4 | 432.2 | 3.0 | 480.5 | 2.4 |
| Yorkshire and The Humber | 517.5 | 3.4 | 416.3 | 1.0 | 479.1 | 3.1 |
| East Midlands | 515.8 | 1.5 | 408.9 | 1.6 | 474.6 | 2.2 |
| West Midlands | 527.0 | 3.7 | 417.1 | 2.1 | 484.6 | 3.3 |
| East | 550.6 | 2.3 | 440.8 | 3.5 | 505.0 | 2.0 |
| London | 717.3 | 1.5 | 593.2 | 0.3 | 657.7 | 0.9 |
| South East | 589.3 | 0.1 | 465.6 | 1.0 | 536.6 | 0.0 |
| South West | 519.9 | 2.6 | 421.4 | 2.3 | 480.0 | 2.7 |
| Wales | 502.4 | 4.3 | 421.9 | 4.5 | 472.3 | 4.4 |
| Scotland | 544.3 | 2.2 | 454.0 | 3.6 | 508.3 | 2.1 |
| Northern Ireland | 477.4 | -0.1 | 441.5 | 0.3 | 460.0 | 0.5 |
| Source: Annual Survey of Hours and Earnings - Office for National Statistics Notes: 1. Employees on adult rates, pay unaffected by absence 2. Full-time defined as employees working more than 30 paid hours per week (or 25 or more for the teaching professions) 3. 2013 data are provisional 4. Figures rounded to one decimal place | ||||||
Download this table Table 11: Median full-time gross weekly earnings by region, UK, April 2013
.xls (26.1 kB)11. Earnings by age group
In April 2013 the distribution of median gross weekly earnings for full-time employees showed that earnings were highest for the 40 to 49-year-old age group, at £580. Median gross weekly earnings increased until employees reached this age band and steadily decreased thereafter.
Figure 14: Median full-time gross weekly earnings by age group, UK, April 2013
Source: Annual Survey of Hours and Earnings (ASHE) - Office for National Statistics
Notes:
- All employees aged 16-17 and employees aged 18 and over on adult rates, pay unaffected by absence
- Full-time defined as employees working more than 30 paid hours per week (or 25 or more for the teaching professions)
- 2013 data are provisional
Download this chart Figure 14: Median full-time gross weekly earnings by age group, UK, April 2013
Image .csv .xlsThere were some differences between the distribution of earnings by age for men and women. Men’s median weekly earnings were highest in the 40 to 49-year-old age group, at £638, whereas women’s earnings were highest in the 30 to 39-year-old age group, at £533.
Table 12: Median full-time gross weekly earnings by age group, UK, April 2013
| £ per week | ||||||
| Age group | Men | % change from 2012 | Women | % change from 2012 | All | % change from 2012 |
| 16-17 | 167.5 | 0.6 | 126.1 | 2.5 | 155.8 | -3.8 |
| 18-21 | 298.6 | 1.1 | 276.2 | 3.7 | 287.5 | 2.8 |
| 22-29 | 430.6 | 2.4 | 404.8 | 0.6 | 420.0 | 1.9 |
| 30-39 | 579.0 | 0.7 | 533.3 | 1.2 | 562.2 | 0.8 |
| 40-49 | 637.8 | 2.4 | 494.1 | 2.0 | 580.3 | 1.3 |
| 50-59 | 614.1 | 2.7 | 463.9 | 4.0 | 551.0 | 2.8 |
| 60+ | 527.5 | 3.8 | 416.2 | 2.2 | 490.0 | 2.9 |
| Source: Annual Survey of Hours and Earnings - Office for National Statistics Notes: 1. All employees aged 16-17 and employees aged 18 and over on adult rates, pay unaffected by absence 2. Full-time defined as employees working more than 30 paid hours per week (or 25 or more for the teaching professions) 3. 2013 data are provisional 4. Figures rounded to one decimal place | ||||||
Download this table Table 12: Median full-time gross weekly earnings by age group, UK, April 2013
.xls (25.6 kB)12. Earnings by occupation
In April 2013 median gross weekly earnings for full-time employees were highest for managers, directors and senior officials, at £765 (48% higher than the median for all employees), and lowest for sales and customer service occupations, at £331 (36% lower than the median for all employees).
Table 13: Median full-time gross weekly earnings by major occupation group, UK, April 2013
| £ per week | |||
| Major occupation group | Men | Women | All |
| All | 556.0 | 458.8 | 517.5 |
| 1 - Managers, directors and senior officials | 821.2 | 651.6 | 765.1 |
| 2 - Professional occupations | 755.0 | 655.2 | 703.2 |
| 3 - Associate professional and technical occupations | 624.7 | 519.0 | 582.4 |
| 4 - Administrative and secretarial occupations | 436.8 | 384.3 | 399.6 |
| 5 - Skilled trades occupations | 486.3 | 345.3 | 476.1 |
| 6 - Caring, leisure and other service occupations | 370.4 | 325.5 | 336.7 |
| 7 - Sales and customer service occupations | 345.0 | 321.5 | 331.2 |
| 8 - Process, plant and machine operatives | 450.0 | 325.8 | 436.1 |
| 9 - Elementary occupations | 360.0 | 284.5 | 336.4 |
| Source: Annual Survey of Hours and Earnings - Office for National Statistics Notes: 1. Employees on adult rates, pay unaffected by absence 2. Full-time defined as employees working more than 30 paid hours per week (or 25 or more for the teaching professions) 3. Occupations as defined by the Standard Occupational Classification 2010 4. 2013 data are provisional 5. Figures rounded to one decimal place | |||
Download this table Table 13: Median full-time gross weekly earnings by major occupation group, UK, April 2013
.xls (25.6 kB)Again, there were some differences in the distribution of earnings for men and women. The highest and lowest earnings by major occupation group for men mirrored that of the overall distribution. However, for women, weekly earnings were highest in professional occupations, at £655, and lowest in elementary occupations, at £284.
Figure 15: Median full-time gross weekly earnings by major occupation group, UK, April 2013
Major occupation group
Source: Annual Survey of Hours and Earnings (ASHE) - Office for National Statistics
Notes:
- Employees on adult rates, pay unaffected by absence
- Full-time defined as employees working more than 30 paid hours per week (or 25 or more for the teaching professions)
- Occupations as defined by the Standard Occupational Classification 2010
- 2013 data are provisional
Download this chart Figure 15: Median full-time gross weekly earnings by major occupation group, UK, April 2013
Image .csv .xls13. The make-up of earnings
Additional payments (i.e. overtime, bonuses, commission and shift pay) accounted for 5.1% of mean full-time gross weekly earnings in April 2013. For male employees additional payments accounted for 6.1% of mean total weekly earnings compared with 3.2% for women.
Figure 16: Components of full-time mean gross weekly earnings, UK, April 2013
Source: Annual Survey of Hours and Earnings (ASHE) - Office for National Statistics
Notes:
- Employees on adult rates, pay unaffected by absence
- Full-time defined as employees working more than 30 paid hours per week (or 25 or more for the teaching professions)
- Calculation of mean includes zero responses
- 2013 data are provisional
Download this chart Figure 16: Components of full-time mean gross weekly earnings, UK, April 2013
Image .csv .xls
Table 14: Components of full-time mean gross weekly earnings, UK, April 2013
| £ per week | |||||
| Gross pay | Components | ||||
| Overtime | Bonuses or commission | Shift, etc. | Component subtotal | ||
| Men | 676.7 | 23.0 | 10.9 | 7.6 | 41.5 |
| Women | 532.9 | 7.0 | 3.9 | 6.0 | 16.9 |
| All | 620.3 | 16.7 | 8.2 | 7.0 | 31.9 |
| Source: Annual Survey of Hours and Earnings - Office for National Statistics Notes: 1. Employees on adult rates, pay unaffected by absence 2. Full-time defined as employees working more than 30 paid hours per week (or 25 or more for the teaching professions) 3. Calculation of mean includes zero responses 4. 2013 data are provisional 5. Figures rounded to one decimal place | |||||
Download this table Table 14: Components of full-time mean gross weekly earnings, UK, April 2013
.xls (25.6 kB)14. Total weekly and overtime paid hours
In April 2013 full-time employees worked a mean average of 39.1 paid hours per week (including overtime). In comparison, part-time employees worked 18.1 hours per week.
The mean weekly paid hours of work for full-time men were 40.1 hours compared with 37.4 for women. For part-time employees the mean weekly paid hours worked were 17.5 hours for men and 18.3 for women.
Figure 17: Mean full-time weekly paid hours of work (including overtime), UK, April 2012 and 2013
Source: Annual Survey of Hours and Earnings (ASHE) - Office for National Statistics
Notes:
- Employees on adult rates, pay unaffected by absence
- Full-time defined as employees working more than 30 paid hours per week (or 25 or more for the teaching professions)
- 2012 data are revised, 2013 data are provisional
Download this chart Figure 17: Mean full-time weekly paid hours of work (including overtime), UK, April 2012 and 2013
Image .csv .xls
Table 15: Mean weekly paid hours of work (including overtime), UK, April 2012 and 2013
| Hours per week | ||||
| Full-time | Part-time | All | ||
| April 2012 | Men | 40.1 | 17.7 | 37.0 |
| Women | 37.4 | 18.3 | 29.1 | |
| All | 39.0 | 18.2 | 33.1 | |
| April 2013 | Men | 40.1 | 17.5 | 37.0 |
| Women | 37.4 | 18.3 | 29.2 | |
| All | 39.1 | 18.1 | 33.2 | |
| Source: Annual Survey of Hours and Earnings - Office for National Statistics Notes: 1. Employees on adult rates, pay unaffected by absence. Full-time defined as employees working more than 30 paid hours per week (or 25 or more for the teaching professions) 2. 2012 data are revised, 2013 data are provisional 3. Figures rounded to one decimal place | ||||
Download this table Table 15: Mean weekly paid hours of work (including overtime), UK, April 2012 and 2013
.xls (25.1 kB)The proportion of full-time employees working paid overtime in April 2013 was 18.6%, the same as in 2012. Full-time employees worked a mean average of 1.1 paid overtime hours per week in 2013. The proportion of full-time men who worked paid overtime was 22.8% and for full-time women it was 12.1%.
Figure 18: Full-time mean weekly paid overtime hours, UK, April 2012 and 2013
Source: Annual Survey of Hours and Earnings (ASHE) - Office for National Statistics
Notes:
- Employees on adult rates, pay unaffected by absence
- Full-time defined as employees working more than 30 paid hours per week (or 25 or more for the teaching professions)
- Calculation of mean includes zero response
- 2012 data are revised, 2013 data are provisional
Download this chart Figure 18: Full-time mean weekly paid overtime hours, UK, April 2012 and 2013
Image .csv .xls
Table 16: Mean weekly paid overtime hours worked, UK, April 2012 and 2013
| Hours per week | |||||
| Full-time | % who worked overtime | Part-time | % who worked overtime | ||
| April 2012 | Men | 1.5 | 22.9 | 1.2 | 16.1 |
| Women | 0.5 | 12.0 | 0.7 | 15.7 | |
| All | 1.1 | 18.6 | 0.8 | 15.8 | |
| April 2013 | Men | 1.5 | 22.8 | 1.1 | 15.2 |
| Women | 0.5 | 12.1 | 0.7 | 15.3 | |
| All | 1.1 | 18.6 | 0.8 | 15.3 | |
| Source: Annual Survey of Hours and Earnings - Office for National Statistics Notes: 1. Employees on adult rates, pay unaffected by absence 2. Full-time defined as employees working more than 30 paid hours per week (or 25 or more for the teaching professions) 3. 2012 data are revised, 2013 data are provisional 4. Figures rounded to one decimal place | |||||