Table of contents
- Main points
- Business impact of the coronavirus
- Social impacts of the coronavirus on Great Britain
- Company incorporations and voluntary dissolution applications
- Online job adverts
- Online price change in food and drink basket
- Energy Performance Certificates
- Footfall
- Roads and traffic camera data
- Shipping
- Data
- Glossary
- Measuring the data
- Strengths and limitations
- Related links
1. Main points
According to the latest Business Impact of Coronavirus (COVID-19) Survey, between 24 August and 6 September, 84% of businesses were trading; this has been revised from the 97% estimated last week, as the survey data has now been weighted to be representative of all businesses in the UK, including smaller businesses, which are less likely to have been trading than larger businesses. See Section 2.
The proportion of adults travelling to work at some point during the week increased to 64%, while the proportion exclusively working from home increased slightly to 21%, according to the latest Opinions and Lifestyle Survey collected between 16 and 20 September. See Section 3.
There was a reduction to 940 voluntary dissolution applications per working day in the week ending 18 September, slightly below the Quarter 3 (July to Sept) 2019 average (1,008). See Section 4.
East Midlands continued to see the strongest recovery in the volume of job adverts in the week ending 18 September, whereas London had the slowest, remaining below half of the 2019 average. See Section 5.
Prices of items in the food and drink basket decreased by 0.2% in the week ending 20 September, driven by several categories including soft drinks and spirits. See Section 6.
The number of Energy Performance Certificates (EPCs) across England and Wales was 6% higher for existing dwellings and 3% higher for new dwellings in the week ending 20 September, compared with their levels the same week a year ago. See Section 7.
Overall footfall in the week ending 20 September remained similar to the previous week, whilst footfall in the latest weekend has picked up across high streets and shopping centres. See Section 8.
On Monday 21 September, the volume of all motor vehicle traffic was four percentage points below the levels seen on the first Monday of February, in line with the previous week, according to data from the Department for Transport. See Section 9.
Counts of cars in London were around 3% higher than the average level seen immediately pre-lockdown (11 to 22 March) in the week ending 20 September, according to traffic camera data. See Section 9.
The average volume of daily ship visits was 315 in the week ending 20 September, compared with an average of 377 in the week immediately before lockdown (16 to 22 March). See Section 10.
2. Business impact of the coronavirus
This section includes final results from Wave 13 of the Business Impact of Coronavirus (COVID-19) Survey (BICS) for the period 24 August to 6 September 2020, which closed on 20 September 2020. Out of 23,900 businesses sampled, 25% responded.
For the first time we have weighted estimates for three main variables: the current trading status of the business, the impact of turnover for the business’ financial performance, and the proportions of workforce status. This means responses to BICS have been scaled up to be representative of all businesses in the UK. More information regarding this weighting method and full results are available in Coronavirus and the economic impacts on the UK: 24 September 2020.
The figure for businesses currently trading (84%) is lower than previous releases, reflecting improvements that mean trading status is now weighted by count. Estimates over time follow the same general movements as the unweighted estimates but are at a lower level due to the impact of smaller businesses on the weighted estimates. We find smaller businesses are less likely to have been trading than larger businesses. More information and the evolution of these estimates through the pandemic can be found in Business Impact of Coronavirus (COVID-19) Survey: preliminary weighted results.
Figure 1: When scaled up to be representative of all businesses in the UK, 84% of businesses were currently trading
Headline indicators from the Business Impact of Coronavirus Survey, 24 August to 6 September 2020, UK
Embed code
Source: Office for National Statistics – Business Impact of Coronavirus (COVID-19) Survey
Notes:
All percentages are a proportion of the number of businesses who responded apart from the workforce percentages on furlough leave and receiving pay top-ups, which are proportions of employees for each responding business.
Estimates for trading status have been weighted by count of UK businesses. All remaining estimates are unweighted.
Download the data
The proportion of the furloughed workforce receiving top-ups to their pay in this period will be affected by the change to the furlough scheme; from 1 September all employers must contribute 10% on top of the government’s 70% contribution. However, businesses may have referred to the reference period of the previous two weeks, which included eight days in August. Additionally, there may be delays in businesses’ reporting procedures.
Across all industries, weighted by count of UK businesses:
- 80% of businesses had been trading for more than the last two weeks
- 4% had started trading again within the last two weeks after a pause in trading
- 3% had paused trading but intend to restart trading in the next two weeks
- 10% had paused trading and do not intend to restart in the next two weeks
- 3% had permanently ceased trading
Businesses who had not permanently stopped trading were also asked about their risk of insolvency, shown in Figure 2.
Figure 2: Accommodation and food service activities reported the highest percentage of businesses with a severe or moderate risk of insolvency at 24%, compared with 11% across all industries
Risk of insolvency, businesses who have not permanently stopped trading, broken down by industry, unweighted UK, 24 August to 6 September 2020
Source: Office for National Statistics – Business Impact of Coronavirus (COVID-19) Survey
Notes:
- Bars may not sum to 100% because of rounding, percentages less than 1% being removed for disclosure purposes, and businesses that have become insolvent being removed.
- Other services and Mining and quarrying have been removed for disclosure purposes, but their totals are included in “All Industries”.
- Estimates of insolvency risk are unweighted and therefore may only reflect businesses who responded to the survey.
Download this chart Figure 2: Accommodation and food service activities reported the highest percentage of businesses with a severe or moderate risk of insolvency at 24%, compared with 11% across all industries
Image .csv .xlsMore about coronavirus
4. Company incorporations and voluntary dissolution applications
Incorporations
Figure 4: In the week ending 18 September, there was an average of 3,469 company incorporations per working day, which remains above the Quarter 3 (July to Sept) average (2,612)
Company incorporations per working day, UK, quarterly and weekly, Quarter 1 (Jan to Mar) 2019 to Quarter 2 (Apr to June 2020), and week ending 6 March 2020 to week ending 18 September 2020
Source: Companies House and Office for National Statistics
Notes:
- Data presented per working day to allow comparison between quarterly data and weekly data and account for processing differences associated with bank holidays.
- Quarterly data from Companies House official statistics release, divided by number of working days, presented at the mid-point of the calendar quarter.
- Weekly data are for week starting Saturday to Friday, as incorporation requests received on Saturdays and Sundays are typically processed on subsequent weekdays. For more information, see the accompanying Companies House methodology page.
- Please note that Companies House quarterly official statistics include figures for Community Interest Company (CIC) incorporations, which are not included in the weekly series. Typically, these account for less than 1% of incorporations.
Download this chart Figure 4: In the week ending 18 September, there was an average of 3,469 company incorporations per working day, which remains above the Quarter 3 (July to Sept) average (2,612)
Image .csv .xlsVoluntary dissolution applications
Figure 5: In the week ending 18 September, there was a reduction to 940 voluntary dissolution applications per working day, which is slightly below the Quarter 3 (July to Sept) 2019 average (1,008)
Company voluntary dissolution applications per working day, UK, quarterly and weekly, Quarter 1 (Jan to Mar) 2019 to Quarter 2 (Apr to June) 2020, and week ending 6 March 2020 to week ending 18 September 2020
Source: Companies House and Office for National Statistics
Notes:
- Data presented per working day to allow comparison between quarterly data and weekly data and to account for processing differences associated with Bank Holidays. Quarterly data are presented at the mid-point of the quarter.
- Weekly data are weeks from Saturday to Friday, as voluntary dissolution requests received on Saturdays and Sundays are typically processed on subsequent weekdays. For more information, see the accompanying Companies House methodology page.
Download this chart Figure 5: In the week ending 18 September, there was a reduction to 940 voluntary dissolution applications per working day, which is slightly below the Quarter 3 (July to Sept) 2019 average (1,008)
Image .csv .xlsFor more information on other measures of company closures not presented here, see Weekly indicators of company creations and closures from Companies House methodology: August 2020.
Back to table of contents5. Online job adverts
These figures use job adverts provided by Adzuna, an online job search engine, and include experimental estimates of online job adverts by Adzuna category and by UK country and NUTS1 region. The number of job adverts over time is an indicator of the demand for labour. The Adzuna categories used do not correspond to Standard Industrial Classification (SIC) categories, so these values are not directly comparable with the Office for National Statistics (ONS) Vacancy Survey.
Figure 6: Between 11 and 18 September, total online job adverts increased slightly from 53% to 55% of their 2019 average
Total weekly job adverts on Adzuna, UK, 4 January 2019 to 18 September 2020, index 2019 average = 100
Embed code
Notes:
The observations were collected on a roughly weekly basis; however, they were not all observed at the same point in each week, leading to slightly irregular gaps between each observation.
These series have a small number of missing weeks, mostly in late 2019, and the latest is in January 2020. These values have been imputed using linear interpolation. The data points that have been imputed are clearly marked in the accompanying dataset.
Further category breakdowns are included in the Online job advert estimates dataset, and more details on the methodology can be found in Using Adzuna data to derive an indicator of weekly vacancies.
Download the data
The two percentage point increase in the volume of online job adverts in the last week was spread relatively evenly across the Adzuna categories, with an increase in 20 of the 28 categories (this count excludes the “unknown” category), with all four categories shown in Figure 6 seeing more job adverts compared with the previous week.
In addition, the volume of online job adverts in the Transport, logistics and warehouse category increased fifteen percentage points to 135% of its 2019 average, its highest level since 14 November 2019. Online job adverts also increased six percentage points in the manufacturing category to 64% of its 2019 average, the highest since 20 March 2020, immediately before lockdown was introduced.
Figure 7: The East Midlands continued to see the strongest recovery in the volume of job adverts, whereas London saw the weakest recovery, with job adverts remaining below half of their 2019 average
Total weekly job adverts on Adzuna, UK, 4 January 2019 to 18 September 2020, index 2019 average = 100, percentage points
Embed code
Notes:
- There is a level shift in the Northern Ireland series from 17 October 2019 due to a large source of Northern Ireland job adverts being removed, and another level shift from 7 August 2020 because of a new source being included.
Download the data
The largest increase in online job adverts in the latest period was in the North East, where they increased four percentage points, whilst online job adverts in all other English regions and in Wales increased between one and three percentage points. The East Midlands continued to see the strongest recovery in the volume of job adverts, the only region to reach 70% of its 2019 average since 27 March 2020. Whereas London saw the weakest recovery, with the volume of online job adverts remaining below half of its 2019 average.
Back to table of contents6. Online price change in food and drink basket
A timely indication of weekly price change for a selection of food and drink products from several large UK retailers has been developed, covering the period 1 June to 20 September 2020. Details of the methodology used for these indicators can be found in Online price changes methodology. This analysis is experimental and should not be compared with our regular consumer price statistics.
Online prices of items in the food and drink basket decreased overall by 0.2% between Week 15 and Week 16. Figure 8 presents the contributions to this weekly change from each of the main categories of items.
Figure 8: Prices of items in the food and drink basket decreased by 0.2% in the latest week, driven by several categories including soft drinks and spirits
Contributions to online price change of a selection of food and drink products, UK, percentage point contributions to the percentage change between Week 15 (7 September to 13 September) and Week 16 (14 September to 20 September)
Source: Office for National Statistics – Faster indicators
Notes:
- Contributions may not always sum to the weekly change, as a result of rounding.
Download this chart Figure 8: Prices of items in the food and drink basket decreased by 0.2% in the latest week, driven by several categories including soft drinks and spirits
Image .csv .xlsThe largest contributions to the weekly change were seen in the following:
- mineral waters, soft drink and juices (prices decreased 1.2%) with the largest contributions from energy and fizzy dinks (negative 0.7 percentage points)
- spirits (prices decreased 0.9%), with the largest contributions from Gin and Whiskey (negative 0.6 percentage points)
These downward contributions were partially offset by an increase in fruit (0.4%) with the largest contribution coming from strawberries.
The time series, weekly growth rates and contributions to the weekly change for all individual food and drink items are published in a dataset alongside this release.
Figure 9 shows that the all item index remains below the starting point of the series (1 June), with the overall index at 1.5 index points lower. Oils and fats have had the largest reduction in price since the series began, now 5.1% lower, along with other food products 2.8% below, and bread and cereal, which are 2.2% below the starting point of the beginning of June. Wine has shown the largest increase since the series began, now 1.3% above the starting point of the beginning of June, although prices have fallen slightly in the last two weeks.
Figure 9: The all item index has remained below its Week 1 level (1 June) for the entire time series
Online price change of selected food and drink products 1 June to 20 September: index week 1 (1 to 7 June) = 100, UK
Source: Office for National Statistics – Faster indicators
Notes:
- Week 1 refers to the period 1 to 7 June 2020, and Week 16 refers to the period 14 September to 20 September.
- The time series for all individual food and drink items are published in a dataset alongside this release.
Download this chart Figure 9: The all item index has remained below its Week 1 level (1 June) for the entire time series
Image .csv .xls7. Energy Performance Certificates
Energy Performance Certificates (EPCs) are used as a timely indicator for the number of completed constructions (new EPCs) and number of transactions (existing EPCs). More detailed statistics split by NUTS1 English region are published weekly by the Ministry of Housing, Communities and Local Government (MHCLG).
This release includes weekly EPCs data for new and existing domestic properties in England and Wales from 24 February 2019 up to the week ending 20 September 2020. This section analyses the percentage change compared with the same week the previous year. For example, the latest week ending 20 September 2020 was compared with the week ending 22 September 2019.
Figure 10: In the week ending 20 September, the number of EPCs across England and Wales was 6% higher for existing dwellings and 3% higher for new dwellings than their levels the same week a year ago
Existing and new EPC lodgements for England and Wales combined, non-seasonally adjusted, year-on-year percentage change between EPCs on the same equivalent week in 2019, February to September 2020
Source: Ministry of Housing, Communities and Local Government – Domestic Energy Performance Certificate Register
Notes:
- Further notes and a regional breakdown are available in the weekly Energy Performance Certificates (EPCs) for domestic properties dataset (Excel, 61KB).
- More information on the EPC methods, strengths and limitations is available in the accompanying methodology article.
- In response to the coronavirus (COVID-19) pandemic, the UK government introduced social distancing measures for the property market from 26 March 2020. Restrictions were eased from 13 May 2020, allowing market activity in England to re-commence under restricted conditions. Further guidance is available.
Download this chart Figure 10: In the week ending 20 September, the number of EPCs across England and Wales was 6% higher for existing dwellings and 3% higher for new dwellings than their levels the same week a year ago
Image .csv .xlsCompared with the same week in the previous year, EPC lodgements have returned to levels similar to those seen throughout June and July, with the volume of new and existing EPCs both slightly higher than the same week last year.
With the exception of the week ending 6 September 2020, the volume of existing EPCs was higher than the same week the previous year for every week since 8 June. This can be explained by lower than usual residential property transactions during March to June 2020 and a catch up in property transaction demand thereafter outlined by HM Revenue and Customs (HMRC) UK property transaction statistics (PDF, 336KB).
EPCs for new dwellings saw a slower recovery relative to existing EPCs since May 2020, and the proportion of new EPCs compared with the same week a year ago is still lower than the proportion of existing EPCs compared with the same week a year ago. A reduction in construction would contribute to the delay in EPC assessments of new dwellings.
Back to table of contents8. Footfall
These figures are provided by Springboard, a provider of data on customer activity. They measure the volume of footfall compared with the same day the previous year at the overall level and across the categories of high streets, retail parks and shopping centres. For example, Tuesday 14 July 2020 was compared with Tuesday 16 July 2019.
For the first time, we are including estimates for the overall volume of footfall by UK country and English regions.
Figure 11: In the week ending 20 September, overall footfall remained similar to the previous week, whilst footfall in the latest weekend has picked up across high streets and shopping centres
Volume of footfall, year-on-year percentage change between footfall on the same day, UK, 1 March to 20 September 2020

Source: Springboard and the Department for Business, Energy and Industrial Strategy
Notes:
- The spike on Monday 24 August was caused by the comparison with 26 August 2019 last year, which was bank holiday Monday with good weather. The bank holiday this year was a week later on 31 August.
- Many non-essential shops were allowed to open on 15 June 2020 in England, 12 June 2020 in Northern Ireland and 22 June 2020 in Wales. In Scotland, some non-essential shops were allowed to reopen from 29 June 2020 and more from 13 to 15 July 2020.
- “PM announcement” refers to the advisory announcement on 16 March 2020 to avoid non-essential travel, bars, restaurants and other indoor leisure venues, and to work from home if possible.
- Pubs were allowed to reopen on 4 July in both England and Northern Ireland, with beer gardens allowed to reopen on 6 July in Scotland and 13 July in Wales. Pubs were also allowed to reopen indoors in Scotland on 15 July.
Download this image Figure 11: In the week ending 20 September, overall footfall remained similar to the previous week, whilst footfall in the latest weekend has picked up across high streets and shopping centres
.png (90.2 kB)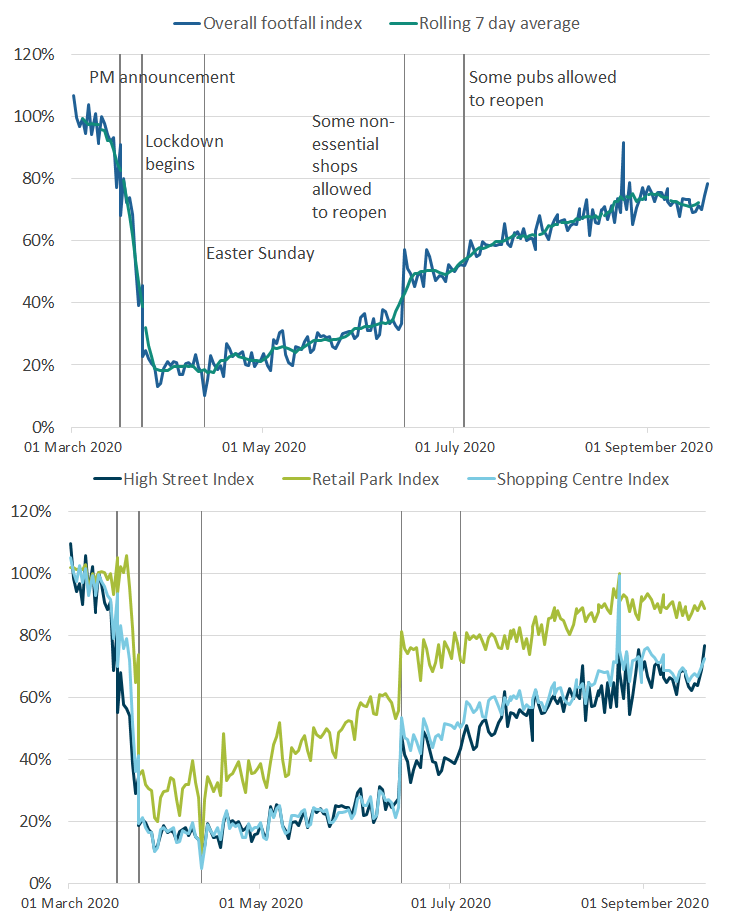
Figure 12: In the week ending 20 September, overall footfall decreased in Wales, whilst footfall levels were similar to the previous few weeks across all other regions and countries
Overall volume of daily footfall, year-on-year percentage change between footfall on the same day, UK, 1 March to 20 September 2020
Embed code
Notes:
The spike across regions on Monday 24 August was caused by the comparison with 26 August 2019 last year, which was bank holiday Monday with good weather. The bank holiday this year was a week later on 31 August.
The spike in Northern Ireland on 10 July coincided with the lifting of restrictions, as well as 10 July 2020 being compared with 12 July 2019 which was the Battle of the Boyne bank holiday.
The spike in Wales on 24 August was caused by comparing 24 August 2020 with 26 August 2019 which was a bank holiday.
Many non-essential shops were allowed to open on 15 June 2020 in England, 12 June 2020 in Northern Ireland and 22 June 2020 in Wales. In Scotland, some non-essential shops were allowed to reopen from 29 June 2020 and more from 13 to 15 July 2020.
Pubs were allowed to reopen on 4 July in both England and Northern Ireland, with beer gardens allowed to reopen on 6 July in Scotland and 13 July in Wales. Pubs were also allowed to reopen indoors in Scotland on 15 July.
Figure 12 shows the volume of footfall in each English region and UK country compared with the same day the previous year. Each region shows a broadly consistent trend throughout the time series, though the highest levels of footfall were seen in the South West and East of England, and lowest in Scotland and Greater London.
In the two weeks from 16 March 2020, footfall declined to around 20% of its level the same time last year. Across all regions, the East and West Midlands showed the lowest footfall at the lockdown low point on 28 March 2020.
On 15 June, many types of non-essential shops and businesses were allowed to reopen in England. This is reflected with a large upward movement across all English regions. The relatively earlier footfall uptick in Northern Ireland and the delay in Scotland and Wales is likely due to the countries different easing timelines compared with England, in particular the government announcements on the reopening of non-essential shops and pubs.
Back to table of contents9. Roads and traffic camera data
Road traffic in Great Britain
The Department for Transport (DfT) produces daily road traffic estimates using data from around 275 automatic traffic count sites across Great Britain covering all road types, which are published weekly.
The daily DfT estimates are indexed to the first week of February and the comparison is to the same day of the week. The data provided are useful as an indication of traffic change rather than actual traffic volumes. More information on the methods, quality and economic analysis for these indicators can be found in the methodology article.
Figure 13: On Monday 21 September, the volume of all motor vehicle traffic was four percentage points below the levels seen on the first Monday of February, in line with the previous week
Daily road traffic index: 100 = same traffic as the equivalent day of the week in the first week of February, 1 March to 21 September 2020, non-seasonally adjusted
Source: Department for Transport – Road traffic statistics: management information
Download this chart Figure 13: On Monday 21 September, the volume of all motor vehicle traffic was four percentage points below the levels seen on the first Monday of February, in line with the previous week
Image .csv .xlsFigure 13 shows road traffic across all motor vehicles has continued to gradually return to levels seen in the first week of February 2020 following a lockdown low point around the end of March.
On Monday 21 September, heavy vehicle traffic was six percentage points higher than traffic seen on the equivalent Monday in the first week of February. Car traffic remained below the levels seen in the first week of February, but over the last few months it has increased from around 30 percentage points below February traffic levels to about eight percentage points below.
Traffic camera activity
Traffic cameras are a valuable source for understanding the level of activity in towns and cities as well as changing patterns of mobility. The UK has thousands of publicly accessible traffic cameras with providers ranging from national agencies to local authorities. Further information on the methodology used to produce these data are available in our methodology article and Data Science Campus blog.
In the accompanying dataset, the following categories are available as non-seasonally adjusted, seasonally adjusted and trend data: cars, motorbikes (only available for London and the North East), buses, trucks, vans, pedestrians and cyclists. The categories are available for the following regions, which give a broad coverage across the UK and represent a range of different-sized settlements in urban and rural settings: Durham, London, Manchester, North East, Northern Ireland, Southend and Reading.
Figure 14: Between 14 and 20 September, in London, counts of cars were around 3% higher than the average level seen immediately pre-lockdown (11 to 22 March), while counts of buses were around 8% lower
Activity in selected areas, daily counts of cars, buses, pedestrians and cyclists, seasonally adjusted, UK, March to September 2020
Embed code
Notes:
31 August was a bank holiday.
In this release, North East traffic data contains a higher than usual number of missing images and hence imputations, which is likely to lead to revisions in future weeks.
Traffic camera images capture the appearance of buses, but they give no indication of the number of passengers using public transport.
Note that for the North East there is no data available for 19 and 20 September due to a technical failure. This should be remedied in future weeks.
Download the data
In the latest week, average daily counts of cars and buses in the North East were broadly similar to their levels immediately before lockdown began (1 to 22 March for the North East); while counts of trucks and vans were slightly higher.
In Northern Ireland, although data collection did not start until 15 May 2020, the data continue to show a gradual increase in cars and pedestrians and cyclists. This trend is also observed across Manchester, Durham and Southend.
More categories and areas are available in the accompanying dataset. Comparison with DfT road traffic estimates is shown in the accompanying traffic camera methodology article, published on 3 September.
Back to table of contents10. Shipping
These shipping indicators are based on counts of all vessels and cargo and tanker vessels. As discussed in Faster indicators of UK economic activity: shipping, we expect the shipping indicators to be related to the import and export of goods.
The time series of daily and weekly passenger visits have been temporarily suspended due to quality concerns. We are investigating and hope to reinstate these series in future releases.
Figure 15: In the week ending 20 September, the average volume of daily ship visits was 315, compared with an average of 377 in the week immediately before lockdown (16 to 22 March)
Daily movements in shipping visits, UK, seasonally adjusted, 1 January 2020 to 20 September 2020
Source: exactEarth
Download this chart Figure 15: In the week ending 20 September, the average volume of daily ship visits was 315, compared with an average of 377 in the week immediately before lockdown (16 to 22 March)
Image .csv .xls
Figure 16: In the week ending 20 September, the average daily volume of visits for cargo ships was 100, compared with an average of 126 in the week immediately before lockdown (16 to 22 March)
Daily movements in shipping visits, UK, seasonally adjusted, 1 January to 20 September 2020
Source: exactEarth
Notes:
- The vertical lines indicate important events. In order, the events are: Storm Ciara; FCO advises against all non-essential international travel; Lockdown begins; UK international travel quarantine begins; travel corridors to 59 countries come into force; storm Ellen; storm Francis.
- The number of visits for Hull are included in these data from 1 June 2020 onwards.
- The seasonally adjusted and trend estimates are estimated using a modified version of the seasonal adjustment method TRAMO-SEATS. More information is available in the Coronavirus and the latest indicators for the UK economy and society methodology.
- The seasonal adjustment method may be limited as this is a short time series.
- Daily and weekly shipping visits and unique visits are available by port in the dataset, along with non-seasonally adjusted aggregate series.
Download this chart Figure 16: In the week ending 20 September, the average daily volume of visits for cargo ships was 100, compared with an average of 126 in the week immediately before lockdown (16 to 22 March)
Image .csv .xls11. Data
Weekly and daily shipping indicators
Dataset | Released 24 September 2020
The weekly and daily shipping indicators dataset associated with the faster indicators of UK economic activity.
Online job advert estimates
Dataset | Released 24 September 2020
Experimental job advert indices covering the UK job market.
Traffic camera activity
Dataset | Released 24 September 2020
Experimental dataset for busyness indices covering the UK
Economic activity, faster indicators, UK
Dataset | Released 24 September 2020
Data on road traffic and Value Added Tax (VAT) data from HM Revenue and Customs (HMRC).
Online weekly price changes
Dataset | Released 24 September 2020
The online price changes for a selection of food and drink products from several large UK retailers. These data are experimental estimates developed to deliver timely indicators to help understand the impact of the coronavirus (COVID-19) pandemic.
Business Impact of COVID-19 Survey (BICS) results
Dataset | Released on 17 September 2020
Responses from the new voluntary fortnightly business survey, which captures businesses responses on how their turnover, workforce prices, trade and business resilience have been affected in the two week reference period.
12. Glossary
Company incorporations
Incorporations are when a company is added to the Companies House register of limited companies. This can also include where an existing business applies to become a limited company, where it was not one before.
Faster indicator
A faster indicator provides insights into economic activity using close-to-real-time big data, administrative data sources, rapid response surveys or Experimental Statistics, which represent useful economic and social concepts.
Voluntary dissolution applications
A voluntary dissolution application is when a company applies to begin dissolution proceedings. As such, they effectively chose to be removed from the Companies House register. For a company to be eligible to voluntarily dissolve, it should not have completed any trading activity for a period of three months.
Back to table of contents13. Measuring the data
Detailed information on the data sources, quality and methodology of the different indicators included in this bulletin is available in the Coronavirus and the latest indicators of the UK economy and society methodology.
More information on the weighting methodology used to make BICS representative of all businesses in the UK is available in Coronavirus and the economic impacts on the UK: 24 September 2020.
We will summarise any crucial updates to the quality or methodology in this section in the future.
Back to table of contents14. Strengths and limitations
Detailed information on the strengths and limitations of the different indicators included in this bulletin is available in the Coronavirus and the latest indicators of the UK economy and society methodology.
We will summarise any crucial updates or warnings in this section in the future.
Back to table of contents
3. Social impacts of the coronavirus on Great Britain
This section includes some headline results from Wave 25 of the Opinions and Lifestyle Survey (OPN) covering the period 16 to 20 September 2020. The full results will be published in Coronavirus and the social impacts on Great Britain on 25 September 2020.
Figure 3 shows that the proportion of working adults who had neither worked from home nor travelled to work fell to 15%, the lowest since the series began. The proportion travelling to work at some point during the week increased to a new post-lockdown high of 64%, while the proportion exclusively working from home increased slightly to 21%. The proportions of adults shopping for necessities and for other things both remained unchanged from the previous week, staying at 74% and 23% respectively.
The proportion of adults who had used a face covering in the previous week when leaving home remained at or above 95% for the sixth consecutive week. Further breakdowns such as the situations when a face covering was worn (for example while shopping) and by the constituent countries of Great Britain, will be available in Coronavirus and the social impacts on Great Britain published on 25 September 2020.
Figure 3: The proportion of working adults who travelled to work at some point during the week increased to 64%, the highest since the series began in mid-May
Proportion of adults, Great Britain, 14 May to 20 September 2020
Source: Office for National Statistics – Opinions and Lifestyle Survey
Notes:
Download this chart Figure 3: The proportion of working adults who travelled to work at some point during the week increased to 64%, the highest since the series began in mid-May
Image .csv .xls